. 2024 Aug 15;22(8):e3002741.
doi: 10.1371/journal.pbio.3002741. eCollection 2024 Aug.

Identification of pathways to high-level vancomycin resistance in Clostridioides difficile that incur high fitness costs in key pathogenicity traits

Affiliations

Identification of pathways to high-level vancomycin resistance in Clostridioides difficile that incur high fitness costs in key pathogenicity traits

Jessica E Buddle et al. PLoS Biol. .

Abstract

Clostridioides difficile is an important human pathogen, for which there are very limited treatment options, primarily the glycopeptide antibiotic vancomycin. In recent years, vancomycin resistance has emerged as a serious problem in several gram-positive pathogens, but high-level resistance has yet to be reported for C. difficile, although it is not known if this is due to constraints upon resistance evolution in this species. Here, we show that resistance to vancomycin can evolve rapidly under ramping selection but is accompanied by fitness costs and pleiotropic trade-offs, including sporulation defects that would be expected to severely impact transmission. We identified 2 distinct pathways to resistance, both of which are predicted to result in changes to the muropeptide terminal D-Ala-D-Ala that is the primary target of vancomycin. One of these pathways involves a previously uncharacterised D,D-carboxypeptidase, expression of which is controlled by a dedicated two-component signal transduction system. Our findings suggest that while C. difficile is capable of evolving high-level vancomycin resistance, this outcome may be limited clinically due to pleiotropic effects on key pathogenicity traits. Moreover, our data identify potential mutational routes to resistance that should be considered in genomic surveillance.


Conflict of interest statement

Summit Therapeutics Inc were industrial partners for JEB’s MRC DiMeN iCASE PhD studentship but had no input in study design, interpretation or manuscript preparation. The authors declare no further competing interests.

Figures
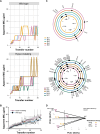
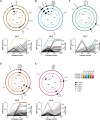
Fig 1
Fig 1. Evolution of vancomycin resistance.
(A) Changes in apparent vancomycin MIC over the course of a 30 transfer experimental evolution. MIC was determined as the well with the lowest vancomycin concentration showing no clear growth. (B) Shown are the means and standard deviations of the apparent MIC for 5 wild-type (open squares) and 5 hyper-mutating (closed circles) populations. Linear regressions fitted to each data set, blue and pink, respectively, are significantly different by ANCOVA, P = 0.0008. The data underlying panels A and B can be found in S5 Data. (C) Shown are the chromosomal locations of non-synonymous variant alleles in isolated wild-type (top) and hyper-mutating (bottom) C. difficile endpoint clones, excluding any mutations that were also identified in any of the control strains. Each circle represents a single C. difficile genome, colour coded according to population as indicated in the key on the left. The data underlying this panel, including a full list of all variants shown here along with synonymous and intergenic mutations, can be found in S2 Data. (D) PCA of P30 isolates from populations Bc1-5 (coloured points) vs. the ancestral strain (black triangle), with PC1 vs. PC2 plotted, accounting for 93% variance. The loadings (sporulation efficiency, growth, MIC, cell length) are shown in respective locations. Arrows show the evolutionary trajectories of wild-type replicate lines from their ancestor in multivariate phenotype space. The data underlying this figure can be found in S5 Data. MIC, minimum inhibitory concentration; PCA, principal component analysis.
Fig 2
Fig 2. Genomic location of gene variants over time.
Accumulation of variants in the wild-type C. difficile lineages Bc1 (A), Bc2 (B), Bc3 (C), Bc4 (D), and Bc5 (E). Each circle plot represents the 4.2 Mb genome of a single evolving population after 10 (inner ring), 20 (middle ring), and 30 passages (outer ring), with the locations of non-synonymous within gene variants indicated with black circles and the penetrance of each mutation in the population indicated by the size of the circle. The line graphs show the frequency of all variants (intergenic, synonymous, non-synonymous, frameshifts and nonsense) in each population. The vancomycin MIC for each population is also indicated by the shaded region. Mutations also identified in the respective end point clone (Fig 1C) are highlighted by the coloured lines. Note population Bc1 evolved an apparent hyper-mutator phenotype prior to P20, with 520 variants identified at that time point. For simplicity, only variants present in P10 and P30 are labelled. The data underlying this figure, including a full list of all variants shown here and those in Bc1 P20, can be found in S3 Data. MIC, minimum inhibitory concentration.
Fig 3
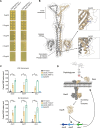
Fig 3. dacS mutations lead to dysregulation of dacJRS.
(A) Vancomycin MICs of R20291ΔPaLoc, R20291ΔPaLoc dacSc.714G>T, and R20291ΔPaLoc dacSc.548T>C as determined by agar dilution. Assays were performed in biological triplicate and technical duplicate, 4 representative spots are shown for each strain. (B) AlphaFold model of DacS as a dimer [26]. The transmembrane domains were identified using DeepTMHMM [27] and the Catalytic ATPase and Dimerization and Histidine Phosphorylation domains were predicted using InterProScan [28]. The locations of Val183 and Glu238 are highlighted in purple on one chain. (C) qRT-PCR analysis of dacJRS expression in R20291ΔPaLoc (black bars), R20291ΔPaLoc dacSc.714G>T (yellow bars), R20291ΔPaLoc dacSc.548T>C (green bars), and R20291ΔPaLocΔdacRS (blue bars). Expression was quantified against a standard curve and normalised relative to the house-keeping gene rpoA. Assays were performed in biological and technical triplicate. Statistical significance was calculated using a two-way ANOVA with the Tukey–Kramer test, ** = P < 0.001. The data underlying this panel can be found in S5 Data. (D) Lack of dacJ up-regulation in R20291ΔPaLocΔdacRS suggests that phosphorylated-DacR acts as an activator of the 2 promoters in the dacJRS cluster, with DacS Glu238Asp or Val183Ala substitutions constitutively activating the function of the TCS, respectively. The consequence is over-expression of DacJ which is then translocated to the cell surface where it can cleave the terminal D-Ala residue in nascent peptidoglycan, thereby preventing vancomycin binding. MIC, minimum inhibitory concentration.
Fig 4
Fig 4. DacJ activity depletes vancomycin binding sites in the cell wall.
(A) Representative phase contrast (left) and fluorescence (right) images of R20291ΔPaLoc, R20291ΔPaLoc dacSc.714G>T, R20291ΔPaLoc dacSc.548T>C, Bc1 and Bc1ΔdacJ labelled with vancomycin-BODIPY. A control of unlabelled R20291ΔPaLoc (top right) is included to show the background fluorescence that C. difficile exhibits in the presence of oxygen [31]. Vancomycin labelling of accessible D-Ala-D-Ala, present during active synthesis of peptidoglycan, is indicated with white arrows. (B) The normalised maximum fluorescent intensities at the centre of individual cells showed that 34% of R20291ΔPaLoc cells had bound vancomycin, compared to no cells in the unlabelled control of the same strain. R20291ΔPaLoc dacSc.714G>T and R20291ΔPaLoc dacSc.548T>C and the evolved endpoint clone Bc1, which all overexpress dacJ, were not labelled when incubated with vancomycin-BODIPY. However, when dacJ was deleted in Bc1 partial labelling was restored (4% of cells were labelled at their mid-point). This was consistent with the incomplete re-sensitisation to vancomycin also observed with this mutant. The black dashed line indicates the normalised max intensity threshold used to delineate cells that have detectable levels of vancomycin-BODIPY at their midplane from those without (obtained by direct visual inspection, normalised max intensity = 1.18). Asterisks indicate the P-values from pairwise comparisons using a two-tailed Fisher’s exact test; ** = P < 0.0001, * = P < 0.05. The data underlying panel B can be found in S5 Data.
Fig 5
Fig 5. vanS mutations lead to dysregulation of the vanG cluster.
(A) qRT-PCR analysis of expression of the genes in the vanG cluster in R20291ΔPaLoc (black bars) and R20291ΔPaLoc vanSc.367_396dup (orange bars). Expression was quantified against a standard curve and normalised relative to the house-keeping gene rpoA. Assays were performed in biological and technical triplicate. Statistical significance was calculated using a two-way ANOVA with the Tukey–Kramer test, ** = P < 0.001. (B) AlphaFold model of VanS as a dimer with (right) and without (left) the vanSc.367_396dup encoded 10 amino acid duplication [26]. The transmembrane domains were identified using DeepTMHMM [27] and the Catalytic ATPase and Dimerization and Histidine Phosphorylation domains were predicted using InterProScan [28]. The location of the 10 amino acid duplication is highlighted on both chains in dark blue. The insertion results in an approx. 90° rotation of the transmembrane domains relative to the catalytic ATPases. (C) Genomic organisation of the vanG cluster. The data underlying this panel A can be found in S5 Data.
Fig 6
Fig 6. Two distinct pathways to resistance.
Relative frequencies and time of emergence of mutations in genes dacS, dacR, dacJ, vanT, and vanS across all 10 evolving populations. The data underlying this figure can be found in S3 Data.

References

    1. Smits WK, Lyras D, Lacy DB, Wilcox MH, Kuijper EJ. Clostridium difficile infection. Nat Rev Dis Primers. 2016;2:16020. Epub 20160407. doi: 10.1038/nrdp.2016.20 ; PubMed Central PMCID: PMC5453186. - DOI - PMC - PubMed
    1. Aguado JM, Anttila VJ, Galperine T, Goldenberg SD, Gwynn S, Jenkins D, et al.. Highlighting clinical needs in Clostridium difficile infection: the views of European healthcare professionals at the front line. J Hosp Infect. 2015;90(2):117–25. Epub 20150311. doi: 10.1016/j.jhin.2015.03.001 . - DOI - PubMed
    1. Lessa FC, Mu Y, Bamberg WM, Beldavs ZG, Dumyati GK, Dunn JR, et al.. Burden of Clostridium difficile infection in the United States. N Engl J Med. 2015;372(9):825–834. doi: 10.1056/NEJMoa1408913 . - DOI - PMC - PubMed
    1. Lawley TD, Clare S, Walker AW, Goulding D, Stabler RA, Croucher N, et al.. Antibiotic treatment of Clostridium difficile carrier mice triggers a supershedder state, spore-mediated transmission, and severe disease in immunocompromised hosts. Infect Immun. 2009;77(9):3661–9. Epub 20090629. doi: 10.1128/IAI.00558-09 ; PubMed Central PMCID: PMC2737984. - DOI - PMC - PubMed
    1. van Nood E, Vrieze A, Nieuwdorp M, Fuentes S, Zoetendal EG, de Vos WM, et al.. Duodenal infusion of donor feces for recurrent Clostridium difficile. N Engl J Med. 2013;368(5):407–15. Epub 20130116. doi: 10.1056/NEJMoa1205037 . - DOI - PubMed

MeSH terms