. 2024 Aug 15;20(8):e1011238.
doi: 10.1371/journal.pgen.1011238. eCollection 2024 Aug.

XOL-1 regulates developmental timing by modulating the H3K9 landscape in C. elegans early embryos

Affiliations

XOL-1 regulates developmental timing by modulating the H3K9 landscape in C. elegans early embryos

Eshna Jash et al. PLoS Genet. .

Abstract

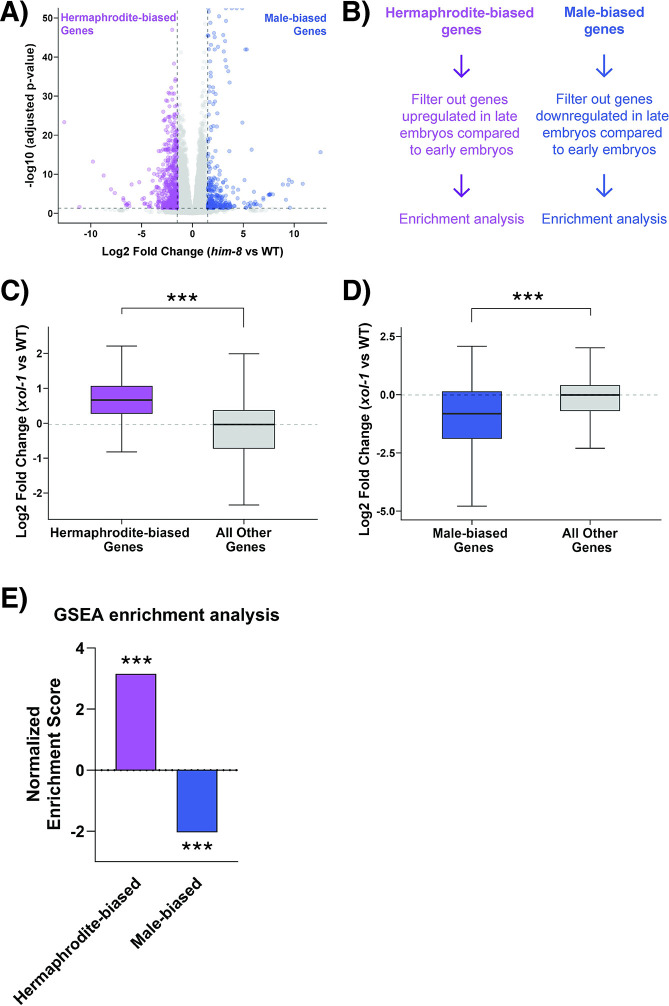
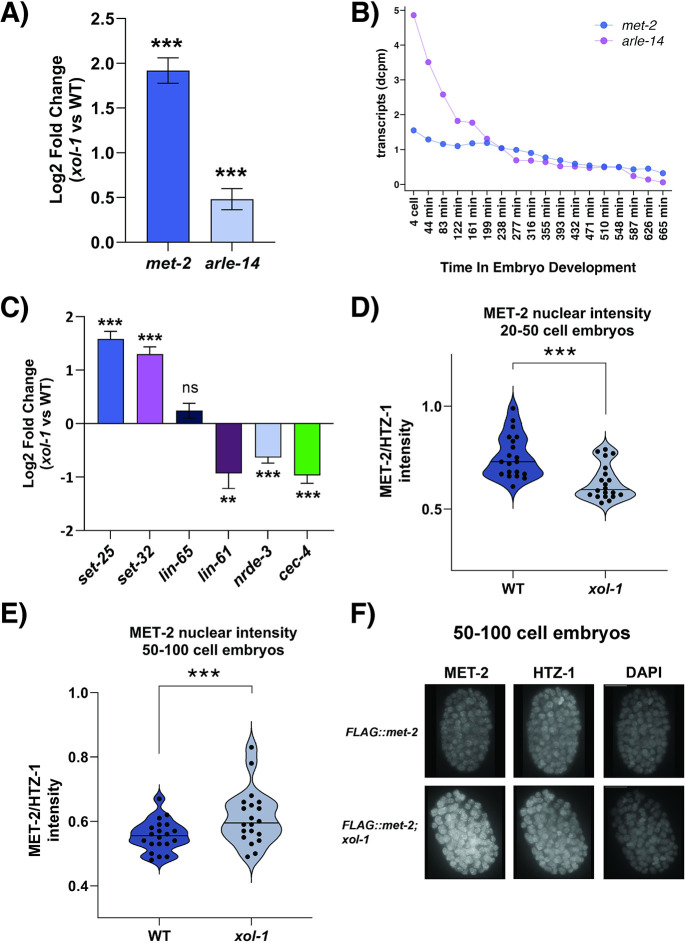
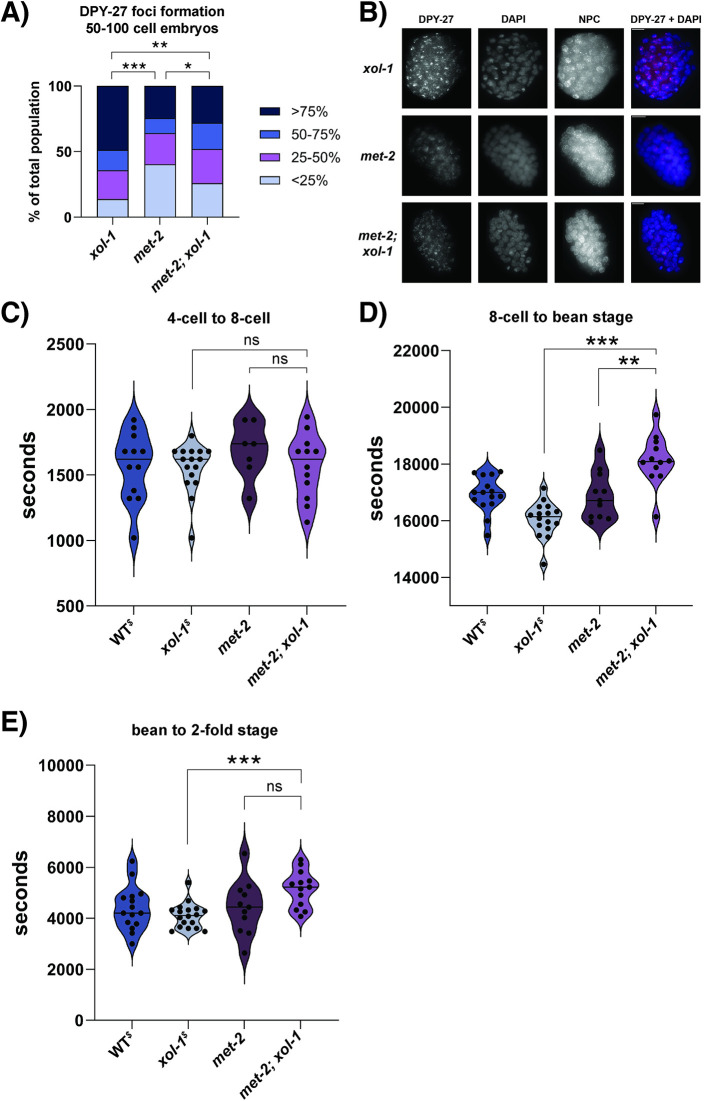
Sex determination in the nematode C. elegans is controlled by the master regulator XOL-1 during embryogenesis. Expression of xol-1 is dependent on the ratio of X chromosomes and autosomes, which differs between XX hermaphrodites and XO males. In males, xol-1 is highly expressed and in hermaphrodites, xol-1 is expressed at very low levels. XOL-1 activity is known to be critical for the proper development of C. elegans males, but its low expression was considered to be of minimal importance in the development of hermaphrodite embryos. Our study reveals that XOL-1 plays an important role as a regulator of developmental timing during hermaphrodite embryogenesis. Using a combination of imaging and bioinformatics techniques, we found that hermaphrodite embryos have an accelerated rate of cell division, as well as a more developmentally advanced transcriptional program when xol-1 is lost. Further analyses reveal that XOL-1 is responsible for regulating the timing of initiation of dosage compensation on the X chromosomes, and the appropriate expression of sex-biased transcriptional programs in hermaphrodites. We found that xol-1 mutant embryos overexpress the H3K9 methyltransferase MET-2 and have an altered H3K9me landscape. Some of these effects of the loss of xol-1 gene were reversed by the loss of met-2. These findings demonstrate that XOL-1 plays an important role as a developmental regulator in embryos of both sexes, and that MET-2 acts as a downstream effector of XOL-1 activity in hermaphrodites.


Conflict of interest statement

The authors have declared that no competing interests exist.

Figures

Fig 1
Fig 1. Transcriptional changes and altered phenotypes associated with xol-1 mutant early embryos.
(A) Volcano plot with genes differentially expressed in xol-1 vs WT early embryo samples, absolute log2 fold change > 1.5 and adjusted p-value < 0.05. (B) Volcano plot with genes differentially expressed in xol-1 vs WT L1 larvae, absolute log2 fold change > 1.5, adjusted p-value < 0.05. (C) Normalized transcript counts (depth of coverage per base per million reads (dcpm)) of xol-1 gene during C. elegans embryogenesis. Dataset obtained from Boeck et. al. (2016) [42]. (D) Embryonic and larval viability scored in xol-1 and WT. None of the differences are statistically significant. P-values obtained from chi-square test with null hypothesis assumption of no significant difference between populations. Error bars indicate SEM. N > 8. (E) Fertilized eggs laid and total eggs laid (fertilized and unfertilized) by xol-1 and WT. Total eggs laid for xol-1 vs WT, p-value = 9.9x10⁻⁵. P-values obtained from chi-square test with null hypothesis assumption of no significant difference between populations. Error bars indicate SEM. n>12. (D-E) Comparisons that are not statistically significant are indicated by n.s, asterisks indicate level of statistical significance (⁎ p<0.05; ⁎⁎ p<0.005; ⁎⁎⁎ p<0.001). (F) Gene ontology analysis on xol-1 vs WT early embryo RNA-seq.
Fig 2
Fig 2. xol-1 embryos have an accelerated developmental timeline.
(A) Histogram depicting the distribution of embryos in xol-1 and WT populations (n = 100). Embryos were binned into categories indicated on the x-axis based on number of nuclei visible by DAPI staining. Statistical test used was the chi-square test, p<0.05 (B-D) Time taken for xol-1 and WT embryos to develop from (B) 4-cell embryo to 8-cell embryo (embryos scored: WT = 12, xol-1 = 16) (C) 8-cell embryo to bean stage embryo (embryos scored: WT = 15, xol-1 = 16) (p-value = 0.0004) and (D) bean stage embryo to 2-fold embryo. (embryos scored: WT = 15, xol-1 = 18) P-values calculated using Welch’s t-test with two-tailed distribution and unequal variance. (E) Boxplot depicting the median log2 fold change in xol-1 vs WT for genes enriched in early embryos (left) and the rest of the dataset (right). p-value = 1.5 x 10⁻⁶, wilcoxon rank-sum test. (F) Boxplot depicting the median log2 fold change in xol-1 vs WT for gene enriched in late embryos (left) and the rest of the dataset (right). p-value = 3.6 x 10⁻⁸, wilcoxon rank-sum test. Early and late embryo datasets obtained from Spencer et. al. (2011) [44]. Asterisks indicate level of statistical significance (⁎ p<0.05; ⁎⁎ p<0.005; ⁎⁎⁎ p<0.001, n.s not significant).
Fig 3
Fig 3. Stage-matched xol-1 embryos have precocious loading of the dosage compensation complex.
(A) Schematic depicting the known roles of xol-1 in embryonic development. (B) Quantification of DPY-27 loading assay in 50–100 cell embryos. Embryos were scored and segregated into 4 categories based on the fraction of nuclei that had visible loading of DPY-27 on the X chromosomes in xol-1 and WT. The categories were <25%, 25–50%, 50–75% and >75%. p = 0.0013. P-values obtained from chi-square test with null hypothesis assumption of no significant difference between populations. Staining against the nuclear pore complex (NPC) was used as an internal control. Embryos scored: N2 = 82, xol-1 = 69. (C) Representative images for experiment quantified in (B). (D) Quantification of DPY-27 loading assay in 20–50 cell embryos. Embryos scored: N2 = 73, xol-1 = 62 (E) Representative images for experiment quantified in (D). (F-G) Quantification of SDC-2 loading assay using TY1::CeGFP::FLAG::sdc-2 and TY1::CeGFP::FLAG::sdc-2; xol-1 embryos in (F) 50–100 cell embryos (p = 0.002). Embryos scored: N2 = 32, xol-1 = 48 (G) 20–50 cell embryos. Embryos scored: N2 = 14, xol-1 = 16. Embryos scored with criteria similar to DPY-27 loading assay. Staining against the nuclear pore complex (NPC) was used as an internal control. Asterisks indicate level of statistical significance (⁎ p<0.05; ⁎⁎ p<0.005; ⁎⁎⁎ p<0.001, n.s not significant).
Fig 4
Fig 4. XOL-1 regulates sex determination pathways in hermaphrodite early embryos.
(A) Volcano plot with genes differentially expressed in him-8 vs WT early embryo samples, absolute log2 fold change>1.5 and adjusted p-value<0.05. Significantly upregulated genes were used to generate the “male-biased” gene set and downregulated genes were used to generate the “hermaphrodite-biased” gene set (B) Schematic representing the filtering strategy used to refine sex-biased gene sets. Time-resolved dataset from Boeck et. al. (2016) [42] was used to filter gene sets. (C-D) Boxplot showing median log2 fold change in xol-1 vs WT for (C) hermaphrodite-biased gene set (left) (p < 2.2 x 10⁻¹⁶) or (D) male-biased gene set (left) (p = 0.01) and the rest of the dataset (right). p-values obtained from wilcoxon rank-sum test (E) Gene set enrichment analysis on xol-1 vs WT dataset using sex-biased gene sets. Asterisks indicate level of statistical significance (* p<0.05, ** p<0.005, *** p<0.001, n.s not significant).
Fig 5
Fig 5. MET-2 and its co-factor ARLE-14 are upregulated in xol-1 embryos.
(A) Transcript levels (dcpm) of met-2 and arle-14 in xol-1 vs WT RNA-seq. Adjusted p-value is determined by wald test with Benjamini-Hochberg correction using DESeq2. Error bars indicate standard error IfcSE. (B) Normalized transcript counts of met-2 and arle-14 genes during C. elegans embryogenesis. Dataset obtained from Boeck et. al. (2016) [42] (C) Transcript levels of lin-65, lin-61, nrde-3 and cec-4 in xol-1 vs WT RNA-seq. Error bars indicate standard error IfcSE (D) 3xFLAG::MET-2 protein levels in xol-1 and WT 20–50 cell embryos. p = 0.0001. MET-2 intensity was normalized to HTZ-1 co-stain. P-values were calculated using Welch’s t-test with two-tailed distribution and unequal variance. 20 nuclei were quantified in total from 7 distinct embryos for each genotype. (E) 3xFLAG::MET-2 protein levels in xol-1 and WT 50–100 cell embryos. p = 0.01. 20 nuclei were quantified in total from 10 distinct embryos for each genotype. Error bars indicate SEM. (F) Representative images of stained embryos quantified in (E). Asterisks indicate level of statistical significance (* p<0.05, ** p<0.005, *** p<0.001).
Fig 6
Fig 6. H3K9 methylation is altered in stage-matched xol-1 embryos.
(A-C, E) Intensity quantification of staged xol-1 and WT embryos. (A) H3K9me2/H3 in 20–50 cell embryos, p = 2.9 x 10⁻⁶ and (B) H3K9me2/H3 in 50–100 cell embryos, p = 4.2 x 10⁻¹⁴. (C) H3K9me3/HTZ-1 in 50–100 cell embryos, p = 6.1 x 10⁻⁷. (D) Representative images of staining quantified in (C) and (E) H3K9me3/HTZ-1 in 20–50 cell embryos, p = 0.005. P-values were calculated using Welch’s t-test with two-tailed distribution and unequal variance. 21 nuclei were quantified in total for each condition, representing nuclei from at least 7 embryos. Asterisks indicate level of statistical significance (* p<0.05, ** p<0.005, *** p<0.001, n.s not significant). Error bars indicate SEM.
Fig 7
Fig 7. Loss of met-2 in xol-1 background leads to the reversal of some xol-1 phenotypes.
(A) Quantification of DPY-27 loading assay in xol-1, met-2 and met-2; xol-1 50–100 cell embryos. Embryos were scored and segregated into 4 categories based on the fraction of nuclei that had visible loading of DPY-27 on the X chromosomes. The categories were <25%, 25–50%, 50–75% and >75%. xol-1 vs met-2, p < 0.00001, met-2 vs met-2; xol-1, p = 0.041, xol-1 vs met-2; xol-1, p = 0.003. P-values obtained from chi-square test with null hypothesis assumption of no significant difference between populations. Staining against the nuclear pore complex (NPC) was used as an internal control. Embryos scored: xol-1 = 123, met-2 = 139, met-2; xol-1 = 150 (B) Representative images for experiment quantified in (A). (C-E) Time taken for WT, xol-1, met-2 and met-2; xol-1 embryos to go from (C) 4-cell embryo to 8-cell embryo (embryos scored: N2 = 12, xol-1 = 16, met-2 = 7, met-2; xol-1 = 12) (D) 8-cell embryo to bean stage embryo, xol-1 vs met-2; xol-1, p = 1.16 x 10⁻⁶, met-2 vs met-2; xol-1, p = 0.001 (embryos scored: N2 = 15, xol-1 = 16, met-2 = 11, met-2; xol-1 = 12) and (E) bean stage embryo to 2-fold embryo, xol-1 vs met-2; xol-1, p = 0.0001 (embryos scored: N2 = 15, xol-1 = 18, met-2 = 11, met-2; xol-1 = 13). (C-E) P-values calculated using Welch’s t-test with two-tailed distribution and unequal variance. Asterisks indicate level of statistical significance (⁎ p<0.05; ⁎⁎ p<0.005; ⁎⁎⁎ p<0.001, n.s not significant). $ notation on WT$ and xol-1$ indicates that the data is from the same experiment as Fig 2B–2D.

References

    1. Carmi I, Meyer BJ. The primary sex determination signal of Caenorhabditis elegans. Genetics. 1999. Jul;152(3):999–1015. doi: 10.1093/genetics/152.3.999 - DOI - PMC - PubMed
    1. Meyer BJ. Mechanisms of sex determination and X-chromosome dosage compensation. Genetics. 2022. Feb 1;220(2):iyab197. doi: 10.1093/genetics/iyab197 - DOI - PMC - PubMed
    1. Sulston JE, Albertson DG, Thomson JN. The Caenorhabditis elegans male: postembryonic development of nongonadal structures. Dev Biol. 1980. Aug;78(2):542–76. doi: 10.1016/0012-1606(80)90352-8 - DOI - PubMed
    1. Wolff JR, Zarkower D. Chapter 1 Somatic Sexual Differentiation in Caenorhabditis elegans. In: Sex Determination and Sexual Development [Internet]. Academic Press; 2008. p. 1–39. (Current Topics in Developmental Biology; vol. 83). Available from: https://www.sciencedirect.com/science/article/pii/S0070215308004018. - PubMed
    1. Lau AC, Csankovszki G. Balancing up and downregulation of the C. elegans X chromosomes. Current Opinion in Genetics & Development. 2015. Apr 1;31:50–6. - PMC - PubMed

MeSH terms