. 2024 Aug 16;385(6710):757-765.
doi: 10.1126/science.adn5658. Epub 2024 Aug 15.

Structure and inhibition of SARS-CoV-2 spike refolding in membranes

Affiliations

Structure and inhibition of SARS-CoV-2 spike refolding in membranes

Michael W Grunst et al. Science. .

Abstract

The severe acute respiratory syndrome coronavirus 2 (SARS-CoV-2) spike protein binds the receptor angiotensin converting enzyme 2 (ACE2) and drives virus-host membrane fusion through refolding of its S2 domain. Whereas the S1 domain contains high sequence variability, the S2 domain is conserved and is a promising pan-betacoronavirus vaccine target. We applied cryo-electron tomography to capture intermediates of S2 refolding and understand inhibition by antibodies to the S2 stem-helix. Subtomogram averaging revealed ACE2 dimers cross-linking spikes before transitioning into S2 intermediates, which were captured at various stages of refolding. Pan-betacoronavirus neutralizing antibodies targeting the S2 stem-helix bound to and inhibited refolding of spike prehairpin intermediates. Combined with molecular dynamics simulations, these structures elucidate the process of SARS-CoV-2 entry and reveal how pan-betacoronavirus S2-targeting antibodies neutralize infectivity by arresting prehairpin intermediates.


Conflict of interest statement

Competing interests: A.F. is an inventor on a provisional patent application on the CV3-25 monoclonal antibody at The Fred Hutchinson Cancer Research Center (patent no. WO2022/140845). All other authors declare no conflicts of interest.

Figures

Fig. 1.
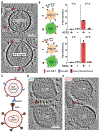
Fig. 1.. SARS-CoV-2 spike-ACE2 complexes and fusion intermediates captured at membrane-membrane interfaces.
(A) Representative tomographic slices of (top) MLV particles decorated with ACE2 and (bottom) HIV particles decorated with spike. (B) (Left) Cartoon representation of VLP-to-cell fusion nanoluciferase complementation assay. (Right) Spike-decorated (spike+), ACE2-decorated (ACE2+), or bald VLPs (−) containing CypA-HiBiT were incubated with endurazine-labeled target cells expressing (top) spike or (bottom) ACE2 and membrane-bound PH-LgBiT at 4° and 37°C for 1 hour before assessment of NanoLuc (Promega) activity. Error bars indicate the standard deviation from triplicate infections. Data shown are representative from two independent experiments. (C) Cartoon representation of interacting (bottom) spikeVLPs and (top) ACE2VLPs. (D and E) Representative tomographic slices of spike- and ACE2-decorated VLPs co-incubated at (D) 4°C or (E) 37°C. Red arrowheads indicate spikes at the membrane-membrane interfaces.
Fig. 2.
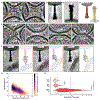
Fig. 2.. Spikes are cross-linked by ACE2 dimers in membranes.
(A) Representative tomographic slices of spike- and ACE2-decorated VLPs co-incubated at 4°C in the presence of CV3-25 Fab. (Top) One or (bottom) multiple CV3-25 Fabs can be seen binding to the spike stem-helix. Magenta arrows indicate CV3-25 Fab, and blue arrows indicate ACE2 cross-linking spikes. Colored annotations are shown at right (blue, ACE2; brown, spike; magenta, CV3-25). (B) The distances between interacting spike-and ACE2-VLP membranes in the presence (n = 302 interfaces) and absence (n = 93 interfaces) of CV3-25 Fab were compared by using a Mann-Whitney U test (****P < 0.0001). (C) The distributions of membrane distance values in the presence and absence of CV3-25 Fab are compared. (D) Tilt angles of spike-ACE2 complexes on virion surfaces were plotted against their respective spikeVLP-ACE2VLP membrane distances. The color mapping indicates the point density determined through kernel density estimation. No Antibody, 93 distinct membrane distances and 683 spike angles; +CV3-25 Fab, 302 distinct membrane distances and 1269 spike angles. (E) Spike-ACE2 complexes were aligned through subtomogram averaging (EMD-42857). The image shows a central slice through the averaged EM density. Images at right correspond to dashed lines that indicate top-view slices along the length of the spike. (F and G) Isosurface representations of (F) the spike-ACE2 complex with (G) the fitted atomic model of spike binding to soluble ACE2 [PDB 7EDJ (41)]. Brown, spike; blue, ACE2. (H) Local-resolution estimation of the spike-ACE2 structure is shown. The red arrowheads indicate lower-resolution areas in ACE2. (I to K) Isosurface representations of three classes of ACE2 molecules determined by means of subtomogram averaging and classification focusing on ACE2-RBD interface within spike-ACE2 complexes. (I) One-RBD-bound ACE2 dimer (EMD-42875). (J) Two-RBD-bound ACE2 dimer (EMD-42876). (K) RBD-bound ACE2 monomer (EMD-42877). PDB 6M17 was fit into the EM density maps (42). In (J), the second RBD from a different cross-linked spike is shown in yellow. The red arrowhead indicates imperfect agreement (red coloring) between the EM map and atomic model. (L) The relative class percentages of ACE2 bound with RBD are shown.
Fig. 3.
Fig. 3.. Spikes transition to prehairpin intermediates after temperature activation.
(A) A representative tomographic slice of spike- and ACE2-decorated VLPs co-incubated at 37°C. Prehairpin intermediates (brown) are distinguished from postfusion structures (yellow) by their opposite topology. (B and C) Central slices of EM density maps obtained from subtomogram averaging of (B) spike prehairpin intermediates (EMD-42859) and (C) postfusion spikes (EMD-42865). (D) Isosurface representations of the (left) prehairpin intermediate and (right) postfusion spike. PDB 8FDW was fit into the postfusion density map (11). (E) Representative tomographic slices of prehairpin intermediates observed at various stages of S2 refolding. (Left) Extended intermediates. Red annotation indicates membrane protrusion. (Left middle and right middle) Partial backfolding. (Right) Contracting membranes. (F) Classification of the prehairpin intermediates revealed distinct classes with spikeVLP membranes present at different angles relative to ACE2VLP membranes (yellow line). Central slices through the EM density maps (left) along with the isosurface views (right) are shown. Models from all-atom MD simulations of spike refolding were selected on the basis of their agreement with EM density maps. Residues 706 to 814 and 919 to 1234 of the spike protein and glycans associated with Asn1158, Asn1173, and Asn1194 are shown (magenta). (G) Tilt angles of prehairpin intermediates on virion surfaces were plotted against their respective spikeVLP-ACE2VLP membrane distances. The color mapping indicates the point density determined through kernel density estimation. The scatter plot contains 909 distinct membrane distances corresponding to 2095 individual spike angles. (H) The distributions of simulated ensembles, that agree with prehairpin intermediate EM density maps, throughout the time course of MD simulations. The time points of the models fitted in the EM density maps (F) are labeled. Distributions were compared by using a Kruskal Wallis test with Dunn’s multiple comparisons test (****P < 0.0001). Low tilt, n = 10,732 structures; medium tilt, n = 13,002 structures; high tilt, n = 121,139 structures.
Fig. 4.
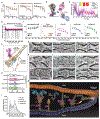
Fig. 4.. Broadly neutralizing antibodies to stem-helix inhibit spike refolding.
(A) Neutralization activities of stem-helix antibodies against VLPs bearing spikes from indicated betacoronaviruses. Infectivity [percent relative light units (RLUs)] is shown, and error bars indicate standard deviation from duplicate wells. Results are representative of at least three independent experiments. (B) Models of CV3-25 [magenta; PDB 7NAB (14)] and CC25.106 [blue; PDB 8DGU (27)] bound to SARS-CoV-2 stem-helix peptide were superimposed on the prefusion spike [PDB 6XR8 joined to a model of the full-length S2 stem (7, 9)]. CC25.106 shows a clash in binding with the prefusion spike. (C) AbASA for CV3-25 epitope (magenta) and CC25.106 epitope (blue) along a simulated prefusion-to-postfusion transition of the spike. (D) MD simulations of spike refolding in the presence and absence of CV3-25 Fab with an applied normal membrane force of 47.3 pN. The distances between the TM and the heptad region 1 (HR1) of the spike protein along simulated trajectories with and without CV3-25 were calculated (fig. S12). (E) A representative structural snapshot from the simulated trajectories in (D) is shown. CV3-25 (magenta) can halt the prefusion-to-postfusion transition of the spike protein by blocking the HR2-HR1 zippering process of one of the monomers (blue). (F) Stem-helix antibodies and the RBD-targeting antibody CV3-1 were compared for their virus neutralization activity before and after attachment to target cells by using HIV-decorated spike virions with an HIV-integrated Gaussia luciferase reporter. Error bars indicate the standard deviation from triplicate wells, and results shown are representative of three independent experiments. (G) SpikeVLPs and ACE2VLPs were coincubated at 37°C in the presence of CV3-25 Fab. Three representative tomographic slices are shown with magenta arrowheads indicating Fab (left), and brown and magenta annotations corresponding to prehairpin intermediate spike and CV3-25 Fab, respectively (right). The yellow arrowhead indicates a postfusion spike. (H to J) Two representative tomographic slices of spikeVLPs and ACE2VLPs co-incubated at 37°C in the presence of (H) CV3-25, (I) CC25.106, and (J) CC99.103. The antibodies are indicated by arrows (leftimages), and the prehairpin intermediate spikes (brown) and antibodies (magenta, blue, or green) are annotated (right images). Multiple IgG domains may be visible. (K) The distances between interacting spike-and ACE2-bearing membranes in the presence and absence of indicated antibodies were compared by using a Kruskal-Wallis test and Dunn’s multiple comparisons test (****P < 0.0001, **P < 0.01). No Antibody (No Ab), n = 909 interfaces; CV3-25, n = 374 interfaces; CC25.106, n = 385 interfaces; CC99.103, n = 111 interfaces. (L) The distributions of membrane distance values in the presence and absence of indicated antibodies are compared. (M) A summary graphic of the structure and inhibition of spike refolding in membranes. The image was generated by using the simulated intermediate atomic models from Dodero-Rojas et al. and PDBs 6M17, 7EDJ, 7NAB, and 8FDW (7, 11, 14, 41, 42). The glossy encasing around atomic models indicates EM density from this study.

References

    1. Duan L et al. , Front. Immunol 11, 576622 (2020). - PMC - PubMed
    1. Pak AJ, Yu A, Ke Z, Briggs JAG, Voth GA, Nat. Commun 13, 1002 (2022). - PMC - PubMed
    1. Marcink TC et al. , Sci. Adv 8, eabo3153 (2022). - PMC - PubMed
    1. Benton DJ et al. , Nature 588, 327–330 (2020). - PMC - PubMed
    1. Hoffmann M et al. , Cell 181, 271–280.e8 (2020). - PMC - PubMed

Publication types

MeSH terms

LinkOut - more resources