Randomized Controlled Trial
. 2024 Aug 14;32(8):1444-1454.e6.
doi: 10.1016/j.chom.2024.07.010.

Maternal antibiotic prophylaxis during cesarean section has a limited impact on the infant gut microbiome

Affiliations
Randomized Controlled Trial

Maternal antibiotic prophylaxis during cesarean section has a limited impact on the infant gut microbiome

Trishla Sinha et al. Cell Host Microbe. .

Abstract

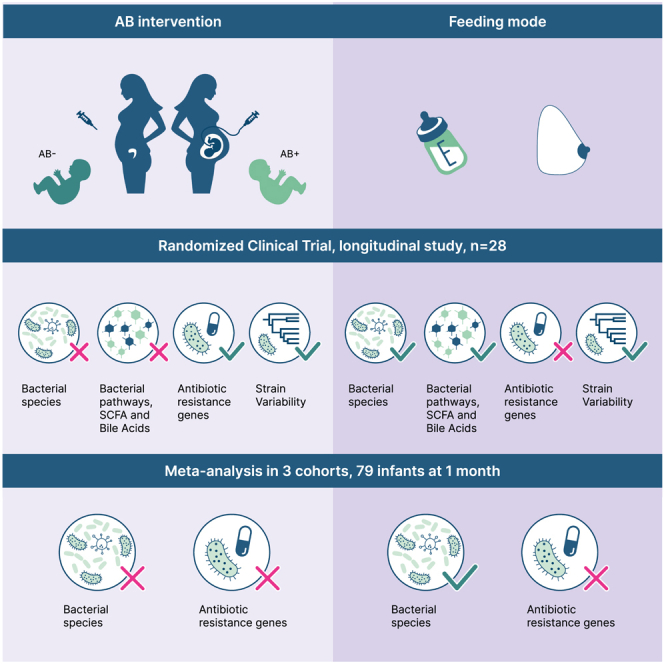
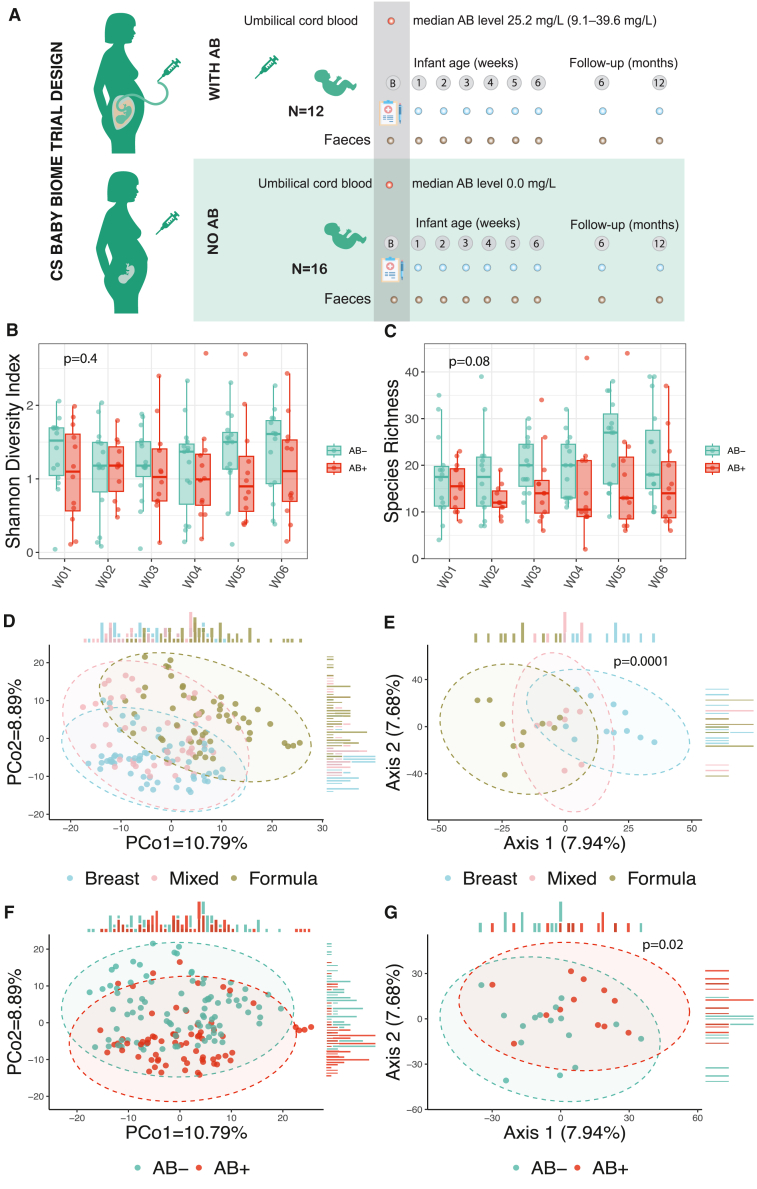
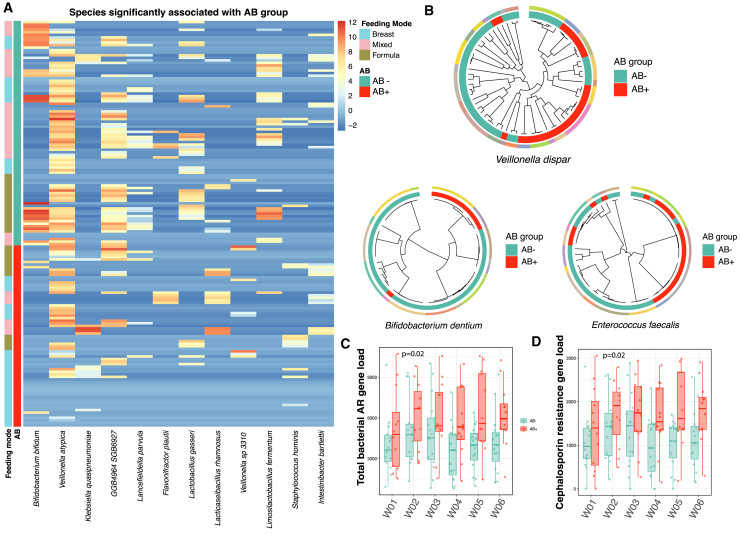
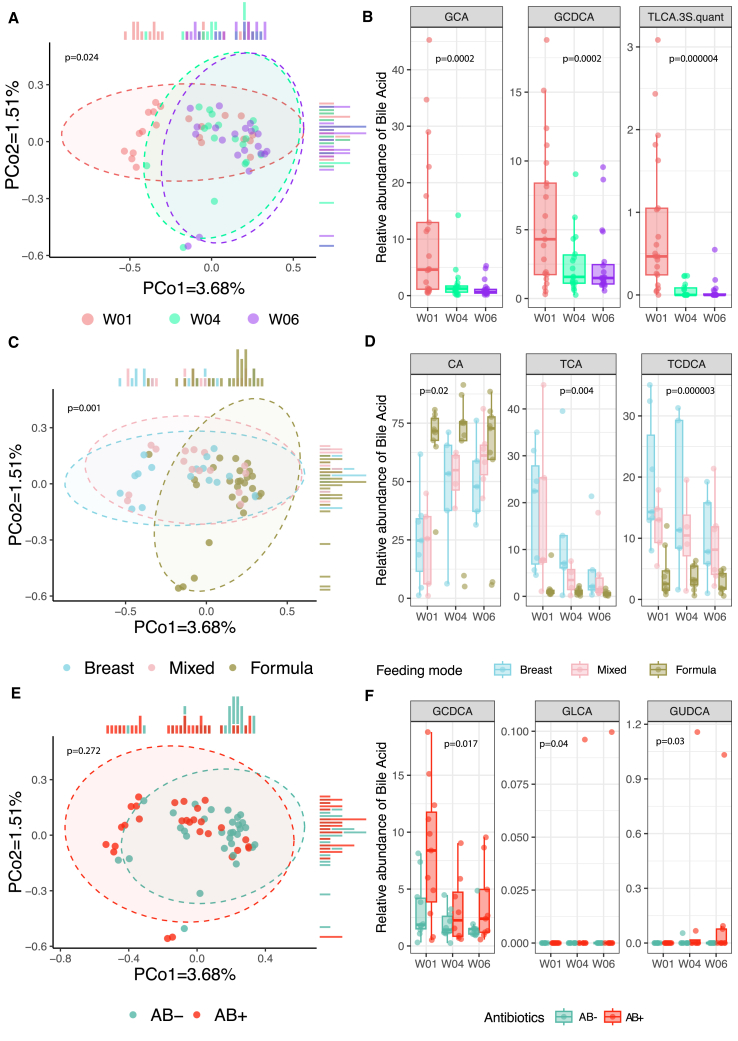
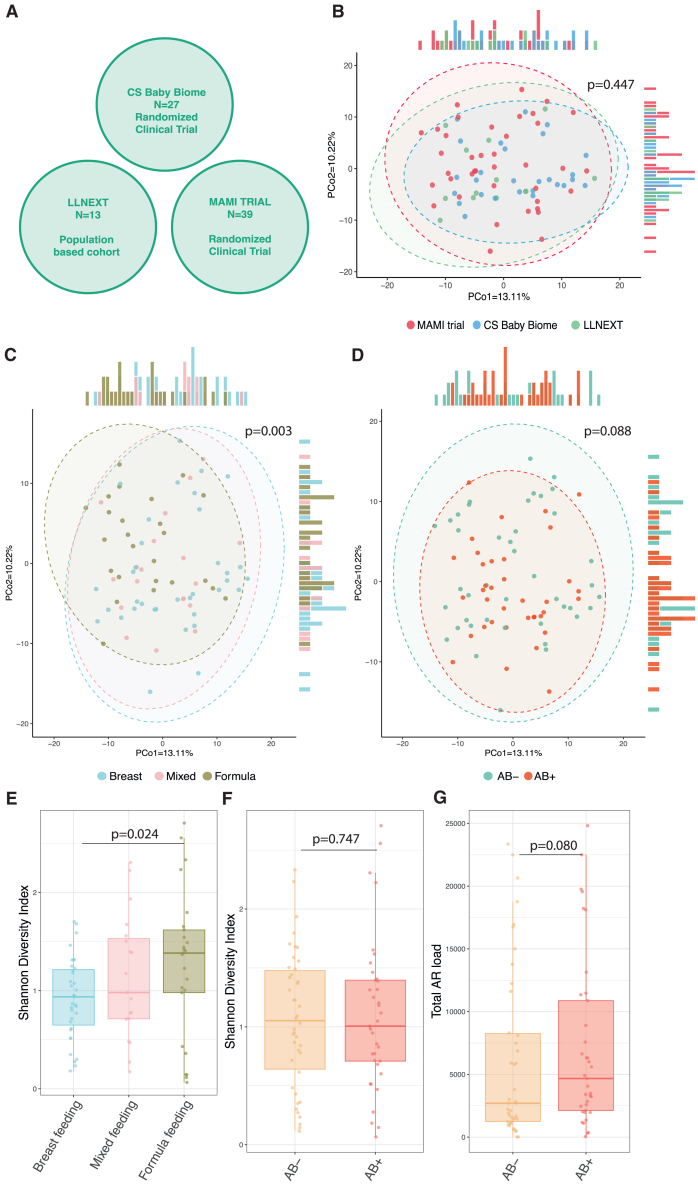
Pregnant women undergoing a cesarean section (CS) typically receive antibiotics prior to skin incision to prevent infections. To investigate if the timing of antibiotics influences the infant gut microbiome, we conducted a randomized controlled trial (NCT06030713) in women delivering via a scheduled CS who received antibiotics either before skin incision or after umbilical cord clamping. We performed a longitudinal analysis on 172 samples from 28 infants at 8 post-birth time points and a cross-sectional analysis at 1 month in 79 infants from 3 cohorts. Although no significant associations with bacterial composition, metabolic pathways, short-chain fatty acids, and bile acids were found, we observed subtle differences between the groups at the bacterial strain level and in the load of antibiotic resistance genes. Rather, feeding mode was a predominant and defining factor impacting infant microbial composition. In conclusion, antibiotic administration during CS has only limited effects on the early-life gut microbiome.

Keywords: antibiotic resistance genes; cesarean section; feeding mode; infant gut microbiome; maternal prophylactic antibiotics; resistome; strain variability.


Conflict of interest statement

Declaration of interests T.d.M. has served as a speaker for Danone Nutricia Research and Mead Johnson. The funders had no role in study design, data analysis, data interpretation, writing of the manuscript, and the decision to publish.

Figures

None
Graphical abstract
Figure 1
Figure 1
Study design and microbiome composition differences between the AB+ and AB− groups of infants (A) Study design. (B) Alpha diversity of the microbiome at the species level represented by Shannon diversity index. (C) Species richness defined as the total number of non-zero species calculated at the species level. In (B) and (C), x axis depicts the time point after birth in weeks (weeks 1–6). p values are derived from a linear mixed-effect model without correction for other phenotypes. Boxplots visualize the median, hinges (25th and 75th percentiles), and whiskers extending up to 1.5 times the interquartile range from the hinges. (D) Principal coordinates analysis (PCoA) plot using Aitchison distances. Dot color indicates feeding mode of the infant at each time point. (E) Leading TCAM factors. Colors indicate the major feeding mode of the infant over 6 weeks of life. Each dot represents one infant. p value derived from a PERMANOVA test with 10,000 permutations without correction for other phenotypes. (F) PCoA plot using Aitchison distances. Dot color indicates AB+ or AB− group. (G) Leading TCAM factors. p value derived from a PERMANOVA test with 10,000 permutations without correction for other phenotypes. When correcting for infant feeding mode and maternal BMI, p value is 0.10 (Table S2C). Dot color indicates AB+ or AB− group. Each dot represents one infant. In (B)–(D) and (F), the sample sizes at each of the time points are as follows: group AB+: W01 (n = 12), W02 (n = 11), W03 (n = 12), W04 (n = 12), W05 (n = 12), W06 (n = 12); group AB−: W01 (n = 14), W02 (n = 14), W03 (n = 15), W04 (n = 15), W05 (n = 15), W06 (n = 15). In (E) and (G), sizes for each of the groups are as follows: AB+ (n = 12), AB− (n = 16).
Figure 2
Figure 2
Microbial species, strain, and antibiotic resistance (AR) gene load differences between the AB+ and AB− groups of infants (A) Heatmap of species nominally significant (p < 0.05) between the AB+ and AB− groups of infants as derived from a linear mixed model (see STAR Methods). The sample sizes at each of the time points are as follows: group AB+: W01 (n = 12), W02 (n = 11), W03 (n = 12), W04 (n = 12), W05 (n = 12), W06 (n = 12); group AB−: W01 (n = 14), W02 (n = 14), W03 (n = 15), W04 (n = 15), W05 (n = 15), W06 (n = 15). (B) Phylogenetic trees of three species associated with AB group. Colors on the outer circle represent each individual infant. AB+ and AB− groups are depicted in the inner circles. Each tip represents a sample; samples sizes for each of the species-level genomic bins (SGBs) are as follows: Veillonella dispar (n = 67 samples from 22 infants), Bifidobacterium dentium (n = 49 samples from 13 infants), and Enterococcus faecalis (n = 54 samples from 15 infants). (C) Total bacterial AR gene load between the two groups. x axis depicts the time point after birth in weeks (weeks 1–6). p value derived from a linear mixed-effect model without correction for other phenotypes. The sample sizes at each of the time points are as follows: group AB+: W01 (n = 12), W02 (n = 11), W03 (n = 12), W04 (n = 12), W05 (n = 12), W06 (n = 12); group AB−: W01 (n = 14), W02 (n = 14), W03 (n = 15), W04 (n = 15), W05 (n = 15), W06 (n = 15). (D) Total AR gene load grouped by class cephalosporins. x axis depicts the time point after birth in weeks (weeks 1–6). p value derived from a linear mixed-effect model without correction for other phenotypes. The sample sizes at each of the time points are as follows: group AB+: W01 (n = 12), W02 (n = 11), W03 (n = 12), W04 (n = 12), W05 (n = 12), W06 (n = 12); group AB−: W01 (n = 14), W02 (n = 14), W03 (n = 15), W04 (n = 15), W05 (n = 15), W06 (n = 15). Boxplots visualize the median, hinges (25th and 75th percentiles), and whiskers extending up to 1.5 times the interquartile range from the hinges.
Figure 3
Figure 3
Infant fecal bile acids in relation to time point, feeding mode, and antibiotic groups (A) PCoA plot using Canberra distances. Dot color indicates the time point. p value was derived from a PERMANOVA test with 999 permutations without correction for other phenotypes. (B) Boxplots of the relative abundance of the most significantly associated bile acids with time. p value derived from a linear mixed-effect model without correction for other phenotypes. GCA, glycocholic acid; GCDCA, glycochenodeoxycholic acid; TLCA.3S.quant, taurolithocholic acid 3-sulfate. (C) PCoA plot using Canberra distances. Dot color indicates the feeding mode of each infant at each time point. p values derived from a PERMANOVA test with 999 permutations without correction for other phenotypes. (D) Boxplots of the relative abundance of the most significantly associated bile acids with feeding mode (Table S6B). p value derived from a linear mixed-effect model without correction for other phenotypes. CA, cholic acid; TCA, taurocholic acid; TCDCA, taurochenodeoxycholic acid. (E) PCoA plot using Canberra distances. Dot color indicates the antibiotic group the infant belongs to (AB+ or AB−). p values derived from a PERMANOVA test with 999 permutations after correction for feeding mode. (F) Boxplots of the relative abundance of the most significantly associated bile acids with AB group after correction for feeding mode (Table S6C). GCDCA, glycochenodeoxycholic acid; GLCA, glycolithocholic acid; GUDCA, glycoursodeoxycholic acid. In (A)–(F), each dot represents a sample, with the following sample sizes: W01 (n = 21), W04 (n = 18), and W06 (n = 20) from a total of 22 unique infants. Boxplots visualize the median, hinges (25th and 75th percentiles), and whiskers extending up to 1.5 times the interquartile range from the hinges.
Figure 4
Figure 4
Combined results of the CS Baby Biome, MAMI trial, and Lifelines NEXT (A) Diagram showing the cohorts used in the combined analysis, together with the sample sizes. (B) PCoA plot showing the overall composition of the gut microbiome of infants of all cohorts. Each dot represents a single infant of either the MAMI trial (red), CS Baby Biome (blue), or Lifelines NEXT (LLNEXT in figure; green) at the age of 1 month. p value derived from a PERMANOVA test with 10,000 permutations without correction for other phenotypes (Table S5C). (C) PCoA plot showing the overall composition of the gut microbiome of infants of all cohorts. Each dot represents a single infant, and dot color indicates feeding mode (blue, breastfeeding; pink, mixed feeding; and khaki, formula feeding). Feeding mode significantly influences overall gut microbiome composition in infants, with the combined data of all cohorts explaining 5% of the variation of the infant microbiome at 1 month of age. p value derived from a PERMANOVA test with 10,000 permutations without correction for other phenotypes (Table S5C). (D) PCoA plot showing the overall composition of the gut microbiome of infants of all cohorts. Each dot represents a single infant, and dot color indicates AB+ or AB− group. p value derived from a PERMANOVA test with 10,000 permutations without correction for other phenotypes (Table S5C). (E) Shannon diversity index at 1 month was higher in formula-fed infants than breastfed infants (p = 0.024, Table S5A). (F) No difference was found in the Shannon diversity index between AB+ and AB− groups (p = 0.747, Tables S5A and S5B). (G) No significant difference was found in total AR load between the AB+ and AB− groups (p = 0.080, Table S5G). In (E)–(G), boxplots visualize the median, hinges (25th and 75th percentiles), and whiskers extending up to 1.5 times the interquartile range from the hinges.

References

    1. Neuman H., Forsythe P., Uzan A., Avni O., Koren O. Antibiotics in early life: dysbiosis and the damage done. FEMS Microbiol. Rev. 2018;42:489–499. doi: 10.1093/femsre/fuy018. - DOI - PubMed
    1. Yassour M., Vatanen T., Siljander H., Hämäläinen A.-M., Härkönen T., Ryhänen S.J., Franzosa E.A., Vlamakis H., Huttenhower C., Gevers D., et al. Natural history of the infant gut microbiome and impact of antibiotic treatment on bacterial strain diversity and stability. Sci. Transl. Med. 2016;8 doi: 10.1126/scitranslmed.aad0917. - DOI - PMC - PubMed
    1. Bokulich N.A., Chung J., Battaglia T., Henderson N., Jay M., Li H., D Lieber A., Wu F., Perez-Perez G.I., Chen Y., et al. Antibiotics, birth mode, and diet shape microbiome maturation during early life. Sci. Transl. Med. 2016;8 doi: 10.1126/scitranslmed.aad7121. - DOI - PMC - PubMed
    1. Korpela K., Salonen A., Virta L.J., Kekkonen R.A., Forslund K., Bork P., de Vos W.M. Intestinal microbiome is related to lifetime antibiotic use in Finnish pre-school children. Nat. Commun. 2016;7 doi: 10.1038/ncomms10410. - DOI - PMC - PubMed
    1. National Institute for Health and Clinical Excellence . 2021. NICE guideline [NG192]https://www.nice.org.uk/guidance/ng192 - PubMed

Publication types

LinkOut - more resources