. 2024 Oct;634(8034):729-736.
doi: 10.1038/s41586-024-07920-0. Epub 2024 Aug 15.

Structure of a fully assembled γδ T cell antigen receptor

Affiliations

Structure of a fully assembled γδ T cell antigen receptor

Benjamin S Gully et al. Nature. 2024 Oct.

Abstract

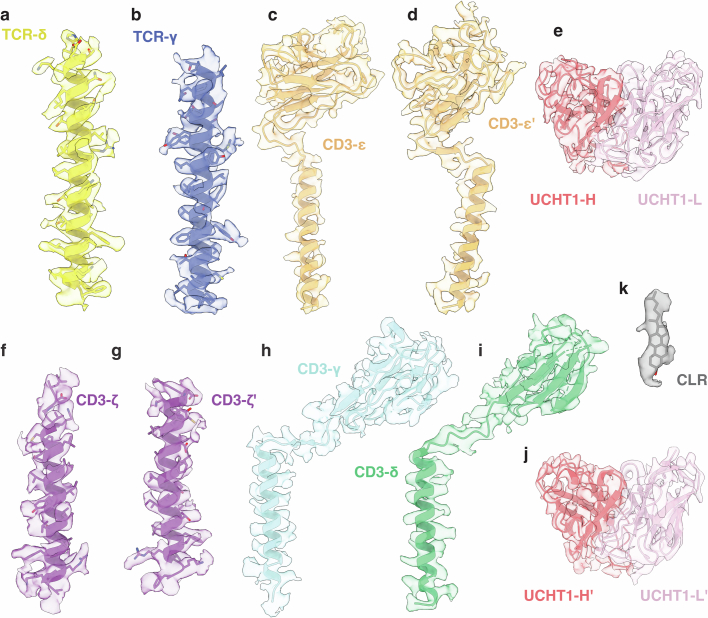
T cells in jawed vertebrates comprise two lineages, αβ T cells and γδ T cells, defined by the antigen receptors they express-that is, αβ and γδ T cell receptors (TCRs), respectively. The two lineages have different immunological roles, requiring that γδ TCRs recognize more structurally diverse ligands1. Nevertheless, the receptors use shared CD3 subunits to initiate signalling. Whereas the structural organization of αβ TCRs is understood2,3, the architecture of γδ TCRs is unknown. Here, we used cryogenic electron microscopy to determine the structure of a fully assembled, MR1-reactive, human Vγ8Vδ3 TCR-CD3δγε2ζ2 complex bound by anti-CD3ε antibody Fab fragments4,5. The arrangement of CD3 subunits in γδ and αβ TCRs is conserved and, although the transmembrane α-helices of the TCR-γδ and -αβ subunits differ markedly in sequence, packing of the eight transmembrane-helix bundles is similar. However, in contrast to the apparently rigid αβ TCR2,3,6, the γδ TCR exhibits considerable conformational heterogeneity owing to the ligand-binding TCR-γδ subunits being tethered to the CD3 subunits by their transmembrane regions only. Reducing this conformational heterogeneity by transfer of the Vγ8Vδ3 TCR variable domains to an αβ TCR enhanced receptor signalling, suggesting that γδ TCR organization reflects a compromise between efficient signalling and the ability to engage structurally diverse ligands. Our findings reveal the marked structural plasticity of the TCR on evolutionary timescales, and recast it as a highly versatile receptor capable of initiating signalling as either a rigid or flexible structure.


Conflict of interest statement

The authors declare no competing interests.

Figures

Fig. 1
Fig. 1. Overall structure of the fully assembled γδ TCR.
a, Overview of the 3.01 Å consensus cryo-EM map of the G83.C4 γδ TCR bound by UCHT1 antibody Fab fragments and viewed parallel to the plane of the membrane, with the inset showing a representative reference-free, two-dimensional class average from an equivalent orientation for reference. b, Ribbon representation of the subunits of the G83.C4 γδ TCR, individually colour coded: TCR-δ (yellow), TCR-γ (blue), CD3-ε (orange), CD3-δ (green), CD3-γ (cyan), CD3-ζ (purple) and UCHT1 Fab heavy and light chains (red and pink, respectively); membrane boundaries are indicated by black lines. Approximate complex dimensions are 165 × 130 Å2. The three layers refer to distinct regions of protein contact forming the assembly.
Fig. 2
Fig. 2. Interactions in the TM helical bundle of the γδ TCR.
a, Overview of the 3.39 Å TM-focused model of the G83.C4 γδ TCR. b, Ribbon representation of the G83.C4 γδ TCR TM region and the TCR-γδ, CD3-δε, CD3-γε and CD3-ζζ helical dimers comprising layer 3 of the receptor assembly. c, Conserved charged TM contacts (the view is the same as in b (left), rotated by 90° along an axis in the plane of the page). d, TM contacts of the TCR-γ and -δ subunits. e, Comparison of the organization of the TM helices in the apo αβ TCR (PDB 6JXR, grey) versus their counterparts in the γδ TCR. Arrows and arrowheads represent changes in position between the two complexes, measuring below 5 Å throughout. f, Sequence logos for the γδ TCR TM regions showing the conservation of key TM contacts, highlighted by the yellow (TCR-δ) and blue (TCR-γ) rectangles. Subunits are coloured as in Fig. 1, with dashed lines indicating unmodelled regions of the structure. Residues are numbered throughout according to the full-length (that is, unprocessed) sequence.
Fig. 3
Fig. 3. Interactions involving CD3 ECDs in the G83.C4 γδ TCR.
a, Comparison of the organization of the CD3 heterodimers in the TM-focused model of the G83.C4 γδ TCR and an αβ TCR (PDB 7PHR). The TCR-γ and TCR-δ subunits of the γδ TCR, and the CD3 subunits, are coloured as in Fig. 1, with the αβ TCR shown in greyscale. b, Comparison of CD3 ECD displacement within the two complexes, with the centres of mass of the CD3 heterodimers coloured red for the γδ TCR and black for the αβ TCR, showing shifts of up to around 8 Å in positions of the subunits between the complexes. Both complexes were solved bound to UCHT1 Fab fragments, allowing comparison. c,d, Layer 1 interactions between CD3-δε and -γε heterodimers in the αβ (c) and γδ (d) TCRs. In d, the view of the αβ TCR presented in c is shown in greyscale, and because the main-chain position in the region of Glu38 in the γδ TCR could not be confidently modelled, movement in the region of the adjacent residue, Asp39, is shown. e,f, Stabilizing effects of interactions in the regions of the layer 2 vicinal cysteines of CD3-δε (e) and CD3-γε (f).
Fig. 4
Fig. 4. Structural heterogeneity of the G83.C4 γδ TCR.
a, A Gaussian-filtered version of the 3.01 Å consensus G83.C4 γδ TCR reconstruction (grey volume), showing the clear signal for the TCR-γδ heterodimer ECD, which was variably positioned relative to the CD3 assembly, shown in ribbon format and coloured as in Fig. 1. b, Additional data processing allowed the reconstruction of a low-resolution map of the G83.C4 TCR-γδ heterodimer ECD (grey surface), at the cost of knowing the position of the remainder of the receptor. Positioning of the previously determined structure of a soluble, chimeric G83.C4 TCR-γδ heterodimer ECD (comprising C-α and C-β domains; PDB 7LLI) within the reconstruction was undertaken using Chimera. c, Superposition of a known TCR-γδ heterodimer ECD with the TCR-αβ heterodimer ECD (PDB 7PHR) within the CD3 complex indicates that a shortened TCR-δ constant domain DE loop, relative to that of TCR-α, would remove key contacts to CD3-δ. d, The longer CPs of the G83.C4 γδ TCR are clearly mobile, although the reconstruction shows a 10 Å shift in the positions of the TCR-α and -δ CPs when aligned with the αβ TCR. γδ TCR subunits are coloured as in Fig. 1a; TCR-α and -β subunits are coloured red and pink, respectively.
Fig. 5
Fig. 5. Effects of γδ and αβ TCR flexibility on TCR ligand sensitivity.
a, Representative flow cytometry plots depicting the level of CD69 expression by either TCR knockout Jurkat T cells or AF-7 WT or G83.C4 WT TCR-transduced Jurkat T cells, cocultured for either 20 h (top) or 4 h (bottom), with C1R cells treated with 1 nM 5-OP-RU. b, Mean fluorescence intensity (MFI) of CD69 expression by AF-7 and G83.C4 TCR-transduced Jurkat T cells cocultured for 4 h with C1R cells treated with 5-OP-RU at a range of concentrations (0.0001–1.0 nM). c, TCR phosphorylation analysis based on single-molecule imaging of TCR and phospho-CD3ζ clusters and the degree of their colocalization (Methods), following stimulation of Jurkat T cells expressing the AF-7 TCR (red), G83.C4 TCR (dark blue) or a chimeric TCR (G83/AF7CH, light blue; see d), on ICAM1 or ICAM1 + MR1(5-OP-RU)-bearing bilayers. d, Cartoon schematic of the G83.C4 and AF-7 WT and chimeric TCR constructs (AF7/G83CH and G83/AF7CH). e, FLIM–FRET efficiency for Jurkat T cell transductants labelled with fluorescent donor MR1(5-OP-RU)-Atto 594 and fluorescent acceptor UCHT1 Fab-Alexa Fluor 647. f, Schematic depicting the structures of the antigen receptors, including depictions of the γδ TCR (this work), the IgM BCR and the αβ TCR. b,e, P values were calculated using Student’s t-test (b) or one-way analysis of varance with Tukey’s multiple-comparisons test (e). Error bars represent ±s.d. (b) or s.e.m. (e). c, Thick horizontal lines indicate the median, and thin lines the quartiles. ac,e, Data are representative of n = 2 cocultures in either two independent experiments (a), two independent experiments analysing n = 3 cocultures each (b), two independent experiments each including n ≥ 12 cells (c) or two independent experiments each including n ≥ 14 cells (e).
Extended Data Fig. 1
Extended Data Fig. 1. Purification of the fully assembled γδ TCR and effects of UCHT1 Fab binding on signaling.
a, Schematic representation of the constructs used for G83.C4 γδ TCR expression. b, Flow cytometric validation of TCR expression in CHO-S γδ TCR-expressing cells (red) versus CHO-S WT cells (grey), or CHO-S cells used for GPa3b17 αβ TCR expression (blue). Expression was verified via GFP2 expression (left panel), anti-γδ TCR antibody staining (middle panel) and anti-CD3ε antibody staining (right panel). c, Analytical size-exclusion chromatography of purified G83.C4 γδ TCR. Fractions collected are labelled in pink. d, SDS-PAGE analysis of fractions from (c), boiled under reducing conditions. This is a single gel from one experiment. e, Mean fluorescence intensity (MFI) of CD69 expression by G83.C4 TCR-transduced Jurkat T-cells co-cultured with C1R cells expressing WT levels of MR1, treated with different amounts of 5-OP-RU in the presence of the indicated concentrations of UCHT1 Fab. Circles represent n = 3 treated cultures from a single experiment representative of two independent experiments. Error bars represent +/− SD. f, FACS plots showing fluorescent UCHT1 antibody staining of cells pre-incubated with increasing concentrations of UCHT1 Fab, confirming saturating Fab binding at the higher concentrations assayed. The experiment shown is based on the staining of a single culture (n = 1) and is representative of two independent experiments.
Extended Data Fig. 2
Extended Data Fig. 2. Cryo-EM analysis of the G83.C4 γδ TCR–UCHT1 Fab complex.
Selected 2D class averages and data processing workflow for the G83.C4 γδ TCR–UCHT1 complex reconstructions and iterative processing optimization, are shown. Gold-standard FSC curves calculated from two independently refined half-maps indicate an overall resolution of 3.01 Å at FSC = 0.143. The local resolution-filtered display of resolution (Å) coloured from highest resolution (red) to lowest resolution (blue) is also shown.
Extended Data Fig. 3
Extended Data Fig. 3. Cryo-EM processing workflow for the TM-focused G83.C4 γδ TCR reconstruction.
Data processing workflow for the TM-focused G83.C4 γδ TCR–UCHT1 complex reconstruction and iterative processing optimization, are shown. Gold-standard FSC curves calculated from two independently refined half-maps indicate an overall resolution of 3.39 Å at FSC = 0.143. The local resolution-filtered display of resolution (Å) coloured from highest resolution (red) to lowest resolution (blue) is also shown.
Extended Data Fig. 4
Extended Data Fig. 4. Density-to-model agreement of the G83.C4 γδ TCR–UCHT1 Fab complex in the consensus map.
a-j, Density corresponding to the TCR-δ, TCR-γ, CD3-ε, CD3-δ, CD3-ε′, CD3-γ, CD3-ζ, CD3-ζ′, UCHT1 and UCHT1′ polypeptides are shown for the global 3.01 Å reconstruction. Chains are coloured as in Fig. 1; map threshold is ~0.13.
Extended Data Fig. 5
Extended Data Fig. 5. Density-to-model agreement of the G83.C4 γδ TCR–UCHT1 Fab complex in the TM-focused map.
a-j Density corresponding to the TCR-δ, TCR-γ, CD3-ε, CD3-δ, CD3-ε′, CD3-γ, CD3-ζ, CD3-ζ′, UCHT1 and UCHT1′ polypeptides and, k, for the transmembrane-located cholesterol-like molecule (CLR), are shown for the TM-focused 3.39 Å reconstruction. Chains are coloured as in Fig. 1; map threshold is ~0.13.
Extended Data Fig. 6
Extended Data Fig. 6. Bound surface areas (BSAs) for αβ and G83.C4 γδ TCRs.
a, Structural depiction of TCR-α and -β chains in the αβ TCR complex and TCR-γ and TCR-δ chains in the TM-focused γδ TCR structure, with interacting regions labelled. b, BSA (%) in each of the αβ TCR regions, and the TM helices of the γδ TCR only (due to flexibility of the TCR-γδ ECDs and CPs), coloured with respect to the fraction of contact made with the indicated CD3 subunits. c, Alignments of α and β, and γ and δ constant regions, and CP and TM helical region sequences. The TCR-α and -β subunit/CD3 contacts shown in bold are coloured according to the individual CD3 subunit contact made. Conserved TCR-δ and -γ subunit contacts are highlighted in yellow. d, Poor evolutionary conservation of CP sequences of TCR-α, -β, -δ, and -γ subunits. Sequence logos illustrate the degree of amino acid conservation in exon 2 of mammalian sequences [TCR-α, -δ sequences: 11 species; TCR-β, -γ sequences: 10 species (C1 sequence only used)]. The structure of the pMHC-bound GPa3b17 TCR (PDB 7PHR) was used for the comparisons in (a,b). e, Variation in TCR-γ CP sequences across mammalian species encoded by TRGC genes. Highlighted in dark blue is the human TRGC1-encoded CP of the γδ TCR studied here. Mean length is represented by red bars. f, Length and variation of CP sequences encoded by mammalian TRDC genes. Highlighted in yellow is the human TRDC-encoded CP.
Extended Data Fig. 7
Extended Data Fig. 7. Cholesterol modeling and mass spectrometric analysis of the G83.C4 γδ TCR.
a,b Ribbon representations of the G83.C4 TCR-γδ-CD3 TM region showing the possible location of a cholesterol-like moiety proximal to the inner membrane leaflet and C-termini of the CD3-ζ, CD3-γ, and TCR-γ TM helices, capped by R52 of CD3-ζ, with map threshold ~0.13 in (b). c, Mass spectrometry-derived chromatographic feature consistent with the ammonium adduct of cholesterol (positive mode m/z = 404.38667 – 404.39071) at 16.6 min (arrow) in a purified G83.C4 γδ TCR sample and a positive control cholesterol sample, but not the negative control sample (d). e, In-source fragmentation consistent with the loss of ammonia and water was also observed (fragment ion m/z = 369.34973 – 369.35343) at 16.6 min in the G83.C4 γδ TCR sample and positive control, but not the negative control sample. f, Region corresponding to the outer leaflet cholesterol binding site of the αβ TCR (PDB 8ES7), which appears to be blocked by Met254 of the TCR-γ TM helix in the γδ TCR.
Extended Data Fig. 8
Extended Data Fig. 8. Comparison of the UCHT1 interfaces.
Structural alignment of the CD3-δε and CD3-γε extracellular domains of the G83.C4 γδ TCR complexed with UCHT1 Fab fragments, versus the soluble CD3-δε-UCHT1 complex structure (CRY; PDB 1XIW) reveals minimal change at the respective interfaces.
Extended Data Fig. 9
Extended Data Fig. 9. Additional analysis of the G83.C4 TCR-γδ ECD arrangement in the γδ TCR.
Data processing workflow for reconstruction of the G83.C4 TCR-γδ ECD. Following optimized processing of the initial reconstruction, the flexible region of the G83.C4 γδ TCR required particle subtraction and ab initio model generation to enable a modest-resolution reconstruction of this part of the sample to be obtained.
Extended Data Fig. 10
Extended Data Fig. 10. Structural comparisons of the TCR-αβ and -γδ subunit constant domains in the context of the CD3 subunits.
Comparison of γδ TCR constant region loops (PDB 4LFH) in the setting of the CD3δγε2ζ2 complex following alignment with an αβ TCR constant chain domain (PDB 7PHR). TCR electrostatics are shown as a surface and individual chains are coloured as in Fig. 1. a, DE loop; b, FG loop; and c, AB loop. The shorter inter-strand loops of the γδ TCR constant region would likely reduce CD3 contact, favouring TCR-γδ ECD mobility.
Extended Data Fig. 11
Extended Data Fig. 11. Characterization of cell lines used for functional assays.
a, FACS plots showing CD3 expression levels (as measured by UCHT1-AF488 staining) on parental Jurkat T-cells (dark grey), TCR-knockout (KO) Jurkat T-cells (light grey), or TCR-KO Jurkat T-cells transduced with AF-7 (dark red), G83.C4 (dark blue), AF7/G83CH (light red), and G83/AF7CH (light blue) TCRs. Data shown are from a single culture (n = 1) from one experiment. b, MFI quantification of CD69 expression levels on transductants activated for 4 h on plate-bound OKT3, as determined by flow cytometric analysis for WT (dark grey), TCR-KO (light grey), and AF-7-expressing (dark red) and G83.C4-expressing (dark blue) Jurkat T-cells. Circles represent measurements from n = 3 co-cultures from one experiment, representative of two independent experiments. Bar charts and error bars represent mean +/− SD. c, FACS plots of MR1-PE tetramer staining of Jurkat transductants (left panel), as in (a), and quantification of MR1 tetramer MFI plotted against UCHT1 MFI from (a) (right panel). Quantification of the ratio of UCHT1 and MR1 tetramer MFI is depicted in the table inset. Data are from a single culture (n = 1) from one experiment. d, MFI quantification of CD69 expression levels on transductants activated for 4 h on plate-bound OKT3, as determined by flow cytometric analysis of WT (dark grey) and TCR-KO (light grey) Jurkat T-cells, and Jurkat T-cells expressing AF-7 (dark red), G83.C4 (dark blue), AF7/G83CH (light red), and G83/AF7CH (light blue) TCRs. Circles represent measurements from n = 3 co-cultures from one experiment. Bar charts and error bars represent mean +/− SD.
Extended Data Fig. 12
Extended Data Fig. 12. Single-molecule and FLIM-FRET imaging of cells expressing WT and chimeric TCRs.
a, Representative dSTORM images generated for cells expressing AF-7 (left panels), G83.C4 (middle panels), and chimeric G83/AF7CH receptors (right panels) when stimulated with increasing amounts of MR1-5-OP-RU on an SLB and stained with anti-CD3-AF647 (red) and anti-pCD3ζ-AF568 (green) antibody. Scale bar = 5 µm. b,c Number and average area of TCR clusters as quantified by DBSCAN. Data are from two independent experiments each using n ≥ 12 cells. Error bars represent ± SEM. d, Confocal images generated for fluorescent donor MR1(5-OP-RU)-Atto 594 (green, left panels)- and fluorescent acceptor anti-UCHT1 Fab-AF647 (red, center panels)-presenting Jurkat T-cells, expressing AF-7 (top panels), G83.C4 (middle panels), or chimeric G83/AF7CH TCRs (bottom panels). A heatmap of FLIM-FRET efficiency between TCR and MR1 monomers (right panels), with colour representing highest to lowest efficiencies (red to blue) is also shown. Close-ups of selected regions in the confocal images are shown as x5 enlarged images. Data are representative of two independent experiments each including n ≥ 14 cells. Scale bar = 5 µm. e, FLIM-FRET efficiency is independent of local TCR density. FRET efficiencies across various regions of interest (ROI), including punctate regions of corresponding donor and acceptor fluorescence and the entire cell area, are shown. The ROI FRET efficiencies (%) in the FRET heatmap are also indicated. Scale bar = 3 μm.

References

    1. Willcox, B. E. & Willcox, C. R. γδ TCR ligands: the quest to solve a 500-million-year-old mystery. Nat. Immunol.20, 121–128 (2019). - PubMed
    1. Dong, D. et al. Structural basis of assembly of the human T cell receptor-CD3 complex. Nature573, 546–552 (2019). - PubMed
    1. Sušac, L. et al. Structure of a fully assembled tumor-specific T cell receptor ligated by pMHC. Cell185, 3201–3213 (2022). - PMC - PubMed
    1. Rice, M. T. et al. Recognition of the antigen-presenting molecule MR1 by a Vδ3+γδ T cell receptor. Proc. Natl Acad. Sci. USA118, e2110288118 (2021). - PMC - PubMed
    1. Beverley, P. C. & Callard, R. E. Distinctive functional characteristics of human “T” lymphocytes defined by E rosetting or a monoclonal anti-T cell antibody. Eur. J. Immunol.11, 329–334 (1981). - PubMed

MeSH terms

LinkOut - more resources