Observational Study
. 2024 Oct:533:113743.
doi: 10.1016/j.jim.2024.113743. Epub 2024 Aug 13.

Development and optimization of a diluted whole blood ELISpot assay to test immune function

Affiliations
Observational Study

Development and optimization of a diluted whole blood ELISpot assay to test immune function

Ricardo F Ungaro et al. J Immunol Methods. 2024 Oct.

Abstract

Sepsis remains a leading cause of death worldwide with no proven immunomodulatory therapies. Stratifying Patient Immune Endotypes in Sepsis ('SPIES') is a prospective, multicenter observational study testing the utility of ELISpot as a functional bioassay specifically measuring cytokine-producing cells after stimulation to identify the immunosuppressed endotype, predict clinical outcomes in septic patients, and test potential immune stimulants for clinical development. Most ELISpot protocols call for the isolation of PBMC prior to their inclusion in the assay. In contrast, we developed a diluted whole blood (DWB) ELISpot protocol that has been validated across multiple laboratories. Heparinized whole blood was collected from healthy donors and septic patients and tested under different stimulation conditions to evaluate the impact of blood dilution, stimulant concentration, blood storage, and length of stimulation on ex vivo IFNγ and TNFα production as measured by ELISpot. We demonstrate a dynamic range of whole blood dilutions that give a robust ex vivo cytokine response to stimuli. Additionally, a wide range of stimulant concentrations can be utilized to induce cytokine production. Further modifications demonstrate anticoagulated whole blood can be stored up to 24 h at room temperature without losing significant functionality. Finally, we show ex vivo stimulation can be as brief as 4 h allowing for a substantial decrease in processing time. The data demonstrate the feasibility of using ELISpot to measure the functional capacity of cells within DWB under a variety of stimulation conditions to inform clinicians on the extent of immune dysregulation in septic patients.

Keywords: Adaptive immunity; Cytokine; Immune function; Innate immunity; Sepsis.


Conflict of interest statement

Declaration of competing interest M.B.M., K.E.R., and I.R.T. are members of Immune Functional Diagnostics, LLC (IFDx LLC) and receive no direct financial compensation. IFDx LLC is developing predictive metrics in critical illness and this technology is evaluated in this research. S.C·B, L.L.M., R.S.H., and the University of Florida may receive royalty income based on a technology developed by S.C.B. and others and licensed by Washington University in St. Louis to IFDx LLC. That technology is evaluated in this research. C.C.C. and the University of Cincinnati may receive royalty income based on a technology developed by C.C.C. and others and licensed by Washington University in St. Louis to IFDx LLC. That technology is evaluated in this research.

Figures

Figure 1.
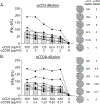
Figure 1.. Titration of diluted whole blood from healthy donors show the dynamic range for detecting the IFNγ or TNFα response after 22 hours stimulation with anti-CD3/CD28 mAb or LPS, respectively.
Blood samples from 5 healthy donors were diluted 1:2, 1:5, 1:10, 1:20, 1:50, 1:100, 1:200, and 1:500 with kit media prior to adding 50 μL to the wells of an ELISpot plate for 22 hours stimulation with either anti-CD3/CD28 mAb (0.5 μg/mL and 5 μg/mL) or LPS (2.5 ng/mL). Unstimulated blood samples were step up in parallel wells to determine spontaneous IFNγ or TNFα spot-forming units (SFU) numbers. The number of (A) IFNγ and (B) TNFα SFU are shown. Lines in each graph connect samples from the same donor and columns represent the mean for each blood dilution. Representative well images showing SFU are presented next to each stimulation condition.
Figure 2.
Figure 2.. The response to anti-CD3/CD28 mAb stimulation is dependent on the dose of anti-CD3 mAb used.
Blood samples from 7 healthy donors were diluted 1:10 with kit media prior to adding 50 μL to the wells of an ELISpot plate for 22 hours stimulation with varying concentrations of anti-CD3 mAb and/or anti-CD28 mAb (as indicated in figure). The number of IFNγ spot-forming units (SFU) are shown. The number of IFNγ SFU decreased in a dose-dependent manner when the concentration of anti-CD3 mAb decreased (A), but not when the anti-CD28 mAb concentration decreased (B). Lines in each graph connect samples from the same donor stimulated under the different conditions and columns represent the mean for each stimulation condition. Representative well images showing SFU are presented next to each stimulation condition.
Figure 3.
Figure 3.. Blood storage can decrease immune cell activity in ELISpot.
Blood samples from 6 healthy donors (A) or 6 sepsis patients (B) were used immediately (‘fresh’) in the ELISpot assay or stored at 4°C or room temperature for 24 h before stimulation. Samples were diluted 1:10 with kit media before adding 50 μL to the wells of an ELISpot plate. The diluted whole blood was unstimulated or stimulated with either anti-CD3/CD28 mAb (0.5 μg/mL and 5 μg/mL) or LPS (2.5 ng/mL) for 22 hours to determine the number of IFNγ and TNFα spot forming units (SFU), respectively. In each graph, samples from the same patient are connected by the line and columns represent the mean for each stimulation condition. * p ≤ 0.05, ** p ≤ 0.01 using Friedman tests. Representative well images showing SFU are presented below each stimulation condition.
Figure 4.
Figure 4.. Reducing the ELISpot stimulation time to 4 hours maintains the ability to measure IFNγ and TNFα spot forming units.
Blood samples from 5 septic patients were diluted 1:10 with kit media before stimulation with either anti-CD3/CD28 mAb (0.5 μg/mL and 5 μg/mL) or LPS (2.5 ng/mL) for either 4 or 22 hours to determine the number of (A) IFNγ and (B) TNFα spot forming units (SFU). In each graph, samples from the same patient are connected by the line and columns represent the mean for each stimulation condition. * p ≤ 0.05 using nonparametric Wilcoxin matched-pairs signed rank test. Representative well images showing SFU are presented below each condition.
Figure 5.
Figure 5.. Position of light source during plate reading impacts number of SFU counted.
Blood samples from 4 healthy donors were diluted 1:10 with kit media before stimulation with either anti-CD3/CD28 mAb (0.5 μg/mL and 5 μg/mL) or LPS (2.5 ng/mL) for 22 hours to determine the number of (A) IFNγ and (B) TNFα spot forming units (SFU). Plates were read on an ImmunoSpot S6 Entry analyzer using either top or bottom illumination. In each graph, samples from the same patient are connected by the line and columns represent the mean for each stimulation condition. * p ≤ 0.05 using nonparametric Wilcoxin matched-pairs signed rank test. Representative well images showing SFU are presented below each condition.
Figure 6.
Figure 6.. Optimization of ELISpot assay conditions leads to little variance in results from same healthy donors over time.
Whole blood from a healthy donor was diluted 1:10 with kit media before stimulation with either anti-CD3/CD28 mAb (0.5 μg/mL and 5 μg/mL) or LPS (2.5 ng/mL) for 22 hours to determine the number of (A) IFNγ and (B) TNFα spot forming units (SFU), respectively. The same plate was read by 7 different laboratories, each using an ImmunoSpot® S6 Entry analyzer configured with identical settings. (C-D). Three blood samples from taken from 9 different healthy donors at 2-week intervals. Blood was diluted 1:10 with kit media before stimulation with either anti-CD3/CD28 mAb (0.5 μg/mL and 5 μg/mL) or LPS (2.5 ng/mL) for 22 hours to determine the number of (C) IFNγ and (D) TNFα spot forming units (SFU), respectively. In each graph, samples from the same patient are connected by the line.

References

    1. Rhee C, Dantes R, Epstein L, et al. Incidence and Trends of Sepsis in US Hospitals Using Clinical vs Claims Data, 2009–2014. JAMA. 2017;318(13):1241–1249. - PMC - PubMed
    1. Rudd KE, Johnson SC, Agesa KM, et al. Global, regional, and national sepsis incidence and mortality, 1990–2017: analysis for the Global Burden of Disease Study. Lancet. 2020;395(10219):200–211. - PMC - PubMed
    1. Vincent JL, Marshall JC, Namendys-Silva SA, et al. Assessment of the worldwide burden of critical illness: the intensive care over nations (ICON) audit. Lancet Respir Med. 2014;2(5):380–386. - PubMed
    1. Esper AM, Moss M, Lewis CA, Nisbet R, Mannino DM, Martin GS. The role of infection and comorbidity: Factors that influence disparities in sepsis. Crit Care Med. 2006;34(10):2576–2582. - PMC - PubMed
    1. Rincon JC, Efron PA, Moldawer LL. Immunopathology of chronic critical illness in sepsis survivors: Role of abnormal myelopoiesis. J Leukoc Biol. 2022;112(6):1525–1534. - PMC - PubMed

Publication types

Substances

LinkOut - more resources