. 2024 Aug 27;11(8):ENEURO.0053-24.2024.
doi: 10.1523/ENEURO.0053-24.2024. Print 2024 Aug.

Chronic Stress Alters Synaptic Inhibition/Excitation Balance of Pyramidal Neurons But Not PV Interneurons in the Infralimbic and Prelimbic Cortices of C57BL/6J Mice

Affiliations

Chronic Stress Alters Synaptic Inhibition/Excitation Balance of Pyramidal Neurons But Not PV Interneurons in the Infralimbic and Prelimbic Cortices of C57BL/6J Mice

Diana Rodrigues et al. eNeuro. .

Abstract

The medial prefrontal cortex (mPFC) plays a pivotal role in regulating working memory, executive function, and self-regulatory behaviors. Dysfunction in the mPFC circuits is a characteristic feature of several neuropsychiatric disorders including schizophrenia, depression, and post-traumatic stress disorder. Chronic stress (CS) is widely recognized as a major triggering factor for the onset of these disorders. Although evidence suggests synaptic dysfunction in mPFC circuits following CS exposure, it remains unclear how different neuronal populations in the infralimbic (IL) and prelimbic (PL) cortices are affected in terms of synaptic inhibition/excitation balance (I/E ratio). Here, using neuroproteomic analysis and whole-cell patch-clamp recordings in pyramidal neurons (PNs) and parvalbumin (PV) interneurons within the PL and IL cortices, we examined the synaptic changes after 21 d of chronic unpredictable stress, in male mice. Our results reveal distinct impacts of CS on PL and IL PNs, resulting in an increased I/E ratio in both subregions but through different mechanisms: CS increases inhibitory synaptic drive in the PL while decreasing excitatory synaptic drive in the IL. Notably, the I/E ratio and excitatory and inhibitory synaptic drive of PV interneurons remained unaffected in both PL and IL circuits following CS exposure. These findings offer novel mechanistic insights into the influence of CS on mPFC circuits and support the hypothesis of stress-induced mPFC hypofunction.

Keywords: I/E ratio; chronic stress; electrophysiology; mPFC; neuroproteomics.


Conflict of interest statement

The authors declare no competing financial interests.

Figures

Figure 1.
Figure 1.
CS induces physiological alterations consistent with HPA axis activation. a, Summary bar graphs [control (Ctrl) N = 26 and stressed (CS) N = 25 mice; *p = 0.0108] reveal a reduction in the body weight gain in CS mice. b, Summary bar graphs (Ctrl N = 26 and CS N = 25 mice; ***p = 0.0003) of the postmortem adrenal gland weight over total body weight revealed that CS induces adrenal hypertrophy. c, Summary bar graphs (Ctrl N = 26 and CS N = 25 mice; *p = 0.0462) of postmortem thymus weight over total body weight revealed that CS induces thymus atrophy. All bar graphs are mean ± SEM. Two-sided Welch's unpaired t test (a–c).
Figure 2.
Figure 2.
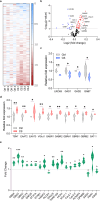
Proteomic analysis points to an I/E dysregulation caused by CS. a, Heatmap view of 170 proteins (y-axis) from the “neuronal system�? family according to the Reactome database. Protein fold enrichment is color coded relative to the Ctrl average (blue, decreased expression; red, increased expression). X-axis represents biological replicates (Ctrl, 1–4; CS, 1–4). b, Volcano plot visualization of proteins according to their significance (p-value) and fold change between Ctrl and CS mice, highlighting several significantly deregulated proteins of interest. Proteins significantly upregulated are represented in red, while downregulated are represented in blue. Proteins related to GABAergic and glutamatergic synapses are labeled. c, Violin plot of GABAergic and glutamatergic synaptic proteins that are significantly downregulated. d, Violin plot of GABAergic and glutamatergic synaptic proteins that are significantly upregulated. e, Violin plot of proteins identified as belonging to the neuronal system pathway whose expression is significantly altered in CS mice. Each biological sample replicate is a combination of three brains pooled together (Ctrl n = 4 and CS n = 4 samples; N = 12 Ctrl and N = 12 CS mice). Two-sided Welch's unpaired t test (c–e) *p < 0.05, **p < 0.01, ***p < 0.001.
Figure 3.
Figure 3.
CS increases the I/E ratio in PL PNs by increasing inhibitory synaptic drive. a–c, Protocol illustration of patch-clamp recordings obtained from L5/6 PNs in the PL subregion, in Ctrl (gray) and CS (blue) mice, with representative sEPSC and sIPSC traces. d, Cumulative probability curves (50 events per cell; **p = 0.0091) and summary bar graphs (inset; Ctrl n = 13 and CS n = 13 cells from 3 Ctrl and 3 CS mice) show a left-shifted curve of sEPSC interevent interval in PNs of stressed mice, without affecting the average frequency of sEPSC. e, Cumulative probability curves (50 events per cell; ***p = 0.0005) and summary bar graphs (inset; Ctrl n = 13 and CS n = 13 cells from 3 Ctrl and 3 CS mice) of sEPSC amplitude in PNs. f, g, Summary bar graphs (Ctrl n = 13 and CS n = 13 cells from 3 Ctrl and 3 CS mice) show significantly faster sEPSC decay kinetics (*p = 0.0126) in PNs of stressed mice, without changes in 10–90% RT. h, Cumulative probability curves (50 events per cell; ****p < 0.0001) and summary bar graphs (inset; Ctrl n = 13 and CS n = 13 cells from 3 Ctrl and 3 CS mice; ***p = 0.0005) show an increase of sIPSC frequency in PNs of stressed mice. i, Cumulative probability curves (50 events per cell; **p = 0.0063) and summary bar graphs (inset; Ctrl n = 13 and CS n = 13 cells from 3 Ctrl and 3 CS mice) of sIPSC amplitude in PNs. j, k, Summary bar graphs (Ctrl n = 13 and CS n = 13 cells from 3 Ctrl and 3 CS mice) show significantly faster sIPSC decay kinetics (****p < 0.0001) in PNs of stressed mice, without changes in 10–90% RT. l, sIPSC/sEPSC (I/E) frequency ratio (Ctrl n = 13 and CS n = 13 cells from 3 Ctrl and 3 CS mice; *p = 0.0490) reveals an increase in I/E ratio in PNs of stressed mice. m, Excitatory synaptic drive (Ctrl n = 13 and CS n = 13 cells from 3 Ctrl and 3 CS mice) reveals no differences between Ctrl and CS mice. n, Inhibitory synaptic drive (Ctrl n = 13 and CS n = 13 cells from 3 Ctrl and 3 CS mice) reveals a remarkable increase after CS exposure. All bar graphs are mean ± SEM. For each box and whisker plot, the interior line shows the median, and the edges of the box are estimates of the first and third quartiles. The whiskers extend to the most extreme data points. Two-sided Welch's unpaired t test (d–n) and Kolmogorov–Smirnov test (d, e, h–i curves).
Figure 4.
Figure 4.
CS increases the I/E ratio in IL PNs by decreasing the excitatory synaptic drive. a–c, Protocol illustration of patch-clamp recordings obtained from L5/6 PNs in the IL subregion, in Ctrl (gray) and CS (blue) mice and respective sEPSC and sIPSC representative traces. d, Cumulative probability curves (50 events per cell; ****p < 0.0001) and summary bar graphs (inset; Ctrl n = 15 and CS n = 12 cells from 3 Ctrl and 3 CS mice; *p = 0.0170) show a significant decrease of sEPSC frequency in PNs of stressed mice. e, Cumulative probability curves (50 events per cell; ****p < 0.0001) and summary bar graphs (inset; Ctrl n = 15 and CS n = 12 cells from 3 Ctrl and 3 CS mice; ***p = 0.0006) show a reduction of sEPSC amplitude in PNs of stressed mice. f, g, Summary bar graphs (Ctrl n = 15 and CS n = 12 cells from 3 Ctrl and 3 CS mice) show similar sEPSC decay kinetics and 10–90% RT in Ctrl and CS littermates. h, Cumulative probability curves (50 events per cell) and summary bar graphs (inset; Ctrl n = 15 and CS n = 12 cells from 3 Ctrl and 3 CS mice) show no differences in sIPSC frequency in PNs of stressed mice. i, Cumulative probability curves (50 events per cell; ****p < 0.0001) and summary bar graphs (inset; Ctrl n = 15 and CS n = 12 cells from 3 Ctrl and 3 CS mice; ***p = 0.0004) show reduced sIPSC amplitude in PNs of stressed mice. j, k, Summary bar graphs (Ctrl n = 15 and CS n = 12 cells from 3 Ctrl and 3 CS mice) show similar sIPSCs decay kinetics and 10–90% RT between PN from Ctrl and CS littermates. l, sIPSC/sEPSC (I/E) frequency ratio (**p = 0.0071; Ctrl n = 15 and CS n = 12 cells from 3 Ctrl and 3 CS mice; **p = 0.0040) reveals an increase of I/E ratio in PNs of stressed mice. m, Excitatory synaptic drive (Ctrl n = 15 and CS n = 12 cells from 3 Ctrl and 3 CS mice) shows a reduction in stressed mice. n, Inhibitory synaptic drive (Ctrl n = 15 and CS n = 12 cells from 3 Ctrl and 3 CS mice) reveals no differences between Ctrl and CS mice. All bar graphs are mean ± SEM. For each box and whisker plot, the interior line shows the median, and the edges of the box are estimates of the first and third quartiles. The whiskers extend to the most extreme data points. Two-sided Welch's unpaired t test (d–n) and Kolmogorov–Smirnov test (d, e, h–i curves).
Figure 5.
Figure 5.
CS did not affect the I/E ratio of PV interneurons in the PL cortex. a–c, Protocol illustration of patch-clamp recordings obtained from L5/6 fluorescently labeled PV interneurons in the PL subregion, in Ctrl (gray) and CS (purple) mice and respective sEPSC and sIPSC representative traces. d, Cumulative probability curves (50 events per cell) and summary bar graphs (inset; Ctrl n = 12 and CS n = 14 cells from 3 Ctrl and 3 CS mice) show no alterations of sEPSC frequency in PV interneurons. e, Cumulative probability curves (50 events per cell) and summary bar graphs (inset; Ctrl n = 12 and CS n = 14 cells from 3 Ctrl and 3 CS mice) show similar sEPSC amplitude in PV interneurons of Ctrl and CS mice. f, g, Summary bar graphs (Ctrl n = 12 and CS n = 14 cells from 3 Ctrl and 3 CS mice) show a slower sEPSC decay kinetics (*p = 0.0242) in PV interneurons of stressed mice, without alterations in the 10–90% RT. h, Cumulative probability curves (25 events per cell) and summary bar graphs (inset; Ctrl n = 12 and CS n = 14 cells from 3 Ctrl and 3 CS mice) show no differences in sIPSC frequency in PV interneurons. i, Cumulative probability curves (25 events per cell; *p = 0.0171) and summary bar graphs (inset; Ctrl n = 12 and CS n = 14 cells from 3 Ctrl and 3 CS mice) show a right-shifted curve of sIPSC amplitude in PV interneurons of CS mice, without affecting average sIPSC amplitude. j, k, Summary bar graphs (Ctrl n = 12 and CS n = 14 cells from 3 Ctrl and 3 CS mice) show similar sIPSC decay kinetics and 10–90% RT between PV interneurons from Ctrl and CS littermates. l, sIPSC/sEPSC (I/E) frequency ratio (Ctrl n = 12 and CS n = 14 cells from 3 Ctrl and 3 CS mice) reveals no alterations in stressed mice. m, Excitatory synaptic drive (Ctrl n = 12 and CS n = 14 cells from 3 Ctrl and 3 CS mice) reveals no differences between Ctrl and CS mice. n, Inhibitory synaptic drive (Ctrl n = 12 and CS n = 14 cells from 3 Ctrl and 3 CS mice) reveals no differences between Ctrl and CS mice. All bar graphs are mean ± SEM. For each box and whisker plot, the interior line shows the median, and the edges of the box are estimates of the first and third quartiles. The whiskers extend to the most extreme data points. Two-sided Welch's unpaired t test (d–n) and Kolmogorov–Smirnov test (d, e, h–i curves).
Figure 6.
Figure 6.
CS did not affect the I/E ratio of PV interneurons in the IL cortex. a–c, Protocol illustration of patch-clamp recordings obtained from L5/6 fluorescently labeled PV interneurons in the IL subregion, in Ctrl (gray) and CS (purple) mice and respective sEPSC and sIPSC representative traces. d, Cumulative probability curves (50 events per cell) and summary bar graphs (inset; Ctrl n = 14 and CS n = 15 cells from 3 Ctrl and 3 CS mice) show no alterations of sEPSC frequency in PV interneurons. e, Cumulative probability curves (50 events per cell) and summary bar graphs (inset; Ctrl n = 14 and CS n = 15 cells from 3 Ctrl and 3 CS mice) show similar sEPSC amplitude in PV interneurons of CS mice. f, g, Summary bar graphs (Ctrl n = 14 and CS n = 15 cells from 3 Ctrl and 3 CS mice) show similar decay kinetics and 10–90% RT between PV interneurons from Ctrl and CS littermates. h, Cumulative probability curves (25 events per cell) and summary bar graphs (inset; Ctrl n = 14 and CS n = 15 cells from 3 Ctrl and 3 CS mice) show no differences in sIPSC frequency in PV interneurons. i, Cumulative probability curves (25 events per cell; **p = 0.0023) and summary bar graphs (inset; Ctrl n = 14 and CS n = 15 cells from 3 Ctrl and 3 CS mice) show a left-shifted curve of sIPSC amplitude in PV interneurons of CS mice, without affecting average sIPSC amplitude. j, k, Summary bar graphs (Ctrl n = 14 and CS n = 15 cells from 3 Ctrl and 3 CS mice) show similar sIPSC decay kinetics and 10–90% RT between PV interneurons from Ctrl and CS littermates. L, sIPSC/sEPSC (I/E) frequency ratio (Ctrl n = 14 and CS n = 15 cells from 3 Ctrl and 3 CS mice) reveals no alterations in CS mice. m, Excitatory synaptic drive (Ctrl n = 14 and CS n = 15 cells from 3 Ctrl and 3 CS mice) reveals no differences between Ctrl and CS mice. n, Inhibitory synaptic drive (Ctrl n = 12 and CS n = 14 cells from 3 Ctrl and 3 CS mice) reveals no differences between Ctrl and CS mice. All bar graphs are mean ± SEM. For each box and whisker plot, the interior line shows the median, and the edges of the box are estimates of the first and third quartiles. The whiskers extend to the most extreme data points. Two-sided Welch's unpaired t test (d–n) and Kolmogorov–Smirnov test (d, e, h–i curves).

Similar articles

Cited by

References

    1. Amat J, Baratta MV, Paul E, Bland ST, Watkins LR, Maier SF (2005) Medial prefrontal cortex determines how stressor controllability affects behavior and dorsal raphe nucleus. Nat Neurosci 8:365–371. 10.1038/nn1399 - DOI - PubMed
    1. Amaya KA, Smith KS (2018) Neurobiology of habit formation. Curr Opin Behav Sci 20:145–152. 10.1016/j.cobeha.2018.01.003 - DOI
    1. Arnsten AFT (2009) Stress signalling pathways that impair prefrontal cortex structure and function. Nat Rev Neurosci 10:410–422. 10.1038/nrn2648 - DOI - PMC - PubMed
    1. Atrooz F, Alkadhi KA, Salim S (2021) Understanding stress: insights from rodent models. Curr Res Neurobiol 2:100013. 10.1016/j.crneur.2021.100013 - DOI - PMC - PubMed
    1. Bale TL (2006) Stress sensitivity and the development of affective disorders. Horm Behav 50:529–533. 10.1016/j.yhbeh.2006.06.033 - DOI - PubMed