. 2024 Aug 15;15(1):7048.
doi: 10.1038/s41467-024-51244-6.

Transporter-mediated depletion of extracellular proline directly contributes to plant pattern-triggered immunity against a bacterial pathogen

Affiliations

Transporter-mediated depletion of extracellular proline directly contributes to plant pattern-triggered immunity against a bacterial pathogen

Conner J Rogan et al. Nat Commun. .

Abstract

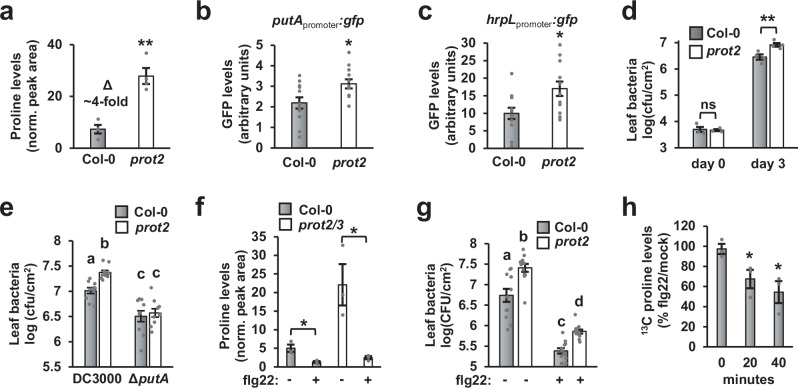
Plants possess cell surface-localized immune receptors that detect microbe-associated molecular patterns (MAMPs) and initiate defenses that provide effective resistance against microbial pathogens. Many MAMP-induced signaling pathways and cellular responses are known, yet how pattern-triggered immunity (PTI) limits pathogen growth in plants is poorly understood. Through a combined metabolomics and genetics approach, we discovered that plant-exuded proline is a virulence-inducing signal and nutrient for the bacterial pathogen Pseudomonas syringae, and that MAMP-induced depletion of proline from the extracellular spaces of Arabidopsis leaves directly contributes to PTI against P. syringae. We further show that MAMP-induced depletion of extracellular proline requires the amino acid transporter Lysine Histidine Transporter 1 (LHT1). This study demonstrates that depletion of a single extracellular metabolite is an effective component of plant induced immunity. Given the important role for amino acids as nutrients for microbial growth, their depletion at sites of infection may be a broadly effective means for defense against many pathogens.


Conflict of interest statement

The authors declare no competing interests.

Figures

Fig. 1
Fig. 1. Activation of pattern-triggered immunity in Arabidopsis leaves prevents P. syringae from expressing type III secretion system-encoding genes.
a Leaves of four-week-old Arabidopsis wild-type Col-0, fls2 and efr plants were syringe-infiltrated with 100 nM flg22, 100 nM elf26, or a mock treatment. After five hours, the treated leaves were infiltrated with 5  × 108 cfu/mL of wild-type P. syringae DC3000. The upper panel is an anti-AvrPto immunoblot of total protein extracts from infected leaf tissue, middle panel is Coomassie Blue (CBB) staining of the immunoblot to assess equal loading, and lower panel is a graph of bacteria levels in the infected tissue samples. Graphed in the lower panel are means ± SE of log-transformed counts of colony forming units (cfu). b Leaves of four-week-old Arabidopsis wild-type Col-0 and sid2/pad4/ein2/dde2 (QKO) plants were syringe-infiltrated with 100 nM flg22 or a mock treatment. After five hours, the treated leaves were infiltrated with 5 × 108  cfu/mL of wild-type P. syringae DC3000. The upper panel is an anti-AvrPto immunoblot of total protein extracts from infected leaf tissue, middle panel is Coomassie Blue (CBB) staining of the immunoblot to assess equal loading, and lower panel is a graph of bacteria levels in the infected tissue samples. Graphed in the lower panel are means ± SE of log-transformed counts of colony forming units (cfu). c Leaves of four-week-old Arabidopsis wild-type Col-0 and QKO plants were syringe-infiltrated with 100 nM flg22 or a mock treatment. After five hours, the treated leaves were infiltrated with 5 × 108 cfu/mL of P. syringae DC3000 carrying hrpLpromoter:gfp, or a DC3000 empty vector control strain. GFP fluorescence from leaf tissue six hours post-infiltration with DC3000 hrpLpromoter:gfp. Graphed are means ± SE of GFP fluorescence normalized to fluorescence from tissue infiltrated with a DC3000 empty vector control strain, n = 12. Lower case letters in all panels denote significance groupings based on ANOVA with Tukey’s HSD, p < 0.05. The abbreviation ns is not significant. Data in all panels are representative of three independent experiments.
Fig. 2
Fig. 2. Apoplastic wash fluid isolated from flg22-treated Arabidopsis leaves inhibits P. syringae type III secretion and growth.
Leaves of four-week-old Arabidopsis were syringe-infiltrated with 100 nM flg22 or a mock solution. After eight hours, apoplastic wash fluid (AWF) was isolated from the same leaves. a Diagram of AWF extraction procedure. b Measurements of malate dehydrogenase (MDH) activity in AWF and total leaf extracts from wild-type Col-0 leaves. Graphed are means ± SE of MDH enzyme units, n = 8. Data are from eight independent experiments. c The pH of AWF from mock- and flg22-treated wild-type Col-0 and sid2/pad4/ein2/dde2 (QKO) mutant leaves immediately after extraction. Graphed are means of AWF pH ± SE, n = 5. Data are from five independent experiments. Lower case letters denote significance groupings based upon ANOVA with Tukey’s HSD, p < 0.01. d P. syringae DC3000 carrying a hrpLpromoter:gfp or empty vector control plasmid were cultured for 10 h in AWF from Col-0 leaves treated with either flg22 or a mock treatment. Graphed are means ± SE of normalized GFP fluorescence, n = 4. e AvrPto abundance in DC3000 incubated for six hours in AWF from mock- or flg22-treated Col-0 leaves. Upper panel is chemiluminescent signal from anti-AvrPto immunoblot of total protein extracts and lower panel is Coomassie Brilliant Blue (CBB) staining to assess equal loading. f P. syringae DC3000 carrying a hrpLpromotor:gfp or empty vector control plasmid were incubated for 10 h in AWF from wild type Col-0 and QKO leaves treated with either flg22 or a mock treatment. Graphed are means ± SE of normalized GFP fluorescence, n = 3. g Growth of P. syringae DC3000 hrpLpromoter:gfp in AWF from Col-0 and QKO leaves treated with either flg22 or a mock treatment. Graphed are means of culture optical density at λ = 600 nm (OD600) measurements ± SE, n = 3. Data in panels dg are representative of results from three independent experiments. Asterisks in panels b, d and f denote statistical significance based on two-sided t-test. *p < 0.05, **p < 0.01, ***p < 0.001, ns is p > 0.05.
Fig. 3
Fig. 3. Metabolomics analyses of apoplastic wash fluid isolated from flg22-treated Arabidopsis leaves.
Leaves of four-week-old Arabidopsis plants were syringe-infiltrated with 100 nM flg22 or a mock solution. After 8 h, apoplastic wash fluid (AWF) was isolated from the treated leaves and analyzed by GC-MS. a Volcano plot of average fold change values and associated p values for compounds detected in AWF extracted from Col-0 leaves treated with flg22 or a mock treatment, n = 8. Data were pooled from eight independent experiments. The horizontal line denotes p = 0.05 based on two-sided t-test. Compounds that significantly increased or decreased in AWF from flg22-treated leaves are represented in red and blue, respectively. Abbreviation 3-aba is 3-aminoisobutyric acid. b-d Relative abundances of (b) amino acids, (c) organic acids or (d) sugars detected in AWF from mock- and flg22-treated Col-0 leaves. Abundance values were normalized to a value of 1 in mock samples. Graphed are means ± SE of metabolite abundance, n = 8. Abbreviations are dha, dehydroxyascorbic acid; akga, alpha ketoglutaric acid; 3-aba, 3-aminoisobutyric acid; β-ala, β-alanine. Standard three letter abbreviations are used for proteinaceous amino acids. Data are the same as in panel a. e Volcano plot of average fold change and associated p values for compounds detected in AWF extracted from sid2/pad4/ein2/dde2 (QKO) leaves treated with flg22 or a mock treatment, n = 4. Plot labels are the same as for panel a. Data were pooled from four independent experiments. The horizontal line denotes p = 0.05 based on two-sided t-test. f Average relative abundances of metabolites in mock and flg22-treated QKO AWF that were significantly altered in abundance between mock- and flg22-treated Col-0 AWF. Graphed are means ± SE of metabolite abundance, n = 4. Data are the same as in panel e. ND is not detected. Asterisks in panels bf denote statistical significance based on two-sided t-tests. *p < 0.05, ***p < 0.001.
Fig. 4
Fig. 4. Decreased proline levels contribute to decreased T3SS- and growth-inducing activity of apoplastic wash fluid from flg22-treated Arabidopsis leaves.
a Absolute quantification of proline levels in apoplastic wash fluid (AWF) from mock-and flg22-treated leaves. Graphed are means ± SE of proline abundance, n = 8. Data were pooled from eight independent experiments. b, c P. syringae DC3000 hrpLpromoter:gfp were cultured in (b) minimal medium containing 10 mM fructose and supplemented with or without 100 µM proline, or (c) in mock- and flg22-AWF supplemented with or without 100 µM proline. Graphed are means ± SE of normalized GFP fluorescence, n = 3. d Growth of P. syringae DC3000 hrpLpromoter:gfp in mock- and flg22-AWF isolated from Col-0 leaves and supplemented with or without 100 µM proline. Graphed are means of culture optical density at λ = 600 nm ± SE, n = 3. Data in bd are representative of three independent experiments. Asterisks in panels a and b denote significance based on two-sided t-test, ***p < 0.001. Lower case letters in c and d denote significance groupings based on ANOVA with Tukey’s HSD, p < 0.05.
Fig. 5
Fig. 5. Flg22 stimulates removal of proline from the Arabidopsis leaf apoplast.
a Arabidopsis Col-0 leaves were infiltrated with 500 µM 13C-proline and 164 µM ribitol. Apoplastic wash fluid (AWF) was isolated from treated leaves at time points indicated, and the abundance of 13C-proline and ribitol in AWF measured by GC-MS. Graphed are means ± SE of 13C-proline or ribitol peak area normalized to levels of myristic acid added as an external standard, n = 3. b, c Col-0 (b) and sid2/pad4/ein2/pad4 (QKO) (c) plants were treated with 100 nM flg22 or a mock treatment for six hours. The plants were then infiltrated with 500 µM 13C-proline and 164 µM ribitol. AWF was recovered from treated leaves at time points indicated. Graphed are means ± SE of 13C-proline peak area normalized to ribitol peak area, n = 3. Asterisks in all panels denote significance based on two-sided t-test vs t = 0 measurements, *p < 0.05, ***p < 0.001, ns is p > 0.05. Data in each panel were pooled from three independent experiments.
Fig. 6
Fig. 6. P. syringaeproline utilization A (putA) is required for maximal type III secretion system deployment and bacterial growth during infection of Arabidopsis.
a Reactions catalyzed by PutA. Pro=proline, P5C = Δ1-pyrroline-5-carboxylate, GSA = glutamic semialdehyde, Glu=glutamic acid. b Time course of P. syringae DC3000 and DC3000ΔputA growth in M9 medium supplemented with 10 mM proline. Graphed are means ± SE of optical density at λ = 600 nm (OD600) measurements at indicated time points, n = 3. c Growth of P. syringae DC3000 and DC3000ΔputA in M9 medium supplemented with 10 mM of individual amino acids as indicated. Graphed are means ± SE of OD600 measurements at 22 h post-inoculation relative to OD600 at t = 0, n = 3. d GFP fluorescence from P. syringae DC3000 hrpLpromoter:gfp and DC3000ΔputA hrpLpromoter:gfp reporter strains incubated for 4.5 h in minimal medium supplemented with 10 mM fructose and 200 μM of individual metabolites as indicated. CA = citric acid, 4hba = 4-hydroxybenzoic acid, fruc = fructose. Graphed are means ± SE of normalized GFP fluorescence, n = 3. e AvrPto protein abundance in leaf tissue five hours after infiltration of leaves with either P. syringae DC3000 or DC3000ΔputA. Upper panel is immunoblot detection of AvrPto levels in protein extracts from infected leaves, lower panel is Coomassie Brilliant Blue (CBB) staining of the immunoblot to assess equal loading. Data shown are representative of three independent experiments. f Leaf bacteria levels three days after infiltration of Arabidopsis leaves with 1 × 106 cfu/mL of P. syringae DC3000 or DC3000ΔputA. Graphed are log transformed means ± SE of colony-forming units (cfu) of bacteria isolated from infected tissue, n = 14. Data were pooled from three independent experiments, n = 4-5 per experiment. Results in panels bd are representative of two independent experiments. Asterisks in panels c, d and f denote statistical significance based on two-sided t-test, *p < 0.05. **p < 0.01, ***p < 0.001.
Fig. 7
Fig. 7. Arabidopsis prot2 leaves have elevated levels of apoplastic proline and are more susceptible to P. syringae infection.
a GC-MS analysis of proline in apoplastic wash fluid (AWF) from Col-0 and prot2-3 leaves. Graphed are means ± SE of normalized peak area for proline, n = 4 from four independent experiments. Col-0 and prot2-3 leaves were infiltrated with P. syringae DC3000 harboring either (b) putApromoter:gfp or (c) hrpLpromoter:gfp, or an empty:gfp plasmid. Graphed are means ± SE of normalized GFP fluorescence of leaf tissue six hours post-infection, n = 12. d 2 x 106 cfu/mL of P. syringae DC3000 was infiltrated into Col-0 and prot2-3 leaves. Leaf bacteria were enumerated 3 days post-infection by serial dilution plating of leaf extracts. Graphed are log transformed means ± SE of colony-forming units (cfu), n = 3 for day 0 samples, n = 4 for day 3 samples. e 2 x 106 cfu/mL of P. syringae DC3000 or DC3000ΔputA was infiltrated into Col-0 and prot2-3 leaves. Leaf bacteria were enumerated 3 days post-infection by serial dilution plating of leaf extracts. Graphed are log transformed means ± SE of colony-forming units (cfu), n = 12. f Proline levels in AWF from Col-0 and prot2-3/prot3-2 leaves treated for six hours with 100 nM flg22 or a mock treatment. Graphed are means ± SE of normalized peak area for proline, n = 4. g P. syringae DC3000 growth in Col-0 or prot2-3 plants pre-treated for six hours with 100 nM flg22 or a mock treatment. Graphed are log-transformed means ± SE of cfu isolated from infected tissue 3 days post-infection, n = 10. h 13C-proline uptake in prot2-3 leaves treated for six hours with 100 nM flg22 or a mock treatment. Graphed are means ± SE of normalized peak area for proline, n = 3. Asterisks in panels ad, f and h denote statistical significance based on two-sided t-test, *p < 0.05. **p < 0.01. Lower case letters in panels e and g denote significance groupings based upon ANOVA with Tukey’s HSD, p < 0.05. Data in panels bd are representative of three independent experiments. Data in panels eh were pooled from three independent experiments.
Fig. 8
Fig. 8. Arabidopsis LHT1 is required for flg22-induced depletion of apoplastic proline and maximal pattern-triggered immunity to P. syringae.
ac Col-0 and lht1-7 leaves were syringe-infiltrated with 100 nM flg22 or a mock treatment. a Proline levels in apoplastic wash fluid (AWF) isolated from leaves eight hours post-treatment. Graphed are means ± SE of normalized peak areas for proline, n = 3. b 13C-proline was infiltrated into treated leaves eight hours post-treatment, then AWF isolated from the treated leaves at timepoints indicated. Graphed are means ± SE of normalized peak area for 13C-proline in AWF, n = 3. c P. syringae DC3000 carrying a hrpLpromotor:gfp or empty gfp plasmid were incubated for 10 h in AWF isolated from leaves eight hours post-treatment. Graphed are means ± SE of normalized GFP fluorescence, n = 3. d 1 × 106 cfu/mL of P. syringae DC3000 or DC3000ΔputA was syringe-infiltrated into Col-0 and lht1-7 leaves pre-treated for six hours with 100 nM flg22 or a mock treatment. Leaf bacteria were enumerated on day 3 by serial dilution and plating of leaf extracts. Graphed are log-transformed means ± SE of colony-forming units (cfu) of bacteria isolated from infected tissue, n = 12 and 20 for DC3000 ΔputA -and DC3000-infected samples, respectively. e Proline levels in apoplastic wash fluid (AWF) isolated from Col-0 and lht1-7 plants eight hours after syringe-infiltration with 100 nM flg22 or a mock treatment. Graphed are means ± SE of normalized peak areas for proline, n = 5. f 1 × 106 cfu/mL of P. syringae DC3000 was syringe-infiltrated into sid2-1 and sid2-1/lht1-7 leaves pre-treated for six hours with 100 nM flg22 or a mock treatment. Leaf bacteria were enumerated on day 3 by serial dilution and plating of leaf extracts. Graphed are log-transformed means ± SE of colony-forming units (cfu) of bacteria isolated from infected tissue, n = 18. Lower case letters in all panels denote significance groupings based upon ANOVA with Tukey’s HSD, p < 0.05. Box plots in d and f show median, interquartile range, min, max, black boxes are the mean values. Data in all panels were pooled from three independent experiments.

References

    1. Janeway, C. A. Approaching the asymptote? Evolution and revolution in Immunology. Cold Spring Harb. Symp. Quant. Biol.54, 1–13 (1989). 10.1101/SQB.1989.054.01.003 - DOI - PubMed
    1. Zipfel, C. Plant pattern-recognition receptors. Trends Immunol.35, 345–351 (2014). 10.1016/j.it.2014.05.004 - DOI - PubMed
    1. Akira, S., Uematsu, S. & Takeuchi, O. Pathogen recognition and innate immunity. Cell124, 783–801 (2006). 10.1016/j.cell.2006.02.015 - DOI - PubMed
    1. Jones, J. D. G. & Dangl, J. L. The plant immune system. Nature444, 323–329 (2006). 10.1038/nature05286 - DOI - PubMed
    1. DeFalco, T. A. & Zipfel, C. Molecular mechanisms of early plant pattern-triggered immune signaling. Mol. Cell81, 3449–3467 (2021). 10.1016/j.molcel.2021.07.029 - DOI - PubMed

MeSH terms

Substances