. 2024 Aug 15;15(1):7028.
doi: 10.1038/s41467-024-51163-6.

C5aR1 antagonism suppresses inflammatory glial responses and alters cellular signaling in an Alzheimer's disease mouse model

Affiliations

C5aR1 antagonism suppresses inflammatory glial responses and alters cellular signaling in an Alzheimer's disease mouse model

Nicole D Schartz et al. Nat Commun. .

Abstract

Alzheimer's disease (AD) is the leading cause of dementia in older adults, and the need for effective, sustainable therapeutic targets is imperative. The complement pathway has been proposed as a therapeutic target. C5aR1 inhibition reduces plaque load, gliosis, and memory deficits in animal models, however, the cellular bases underlying this neuroprotection were unclear. Here, we show that the C5aR1 antagonist PMX205 improves outcomes in the Arctic48 mouse model of AD. A combination of single cell and single nucleus RNA-seq analysis of hippocampi derived from males and females identified neurotoxic disease-associated microglia clusters in Arctic mice that are C5aR1-dependent, while microglial genes associated with synapse organization and transmission and learning were overrepresented in PMX205-treated mice. PMX205 also reduced neurotoxic astrocyte gene expression, but clusters associated with protective responses to injury were unchanged. C5aR1 inhibition promoted mRNA-predicted signaling pathways between brain cell types associated with cell growth and repair, while suppressing inflammatory pathways. Finally, although hippocampal plaque load was unaffected, PMX205 prevented deficits in short-term memory in female Arctic mice. In conclusion, C5aR1 inhibition prevents cognitive loss, limits detrimental glial polarization while permitting neuroprotective responses, as well as leaving most protective functions of complement intact, making C5aR1 antagonism an attractive therapeutic strategy for AD.


Conflict of interest statement

The authors declare no competing interests.

Figures
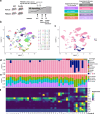
Fig. 1
Fig. 1. Clustering of transcriptome from single nucleus and single cells in wild-type and Arctic mice.
a Diagrammatic representation of treatment paradigm for each of the experiments, including treatment from 4.5 to 7 months (top) and 7.5 to 10 months (bottom). b Seurat cluster identification of combined cells/nuclei transcriptome. c Seurat cluster identification of cells derived from single cells (SC) or single nucleus (SN) sequencing. d Proportion of cells in each cluster originating from SC or SN transcriptome. e Proportion of cells in each cluster by treatment/genotype. f Expression of complement pathway components, receptors or regulators by cell type.
Fig. 2
Fig. 2. Single cell and single nucleus RNA-Seq clustered by cell type reveals cell-specific complement gene expression.
Microglia or nuclei were isolated from hippocampi, fixed, and sequenced. a U-Map of all cell types with all treatment groups included (counts per cell type were: Neurons 37512, Astrocytes 4612, Oligodendrocytes 3478, Microglia 4891, OPCs 1259, Endothelial 898, Mixed 1017, Pericytes 490). b Proportion of isolated cell types in the single nucleus (SN) RNA-seq by genotype and treatment group. c Differential cell type-specific expression of complement pathway components and regulators of the complement system derived from single nucleus RNA-seq.
Fig. 3
Fig. 3. DAM1 gene expression is suppressed in Arctic-PMX205 hippocampal microglia.
a Cells/nuclei identified as microglia were re-clustered separately. b Proportion of microglia (SC + SN) clusters in WT-Veh, WT-PMX, Arc-Veh, and Arc-PMX samples. c Proportion of cells in each cluster originating from SC or SN transcriptome. d Proportion of cells/nuclei in each cluster by treatment/genotype. e Relative expression of genes representative of homeostatic microglia, DAM1, DAM2, or other genes of interest within the different microglial clusters. f Pie chart demonstrating proportion of SC microglia samples derived from different treatment groups. g Relative expression of homeostatic, DAM1, or DAM2 genes in different treatment groups, with SC data alone.
Fig. 4
Fig. 4. Reactive Astrocyte gene expression is largely suppressed in Arctic-PMX205 hippocampus.
a Cells identified as astrocytes were re-clustered separately. b Proportion of astrocyte populations in WT-Veh, WT-PMX, Arc-Veh, and Arc-PMX samples. c Proportion of cells in each cluster by treatment/genotype. d Relative expression of genes representative of homeostatic astrocytes, pan-reactive, A-1 neurotoxic, or A-2 neuroprotective astrocytes within the different astrocyte clusters. e Relative expression of homeostatic, pan-reactive, A-1, or A-2 genes in the different treatment groups.
Fig. 5
Fig. 5. Relative information flow of pathways significantly enhanced or suppressed in Arctic mice and altered by PMX205 treatment.
a Relative information flow of pathways that are differentially expressed between WT-veh (blue) and Arc-veh (salmon). b Relative information flow of differential pathways in Arc-veh (salmon) and Arc-PMX (teal). c Cellular senders of differential pathways in WT-veh (left), Arc-veh (middle), and Arc-PMX (right).
Fig. 6
Fig. 6. PMX205 does not prevent all glial responses to injury.
Representative images of dorsal hippocampus stained for CD11b (A, left)and CD11c (a right) and Iba1 (b) in Arc-veh (top panel) and Arc-PMX (bottom panel) 10X magnification, scale bar 200 μm. c–e Quantification of percent field area (FA %) of WT-veh, WT-PMX, Arc-veh, and Arc-PMX for CD11b (c), CD11c (d), and Iba1 (e). f Representative images of dorsal hippocampus stained for S100a6 (left), LCN2 (middle), and GFAP (right) in Arc-veh (top panel) and Arc-PMX (bottom panel) 10X magnification, scale bar 200 μm. Quantification of FA% of WT-veh, Arc-veh, and Arc-PMX for S100a6 (g), LCN2 (h), and GFAP (i). Males (circles) and females (triangles) are designated in all graphs. Data shown as mean ± SEM of 3-4 images per mouse. Two-way ANOVA, n = 3-8 mice/genotype/treatment (CD11b, n = 6 WT-veh, n = 6 WT-PMX, n = 7 Arc-veh, n = 8 Arc-PMX. CD11c, n = 6 WT-veh, n = 6 WT-PMX, n = 7 Arc-veh, n = 7 Arc-PMX. Iba1, n = 6 WT-veh, n = 5 WT-PMX, n = 7 Arc-veh, n = 7 Arc-PMX. S1006a n = 3 WT-veh, n = 3 WT-PMX, n = 8 Arc-veh, n = 5 Arc-PMX. LCN2 n = 3 WT-veh, n = 3 WT-PMX, n = 7 Arc-veh, n = 5 Arc-PMX. GFAP n = 3 WT-veh, n = 3 WT-PMX, n = 7 Arc-veh, n = 5 Arc-PMX.).
Fig. 7
Fig. 7. PMX205 protects against spatial memory deficits in Arctic females.
a Overview of Y maze experiment completed at 10 months of age. Time spent in the novel arm during the test trial in females (b) and males (c). Data shown as mean ± SEM. *p < 0.05; **p < 0.01, Two-way ANOVA with Tukey’s post hoc. WT-veh vs Arc-veh, p = 0.0253; Arc-veh vs Arc-PMX, p = 0.0014. N = 12M9F (WT-veh), 11M13F (WT-PMX), 9M7F (Arc-veh) and 9M8F (Arc-PMX).
Fig. 8
Fig. 8. Early treatment with PMX205 suppresses neurofilament light levels in plasma of Arc mice.
a Plasma NfL levels of WT and Arctic mice before (pre) and after (post) PMX205 or water treatment from 7.5 to 10 months. b Plasma NfL levels in WT and Arc pretreatment and at 7 mo after (post) PMX205 treatment for 2, 6, or 12 weeks. Data shown as mean ± SEM. *p < 0.05; **p < 0.01; ***p < 0.001, Repeated measures Two-way ANOVA with Tukey’s post hoc, WT-H2O (post tx) vs Arc- H2O (post tx) p = 0.002; WT-PMX (post tx) vs Arc-PMX (post tx) p = 0.0316. N = 16 (WT- H2O), 16 (WT-PMX), 14 (Arc- H2O) and 10 (Arc-PMX) (a) and Sidak’s post hoc, Arc vs WT, p = 0.0004; Arc vs Arc-PMX 12 wk p = 0.13; Arc vs Arc-PMX 6 wk p = 0.0018; Arc vs Arc-PMX 2 wk p = 0.0486. N = 6 (WT- H2O), 3 (Arc- H2O), 4 (Arc-PMX 12 wk), 6 (Arc-PMX 6 wk), and 6 (Arc-PMX 2 wk) (b). Males and females were included in both studies with no apparent sex differences evident in any genotype/treatment group.

Update of

References

    1. Association As. 2022 Alzheimer’s disease facts and figures. Alzheimers Dement.18, 700–789 (2022). - PubMed
    1. DeTure, M. A. & Dickson, D. W. The neuropathological diagnosis of Alzheimer’s disease. Mol. Neurodegener.14, 32 (2019). 10.1186/s13024-019-0333-5 - DOI - PMC - PubMed
    1. Tenner, A. J. Complement-mediated events in Alzheimer’s disease: mechanisms and potential therapeutic targets. J. Immunol.204, 306–315 (2020). 10.4049/jimmunol.1901068 - DOI - PMC - PubMed
    1. Tijms, B. M. et al. Cerebrospinal fluid proteomics in patients with Alzheimer’s disease reveals five molecular subtypes with distinct genetic risk profiles. Nat. Aging4, 33–47 (2024). 10.1038/s43587-023-00550-7 - DOI - PMC - PubMed
    1. Neff, R. A. et al. Molecular subtyping of Alzheimer’s disease using RNA sequencing data reveals novel mechanisms and targets. Sci. Adv.7, eabb5398 (2021). 10.1126/sciadv.abb5398 - DOI - PMC - PubMed

MeSH terms

Substances