. 2024 Aug 15;15(1):7016.
doi: 10.1038/s41467-024-51274-0.

Fast and deep phosphoproteome analysis with the Orbitrap Astral mass spectrometer

Affiliations

Fast and deep phosphoproteome analysis with the Orbitrap Astral mass spectrometer

Noah M Lancaster et al. Nat Commun. .

Abstract

Owing to its roles in cellular signal transduction, protein phosphorylation plays critical roles in myriad cell processes. That said, detecting and quantifying protein phosphorylation has remained a challenge. We describe the use of a novel mass spectrometer (Orbitrap Astral) coupled with data-independent acquisition (DIA) to achieve rapid and deep analysis of human and mouse phosphoproteomes. With this method, we map approximately 30,000 unique human phosphorylation sites within a half-hour of data collection. The technology is benchmarked to other state-of-the-art MS platforms using both synthetic peptide standards and with EGF-stimulated HeLa cells. We apply this approach to generate a phosphoproteome multi-tissue atlas of the mouse. Altogether, we detect 81,120 unique phosphorylation sites within 12 hours of measurement. With this unique dataset, we examine the sequence, structural, and kinase specificity context of protein phosphorylation. Finally, we highlight the discovery potential of this resource with multiple examples of phosphorylation events relevant to mitochondrial and brain biology.


Conflict of interest statement

J.J.C. is a consultant for Thermo Fisher Scientific and on the scientific advisory board for Seer and 908 Devices. T.N.A., A.P., H.S., C.H., E.D., and V.S. are employees of Thermo Fisher Scientific. The remaining authors declare no competing interests.

Figures

Fig. 1
Fig. 1. Overview of Orbitrap Astral MS and its key figures of merit.
A Orbitrap Astral instrument schematic, highlighting the quadrupole, Orbitrap, and Astral analyzers. B Tandem mass spectrum of representative phosphopeptide collected using the Astral analyzer. C Distribution of Astral analyzer resolving power as a function of mass from phosphopeptide product ion spectra collected here. D Phosphopeptide product ion mass measurement error from Astral analyzer.
Fig. 2
Fig. 2. Overview of DIA phosphoproteomics on the Orbitrap Astral MS.
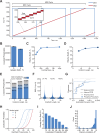
A Illustration of DIA acquisition scheme. B Average number of localized phosphorylation sites identified using DIA method with various isolation widths for n = 3 injection replicates. Error bars indicate maximum and minimum observed values. C Evaluation of phosphopeptide loading mass on performance. Data was collected with a 30-min active gradient and 2 m/z DIA isolation width. D Effect of gradient length on performance. Points represent the average across n = 3 injection replicates. Error bars indicate maximum and minimum observed values. E Evaluation of phosphosite identification reproducibility (for results from (D)). F Evaluation of phosphosite quantitative precision. The relative standard deviation of phosphosite quantities is shown for phosphosites detected across triplicate injections with the median value displayed for each active gradient length. G Comparison of External (maize/human entrapment experiment) and Internal (Spectronaut) FDR on precursor level. H Phosphoproline Decoy Search to test reliability of localization algorithm. The cumulative distribution of localization probabilities is shown for phosphorylation events at different amino acids. I Average site localization error rate as a function of localization probability cutoff. Synthetic phosphopeptide standards spiked into a yeast phosphopeptide background were used as a ground truth for error rate determination. J The distribution of R2 values for linear calibrations curves is shown for phosphopeptides standards detected in at least three concentrations across a five-point dilution series into a constant yeast phosphopeptide background. Source Data are provided as a Source Data file.
Fig. 3
Fig. 3. Biological validation of phosphoproteomics platforms using EGF stimulation.
A Reproducibility of detected phosphosites across biological triplicates for three phosphoproteomics platforms—Orbitrap Astral, Orbitrap Ascend, and timsTOF Pro. Intensity distribution of phosphosites consistently detected (3 out of 3 EGF stimulated replicates) by Orbitrap Astral with overlap indicated for (B) timsTOF Pro and (C) Orbitrap Ascend. D Intensity distribution of phosphosites consistently detected (3 out of 3 EGF stimulated replicates) by timsTOF Pro with overlap indicated for Orbitrap Astral. E Venn diagram of phosphosites detected across all three mass spectrometry platforms. F Volcano plots of phosphosites between EGF stimulation and control across platforms with phosphosites meeting the differential expression criteria (fold-change > 2, p < 0.05 via two-sided t-test without multiple testing correction) indicated in blue and EGFR phosphosites labeled. G Pathway enrichment analysis using the NCATS BioPlanet terms was performed for the three platforms with EGF/ERBB-associated terms indicated in blue. Source Data are provided as a Source Data file.
Fig. 4
Fig. 4. Mouse phosphorylation atlas workflow and results.
A Mouse Phosphorylation Atlas Workflow. B Mouse Tissue Phosphoproteomic Analysis. Numbers of unique phosphorylation sites are shown for each tissue and the total unique sites with the fraction of S, T, and Y localizations indicated. The Huttlin et al. results were generated by researching the raw data in MaxQuant using the same protein database used in this study. C Tissue Specificity of Detected Phosphorylation sites. The y-axis indicates the number of tissues in which a phosphosite was detected. D, E Intensity distributions for phosphorylation sites detected in a given number of tissues for this study and by Huttlin et al., respectively. For the distributions in (D) and (E), the 0.1, 0.25, 0.5, 0.75, and 0.9 percentiles are indicated with the lower error bar, lower box bound, center box line, upper box bound, and upper error bar, respectively. Each distribution was generated by down-sampling to 1000 datapoints from the phosphosite categories in (C). Source data are provided as a Source Data file.
Fig. 5
Fig. 5. Sequence, structural and kinase specificity context of phosphosites.
A Two-dimensional representation of all phosphosites and their 5-amino acid flanking sequences, excluding the central amino acid from the comparison. Each cluster has been manually selected to emphasize the densest regions. B Sequence logo plot for all clusters depicted in (A). C Distribution of confidence scores for all amino acids, specifically S/T/Y, and for phosphorylated S/T/Y detected across all tissues. Source Data are provided as a Source Data file. D Our mouse phosphoproteome data derived from nine tissues was applied to the kinome atlas search tool. E All phosphorylation sites detected in our study are plotted on the x-axis, sorted by the number of kinases that scored higher than 90 for a specific site. F Z-score transformed difference between abundances of shared phosphorylation sites in brain and liver tissue. Vertical dashed lines indicate thresholds for selection of phosphorylation sites that are used for kinase motif enrichment analysis. A chi-squared test was used to calculate p values after applying Haldane’s correction. G Based on the top sites per tissue, a motif enrichment analysis was performed and the resulting frequency of how often a kinase was predicted to act on a site was plotted on the x-axis, along with the p value on the y-axis. The scheme and types of analyses have been adapted from ref. . See Supplementary Data 4 for analysis results.
Fig. 6
Fig. 6. Mitochondrial phosphoproteomics reveals novel liver-specific phosphorylation site.
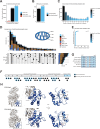
A Bar plot of all detected phosphorylation sites in our study stratified into categories that are directly derived from the PhosphoSitePlus database (downloaded August 22, 2023). B Mouse MitoCarta 3.0 proteins with at least one detected phosphorylation site in our data versus the remainder. C Bar plot indicating the number of mitochondrial phosphorylation sites that occur in a specific number of tissues. D Intersections of phosphorylation sites on mitochondrial proteins per tissue subsets. Intersection sizes of 12 or more are shown. Sub-mitochondrial localization is derived from MitoCarta 3.0. E Dot plot displaying all proteins that harbor phosphorylation sites unique to liver tissue. The highest ranked protein harbors the most phosphorylation sites as indicated on the x-axis. Novel sites are according to the PhosphoSitePlus database. F Schematic representation of the CPS1 peptide chain with all detected phosphorylation sites indicated as novel or previously identified. G Sequence alignment of CPS1 orthologues using Clustal Omega. Patient variant residue and phosphorylation site residue of interest are in gray. H Structural modeling based on structures (PDB: 5DOT (Apo), 5DOU (NAG)) from RCSB PDB. Source Data are provided as a Source Data file.
Fig. 7
Fig. 7. Unique phosphorylation sites in brain tissue.
A Bar plot indicating all sites (black) that were detected per tissue, highlighting the sites that are unique in each tissue (blue). B Number of outliers per tissue based on z-score analysis with an absolute z-score cut-off of 2. C Ranked mitochondrial phosphorylation sites in brain based on z-score, highlighting the OPA1 top site. D Protein domain representation of mouse OPA1, including mitochondrial transition signal (MTS), transmembrane domain (TM), GTPase, PH, and GED domain. Red triangles represent sites of proteolytic cleavage generating the long and short proteo-forms of OPA1. Note, that all identified phosphosites are common to all OPA1 isoforms. Below, details of GTPase and PH domain with indicated phosphorylation sites (pS/Y) found in brain tissue (See Supplementary Fig. 8C for presence of OPA1 phosphorylation sites in other tissues). E Sequence alignment of first GTP-binding site/P-loop among mouse OPA1 isoforms and homologs in human and yeast, as well as related dynamin family members, DNM1L, MFN1, and MFN2, in mouse. Conserved residues are marked with *, including serine 298 in mouse OPA1. F Structure modeling of human OPA1 GTPase domain [263-580] based on RCSB PDB structure 6JTG. Left, Modeling of the entire domain with highlighted GTP-binding domains (G1-5) in blue and bound GDP (yellow). Right, Detail (i.) of the G1/P-loop domain containing the discussed S298 (magenta) and the nucleotide-binding G300 (red). K+ (yellow) stabilizes the vicinity of the nucleotide. Source Data are provided as a Source Data file.

Update of

References

    1. Ardito, F., Giuliani, M., Perrone, D., Troiano, G. & Lo Muzio, L. The crucial role of protein phosphorylation in cell signaling and its use as targeted therapy (Review).Int. J. Mol. Med.40, 271–280 (2017). 10.3892/ijmm.2017.3036 - DOI - PMC - PubMed
    1. Solari, F. A., Dell'Aica, M., Sickmann, A. & Zahedi, R. P. Why phosphoproteomics is still a challenge. Mol. Biosyst.11, 1487–1493 (2015). 10.1039/C5MB00024F - DOI - PubMed
    1. Neville, D. C. A. et al. Evidence for phosphorylation of serine 753 in CFTR using a novel metal-ion affinity resin and matrix-assisted laser desorption mass spectrometry. Protein Sci.6, 2436–2445 (1997). 10.1002/pro.5560061117 - DOI - PMC - PubMed
    1. Anguenot, R., Yelle, S. & Nguyen-Quoc, B. Purification of tomato sucrose synthase phosphorylated isoforms by Fe(III)-immobilized metal affinity chromatography. Arch. Biochem. Biophys.365, 163–169 (1999). 10.1006/abbi.1999.1146 - DOI - PubMed
    1. Posewitz, M. C. & Tempst, P. Immobilized gallium(III) affinity chromatography of phosphopeptides. Anal. Chem.71, 2883–2892 (1999). 10.1021/ac981409y - DOI - PubMed