. 2024 Aug 15;15(1):7041.
doi: 10.1038/s41467-024-50808-w.

Olfactory sensory neuron population expansions influence projection neuron adaptation and enhance odour tracking

Affiliations

Olfactory sensory neuron population expansions influence projection neuron adaptation and enhance odour tracking

Suguru Takagi et al. Nat Commun. .

Abstract

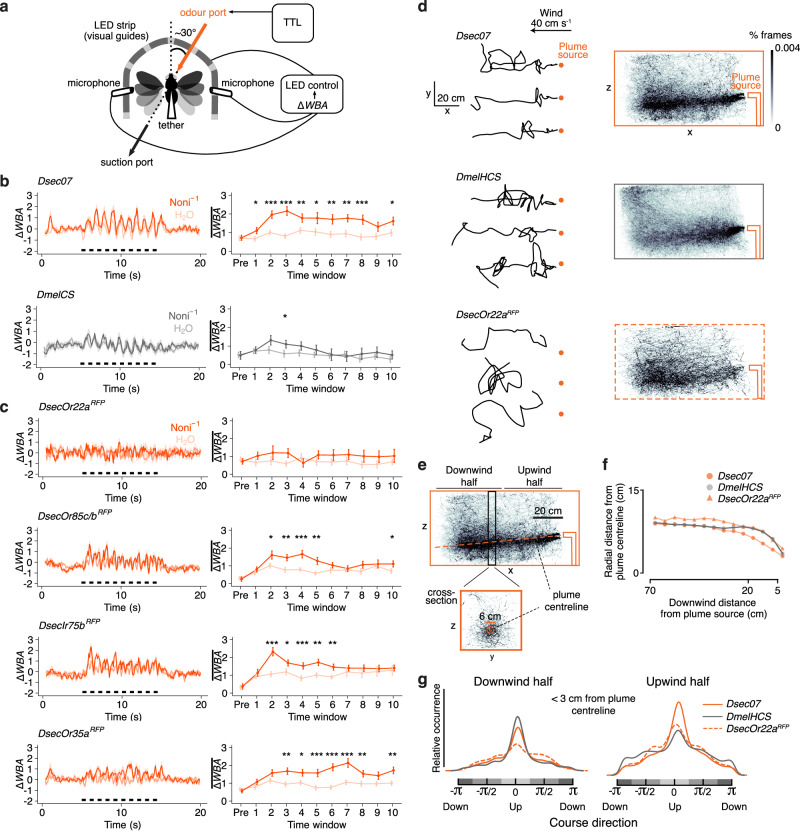
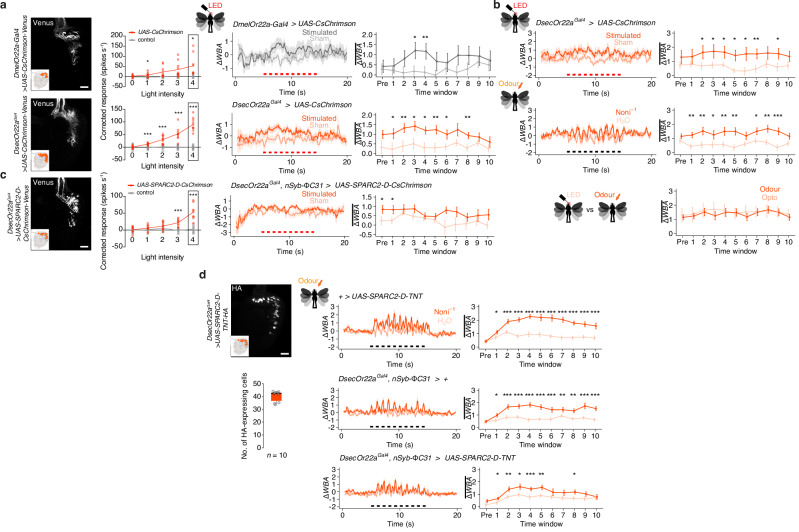
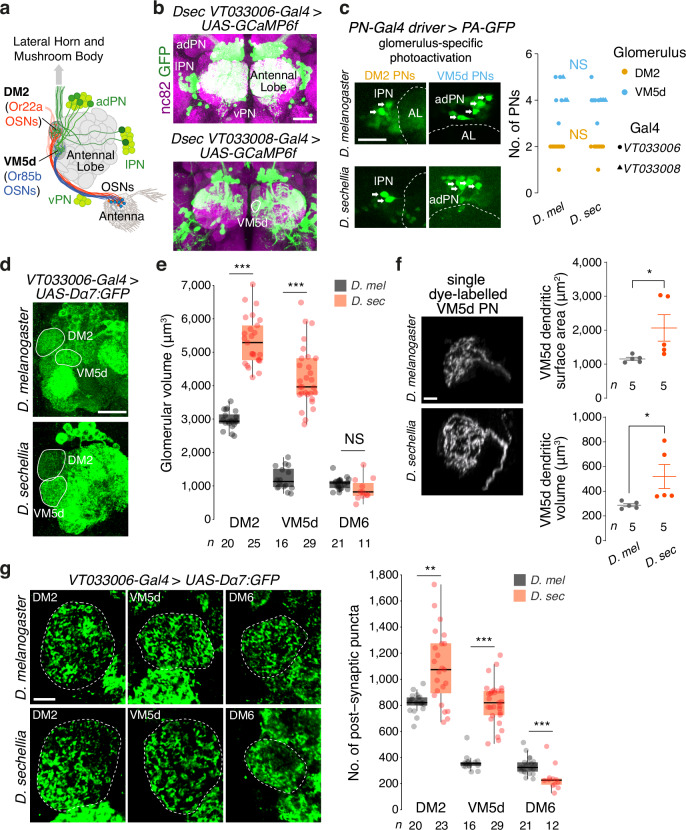
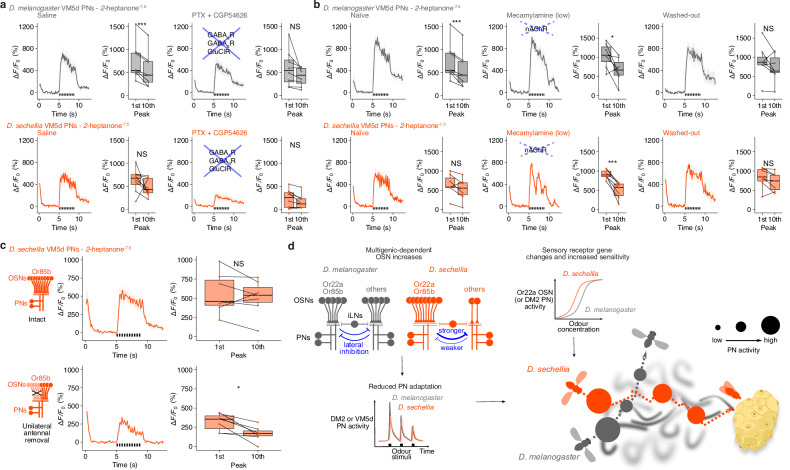
The evolutionary expansion of sensory neuron populations detecting important environmental cues is widespread, but functionally enigmatic. We investigated this phenomenon through comparison of homologous olfactory pathways of Drosophila melanogaster and its close relative Drosophila sechellia, an extreme specialist for Morinda citrifolia noni fruit. D. sechellia has evolved species-specific expansions in select, noni-detecting olfactory sensory neuron (OSN) populations, through multigenic changes. Activation and inhibition of defined proportions of neurons demonstrate that OSN number increases contribute to stronger, more persistent, noni-odour tracking behaviour. These expansions result in increased synaptic connections of sensory neurons with their projection neuron (PN) partners, which are conserved in number between species. Surprisingly, having more OSNs does not lead to greater odour-evoked PN sensitivity or reliability. Rather, pathways with increased sensory pooling exhibit reduced PN adaptation, likely through weakened lateral inhibition. Our work reveals an unexpected functional impact of sensory neuron population expansions to explain ecologically-relevant, species-specific behaviour.


Conflict of interest statement

The authors declare no competing interests.

Figures

Fig. 1
Fig. 1. Selective expansion of noni-sensing olfactory sensory neuron populations is a complex developmental trait.
a Drosophilid phylogeny. Ma, million years ago. b Left top, drosophilid third antennal segment. Left bottom, antennal basiconic 3 (ab3) sensilla house neurons expressing Or22a (and Or22b in D. melanogaster and D. simulans; this paralog is lost in D. sechellia) (hereafter, “Or22a neuron”) and Or85c/b (hereafter, “Or85b neuron”). Right, antennal Or22a/(b) and Or85b expression in D. sechellia (Drosophila Species Stock Centre (DSSC) 14021-0248.07 (Dsec07)) and D. simulans (DSSC 14021-0251.004 (Dsim04)). Scale bar, 25 µm. In addition to ab3 sensilla (within the dashed line), Or85b is expressed in ~ 10 OSNs in ab6 sensilla (Supplementary Fig. 1b). c Sensilla numbers in D. melanogaster (Canton-S, CS), D. simulans (Dsim04) and D. sechellia (Dsec07) determined by RNA FISH using a diagnostic Or probe (grey background) for each sensillum class (ai: antennal intermediate, at: antennal trichoid, ac: antennal coeloconic, sac3: sacculus chamber 3). Ir neuron data are from; Ir75d neurons common to ac1, ac2 and ac4 sensilla are not shown. For these and all other box plots, the centre line represent the median, the box bounds represent the first and third quartiles, and whiskers depict at maximum 1.5 × the interquartile range; individual data points are overlaid. Wilcoxon signed-rank test (two-sided) with comparison to D. melanogaster: ***P < 0.001; **P < 0.01; *P < 0.05; NS, not significant (P > 0.05). Sample sizes are indicated in the figure. d Reciprocal hemizygosity test in D. simulans/D. sechellia hybrids of contributions of Or22a/(b) and Or85c/b to species-specific OSN numbers, using RNA FISH to quantify numbers of Or22a/(b) and Or85b OSNs in the indicated genotypes (“Dsec +” = Dsec07, “Dsim +” = Dsim04, “Dsec -” = DsecOr22aRFP or DsecOr85bGFP, “Dsim -” = DsimOr22a/bRFP or DsimOr85bGFP). See Supplementary Fig. 1f for representative images. Wilcoxon signed-rank test (two-sided) with comparison to wild-type hybrids: ***P < 0.001; NS, P > 0.05. e Quantification of GFP-expressing neurons in antennae of DsecOr85bGFP, DsimOr85bGFP and F1 hybrid males and females, and in F2 progeny of backcrosses of F1 hybrid females to either parental strain. The black line indicates the mean cell number. f Logarithm of odds (LOD) score across all four chromosomes for loci impacting Or85b neuron numbers based on the phenotypic data in e. Solid and dashed horizontal lines mark P = 0.01 and 0.05, respectively. g Effect sizes for the significant QTL intervals on chromosomes 3 and X in the D. simulans backcross. A, D. simulans allele; B, D. sechellia allele. Horizontal lines indicate the mean ± SEM for the cell number count of each allelic combination. A candidate gene, lozenge—encoding a transcription factor involved in sensillar specification—located directly below the X chromosome peak, did not influence species-specific OSN numbers (Supplementary Fig. 2e–i).
Fig. 2
Fig. 2. Persistent behavioural tracking of noni odours in D. sechellia.
a Tethered fly behavioural assay. ΔWBA: left-right difference of standardised wing beat amplitudes, TTL: transistor–transistor logic. b, c Odour-tracking of noni juice and H2O in wild-type D. sechellia and D. melanogaster (b) and D. sechellia Or and Ir mutants (c). Left, time course of ΔWBA (mean ± SEM) where black bars indicate odour stimulation (ten 500 ms pulses with 500 ms intervals). Right, quantification in 1 s time windows immediately prior to stimulus onset (“pre”) and individual stimulus pulses (“1–10”). Mean ± SEM are shown. Paired t test (two-sided): ***P < 0.001; **P < 0.01; *P < 0.05, otherwise P > 0.05. n = 30 animals each. d Left, example flight trajectories in the x-y plane of D. sechellia, D. melanogaster (a hybrid Heisenberg-Canton-S (HCS)) and D. sechellia Or22aRFP mutants in a noni plume. Right, occupancy heat maps of trajectories that came at least once within 10 cm of the plume centreline for Dsec07 (n = 835 trajectories, 7 recording replicates, 105 flies), DmelHCS (n = 1346 trajectories, 4 recording replicates, 60 flies), DsecOr22aRFP (n = 509 trajectories, 6 recording replicates, 90 flies). e Annotated view of the wild-type D. sechellia trajectories (from d) illustrating analyses in f, g. Based upon the trajectory distribution, we inferred that the noni juice plume sank by ~5 cm from the odour nozzle to the end of the tracking zone (Methods and Supplementary Fig. 4d–f). f Mean radial distance of the point cloud from the plume centreline for the trajectories in d. Data were binned into 5 cm y-z plane cross-sections starting 5 cm downwind from the plume origin, and restricted to 10 cm altitude above or below the estimated plume model. Non-parametric bootstrapped comparison (1000 iterations) of medians: P < 0.001. g Kernel density of the course direction distribution of points within a 3 cm radius of the plume centreline (orange circle on cross-section in e), further parsed into the point cloud in the downwind or upwind halves (e). Downwind half kernels: Dsec07 (15,414 points, 367 trajectories), DmelHCS (20,912 points, 511 trajectories), DsecOr22aRFP (3,244 points, 164 trajectories). Upwind half kernels: Dsec07 (136,827 points, 501 trajectories), DmelHCS (80,594 points, 615 trajectories), DsecOr22aRFP (40,560 points, 286 trajectories).
Fig. 3
Fig. 3. Behavioural significance of OSN number.
a Optogenetic stimulation of Or22a OSNs in D. melanogaster and D. sechellia. Left, CsChrimson-Venus expression in the antenna. Scale bar, 20 µm. Middle, single-sensillum recordings of Or22a neuron responses to optogenetic stimulation. Genotypes: D. melanogaster w;UAS-CsChrimson-Venus/+ (control), w;UAS-CsChrimson-Venus/Or22a-Gal4 (experimental), D. sechellia w;;UAS-CsChrimson-Venus/+ (control), w;Or22aGal4/+;UAS-CsChrimson-Venus/+ (experimental). The red line links the mean neuronal response at each light intensity, overlaid with individual data points. Black frames indicate the light intensity used for behavioural experiments. n = 5–10 sensilla (Supplementary Table 1). Right, behavioural responses of the same genotypes in response to optogenetic stimulation (ten 500 ms pulses with 500 ms intervals, indicated by the red bars). Time courses of ΔWBA (mean ± SEM) and quantification in each time window (mean ± SEM) are shown. n = 29 (D. melanogaster) and 30 (D. sechellia) animals. b Behavioural responses of D. sechellia upon optogenetic stimulation of Or22a OSNs and to noni odour stimulation (genotype as in a). Bottom, comparison of ΔWBA between light and odour responses, plotted as in a. n = 27 animals each. c Left, sparser Or22a neuron expression of CsChrimson in D. sechellia; dense packing of soma prevented quantification but is likely ~50% of total OSNs (Supplementary Fig. 6b, d). Scale bar, 20 µm. Middle, single-sensillum recordings of Or22a OSN responses to optogenetic stimulation. ab3 sensilla were first identified by stimulation with diagnostic odours (not shown); responses of CsChrimson-expressing neurons (experimental group) and non-expressing neurons (control, often from the same animal) are shown. n = 8-9 (Supplementary Table 1). Right, D. sechellia behaviour upon optogenetic activation of about half of their Or22a expressing neurons, plotted as in a. n = 26 animals. Genotypes: D. sechellia w;Or22aGal4/UAS-SPARC2-D-CsChrimson-Venus;;nSyb-ΦC31/+. d Left, HA immunofluorescence in a D. sechellia antenna expressing UAS-SPARC2-D-TNT-HA in Or22a neurons. Scale bar, 20 µm. Quantification (below) reveals ~50% of cells express the effector. Right, odour-tracking of noni juice of flies in effector control, driver control and experimental animals with blocked synaptic transmission, plotted as in a. n = 34 animals each. Genotypes: D. sechellia w;UAS-SPARC2-D-TNT-HA-GeCO/+;;+/+ (effector control), D. sechellia w;Or22aGal4/+;;nSyb-ΦC31/+ (driver control), D. sechellia w;Or22aGal4/UAS-SPARC2-D-TNT-HA-GeCO;;nSyb-ΦC31/+ (experimental group). For ad unpaired Student’s t test (two-sided) (electrophysiology) or paired t test (two-sided) (behaviour): ***P < 0.001; **P < 0.01; *P < 0.05; otherwise P > 0.05.
Fig. 4
Fig. 4. Increased sensory and synaptic pooling in noni-sensing glomeruli.
a Antennal lobe circuitry. PN soma (green) are located in anterodorsal (ad), lateral (l) and ventral (v) clusters. LNs are not illustrated. b Labelling of PNs in D. sechellia using VT033006-Gal4 or VT033008-Gal4 to express UAS-GCaMP6f (used as a fluorescent reporter) through immunofluorescence for GFP (detecting GCaMP6f) and nc82 (detecting the synaptic protein Bruchpilot). VM5d is outlined in the bottom image. Scale bar, 25 µm. c Left, representative images of VM5d and DM2 PNs labelled by photo-activatable GFP (PA-GFP) in D. melanogaster and D. sechellia. Genotypes: D. melanogaster w;UAS-C3PA-GFP/+;UAS-C3PA-GFP/VT033008-Gal4 (VM5d PNs) or w;UAS-C3PA-GFP/+;UAS-C3PA-GFP/VT033006-Gal4 (DM2 PNs); D. sechellia w,UAS-C3PA-GFP/w,VT033008-Gal4 (VM5d PNs) or w,UAS-C3PA-GFP/w,VT033006-Gal4 (DM2 PNs). Arrows indicate the PN cell bodies; faint background GFP signal is visible in other soma. Antennal lobe (AL) boundaries are demarcated by dashed lines. Scale bar, 25 µm. Right, quantification of PN numbers. Mann–Whitney U test (two-sided): NS, P > 0.05. d Visualisation of antennal lobe glomeruli by expression of the Dα7-GFP post-synaptic marker in PNs. Genotypes: D. melanogaster w;;VT033006-Gal4/UAS-Dα7-GFP, D. sechellia w,VT033006-Gal4/w;UAS-Dα7-GFP/+. Scale bar, 20 µm. e Quantification of the volumes of DM2, VM5d and a control glomerulus, DM6 (innervated by Or67a neurons) in D. sechellia and D. melanogaster. Wilcoxon signed-rank test (two-sided): ***P < 0.001; **P < 0.005. f Representative images of single dye-labelled VM5d PNs in D. melanogaster and D. sechellia. Mean ± SEM are shown. Genotypes: D. melanogaster w;VM5d-Gal4/UAS-GFP, D. sechellia w;VM5d-Gal4/UAS-myrGFP (GFP fluorescence is not shown). Scale bar, 5 µm. Right, quantification of VM5d PN dendritic surface area and volume. Student’s t test (two-sided): *P < 0.05. g Left, representative images of post-synaptic puncta in VM5d, DM2, and DM6 PNs labelled by Dα7-GFP in D. melanogaster and D. sechellia (genotypes as in d). Scale bar, 5 µm. Right, quantification of the number of post-synaptic puncta in these glomeruli. Wilcoxon signed-rank test (two-sided): ***P < 0.001; **P < 0.005.
Fig. 5
Fig. 5. Sustained representation of noni odour stimuli in PNs of D. sechellia.
ad Whole-cell patch clamp recording from VM5d PNs in D. melanogaster and D. sechellia; glomerular circuitry is schematised on the left. Genotypes as in Fig. 4f. a Voltage trace of VM5d PNs in response to a pulse of 2-heptanone, and comparison of input resistance (b), resting membrane potential (c), and spontaneous activity (d) between species. bd mean ± SEM are shown. n = 4 (D. melanogaster) and 5 (D. sechellia) animals. e Dose-response relationship of VM5d PN firing to 2-heptanone stimulation. Quantification of spike frequency was performed in a 50 ms window covering the peak response. Mean ± SEM are shown. n = 2–5 animals (Supplementary Table 1). EC50 values [Log] are as follows: −7.46 (Dmel), −6.87 (Dsec). f VM5d PN spike frequency in response to 10−6 dilution of 2-heptanone. Left, time course of spike frequency. Mean ± SEM are shown. Right, quantification of the decay magnitude (i.e., start (first 50 ms) - end (last 500 ms before odour offset)). n = 5 animals each. g, h Dose-dependent, odour-evoked calcium responses in Or85b/VM5d (g) and Or22a/DM2 (h) OSN axon termini and PN dendrites in the antennal lobe of D. melanogaster and D. sechellia, reported as normalised GCaMP6f fluorescence changes. Plots are based on the data in Supplementary Fig. 8. EC50 values [Log] are as follows: Or85b OSNs: −6.50 (Dmel), −6.51 (Dsec); VM5d PNs: –7.82 (Dmel), −7.87 (Dsec); Or22a OSNs: −7.42 (Dmel), −8.23 (Dsec); DM2 PNs: −7.97 (Dmel), −9.61 (Dsec). Genotypes are as follows. OSN imaging: D. melanogaster w;UAS-GCaMP6f/Orco-Gal4,UAS-GCaMP6f, D. sechellia w,UAS-GCaMP6f/w,UAS-GCaMP6f;;+/DsecOrcoGal4. PN imaging: D. melanogaster w;UAS-GCaMP6f/+;+/VT033008-Gal4 (VM5d PNs), D. melanogaster w;UAS-GCaMP6f/+;+/VT033006-Gal4 (DM2 PNs), D. sechellia w,UAS-GCaMP6f/w,VT033008-Gal4 (VM5d PNs), w,UAS-GCaMP6f/w,VT033006-Gal4 (DM2 PNs). i Responses of Or85b OSNs to pulsed odour stimuli (ten 200 ms pulses, each separated by 200 ms, as indicated by the black bars). For both species, left panels show the time course (mean ± SEM ΔF/F0) and right panels show the quantification of ΔF/F0 peak to the 1st and 10th stimulation. n = 8 animals each. Genotypes as in g. j, k Pulsed odour responses of VM5d PNs (j) and DM2 PNs (k). Mean ± SEM are shown in the time course. n = 8 animals each. Genotypes as in g, h. l, m Pulsed odour responses of DM4 (Or59b) and VA2 (Or92a) PNs (two control pathways where the number of partner OSNs is conserved between species (Fig. 1c)). Mean ± SEM are shown in the time course. n = 6 animals each. See Supplementary Fig. 11 for dose-response data. Genotypes are as for DM2 PN imaging in h. For af Student’s t test (two-sided) and for im paired t test (two-sided): ***P < 0.001, **P < 0.01, *P < 0.05, NS P > 0.05.
Fig. 6
Fig. 6. Mechanisms of sustained PN responses in D. sechellia.
a Odour pulse responses of VM5d PNs in D. melanogaster and D. sechellia following application of GABA receptor antagonists. PN responses in normal AHL saline (left) or containing 100 µM picrotoxin (PTX) + 50 µM CGP54626 (right). Time courses (mean ± SEM ΔF/F0) and quantification of ΔF/F0 peak to the 1st and 10th stimulation are shown. Genotypes as in Fig. 5g. b Odour pulse responses of VM5d PNs in D. melanogaster and D. sechellia following application of low doses (200 µM) of mecamylamine (nAChR antagonist) to weakly block cholinergic inputs. PN responses in normal AHL saline, mecamylamine and AHL saline wash-out are shown. Time courses (mean ± SEM ΔF/F0) and quantification are shown. n = 7 animals each. c Odour pulse responses of D. sechellia VM5d PNs in intact (top) and right antenna-ablated (bottom) animals, which halves the OSN input. Time courses (mean ± SEM ΔF/F0) and quantification are shown. n = 7 animals each. d Model illustrating the complementary effects of OSN sensitisation (due to receptor tuning) and reduced PN adaptation (putatively due to OSN population increases; see Discussion) on odour-evoked sensory representations. The schematised PN activities in the cartoon on the right represent the combination of both processes, which we speculate lead to more sensitive and persistent long-range olfactory attraction toward the noni host fruit by D. sechellia, but not D. melanogaster. For ac paired t test (two-sided): ***P < 0.001, *P < 0.05, NS P > 0.05. n = 8 animals each.

Update of

References

    1. Herculano-Houzel, S. Not all brains are made the same: new views on brain scaling in evolution. Brain Behav. Evol.78, 22–36 (2011). 10.1159/000327318 - DOI - PubMed
    1. Godfrey, R. K. & Gronenberg, W. Brain evolution in social insects: advocating for the comparative approach. J. Comp. Physiol. A Neuroethol. Sens. Neural Behav. Physiol.205, 13–32 (2019). 10.1007/s00359-019-01315-7 - DOI - PubMed
    1. Williams, R. W. & Herrup, K. The control of neuron number. Annu. Rev. Neurosci.11, 423–453 (1988). 10.1146/annurev.ne.11.030188.002231 - DOI - PubMed
    1. Roberts, R. J. V., Pop, S. & Prieto-Godino, L. L. Evolution of central neural circuits: state of the art and perspectives. Nat. Rev. Neurosci.23, 725–743 (2022). 10.1038/s41583-022-00644-y - DOI - PubMed
    1. Arendt, D., Bertucci, P. Y., Achim, K. & Musser, J. M. Evolution of neuronal types and families. Curr. Opin. Neurobiol.56, 144–152 (2019). 10.1016/j.conb.2019.01.022 - DOI - PMC - PubMed

Grants and funding

LinkOut - more resources