. 2024 Oct;30(10):3015-3026.
doi: 10.1038/s41591-024-03144-x. Epub 2024 Aug 15.

Brain aging patterns in a large and diverse cohort of 49,482 individuals

Affiliations

Brain aging patterns in a large and diverse cohort of 49,482 individuals

Zhijian Yang et al. Nat Med. 2024 Oct.

Abstract

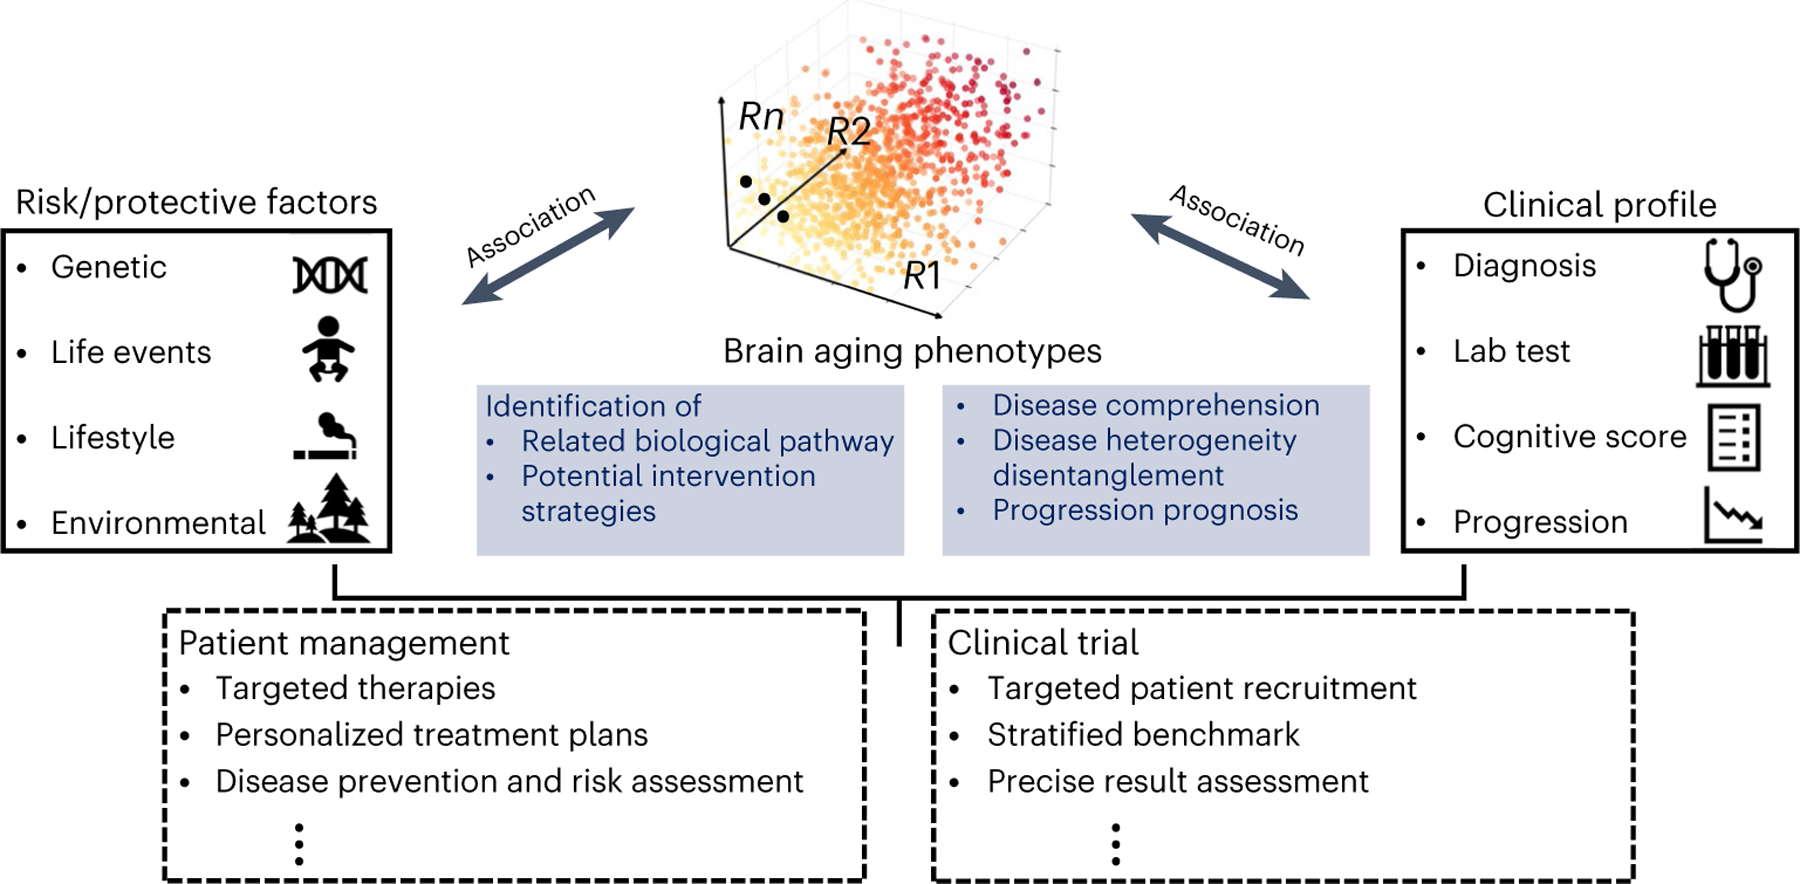
Brain aging process is influenced by various lifestyle, environmental and genetic factors, as well as by age-related and often coexisting pathologies. Magnetic resonance imaging and artificial intelligence methods have been instrumental in understanding neuroanatomical changes that occur during aging. Large, diverse population studies enable identifying comprehensive and representative brain change patterns resulting from distinct but overlapping pathological and biological factors, revealing intersections and heterogeneity in affected brain regions and clinical phenotypes. Herein, we leverage a state-of-the-art deep-representation learning method, Surreal-GAN, and present methodological advances and extensive experimental results elucidating brain aging heterogeneity in a cohort of 49,482 individuals from 11 studies. Five dominant patterns of brain atrophy were identified and quantified for each individual by respective measures, R-indices. Their associations with biomedical, lifestyle and genetic factors provide insights into the etiology of observed variances, suggesting their potential as brain endophenotypes for genetic and lifestyle risks. Furthermore, baseline R-indices predict disease progression and mortality, capturing early changes as supplementary prognostic markers. These R-indices establish a dimensional approach to measuring aging trajectories and related brain changes. They hold promise for precise diagnostics, especially at preclinical stages, facilitating personalized patient management and targeted clinical trial recruitment based on specific brain endophenotypic expression and prognosis.


Conflict of interest statement

H.J.G. has received travel grants and speaker’s honoraria from Fresenius Medical Care, Neuraxpharm, Servier and Janssen Cilag as well as research funding from Fresenius Medical Care. R.T.S. received consulting income from Octave Bioscience and has received compensation for scientific reviewing from the American Medical Association. T.L.S.B. has received investigator-initiated research funding from the NIH, the Alzheimer’s Association, the Foundation at Barnes-Jewish Hospital, Siemens Healthineers and Avid Radiopharmaceuticals (a wholly owned subsidiary of Eli Lilly and Company). She participates as a site investigator in clinical trials sponsored by Eli Lilly and Company, Biogen, Eisai, Jaansen and Roche. She has served as a paid and unpaid consultant to Eisai, Siemens, Biogen, Janssen and Bristol-Myers Squibb. The other authors declare no competing interests.

Figures

Fig. 1 |
Fig. 1 |. Surreal-GAN disentangles brain aging heterogeneity through a dimensional representation approach.
a, The heterogeneous aging effects contribute to distinct alterations in human brain structures, leading to various brain change patterns. Surreal-GAN, a weakly supervised deep-learning approach utilizing generative learning, identifies patterns of brain change attributed to the aging process by capturing transformations from a REF population to a TAR population. It specifically represents the diversity of such brain change patterns in a given individual using multi-dimensional R-indices. These R-indices serve as indicators of and quantify the type and severity of distinct brain change patterns, which are presumed to reflect underlying neuropathological processes and their stages. b, In this study, to disentangle the neuroanatomical heterogeneity related to brain aging, we set the REF and TAR groups to pre-aging individuals (<50 years old) and all older adults (>50 years old), respectively. Surreal-GAN identifies five reproducible dimensions, each associated with distinct brain change patterns. Further statistical analyses uncover a range of influential factors associated with each dimension, encompassing pathological influences, lifestyle factors, life events and genetic variants.
Fig. 2 |
Fig. 2 |. Surreal-GAN identifies five dimensions of brain aging.
a, The severity of brain aging along five dimensions in each participant was quantified by the five R-indices (R1–R5), which revealed distinct patterns of associated gray matter atrophy. Characteristic patterns for each R-index are shown via voxel-wise t-tests performed for each R-index while adjusting for age, sex, intracranial volume (ICV) and the remaining four R-indices. False discovery rate (FDR) correction was performed to adjust multiple comparisons with a P value threshold of 0.001. b, The five R-indices show different levels of associations with WMH volumes. ρc and ρ denotes associations with and without adjusting for age and sex, respectively. R5 shows the strongest positive associations. c, The five R-indices demonstrate positive Pearson correlations with each other, with the strongest associations observed among R3, R4 and R5. d, The five R-indices exhibit significant positive associations with chronological age. Additionally, significant differences, marked by asterisks, were found between males and females in the correlations (ρ) between age and R1, R3 and R5. Moreover, adjusting for age, male and female groups show significant differences in distributions of R-indices, as shown by Cohen’s d (Male > Female) values as effect sizes.
Fig. 3 |
Fig. 3 |. R-indices are associated with chronic diseases, and MCI/Dementia progression, and the risk of mortality.
a, The distributions of R-indices are significantly different between the HC group and each patient (PT) group corresponding to one of the 13 chronic diseases, after adjusting for age and sex (P < 6.6 × 10⁻⁴, Bonferroni-corrected). Warmer colors denote larger Cohen’s d (PT > HC). Distributions without color fill indicate no significant difference from the HC group (gray). b, Values of the R2–R5 indices exhibit associations with the risk of progression to MCI or dementia, as indicated by the corresponding HRs. Cox proportional hazard models were used for testing associations, adjusting for age and sex. c, The R-indices contribute to enhanced performance in predicting disease progression. Based on the significance of R-indices demonstrated in b, we progressively incorporated R-indices as features one by one when fitting the Cox proportional hazard model on participants over 60 years old at baseline. For each combination of features, 100 iterations of 20% holdout cross-validation were performed to derive concordance indices. d, The progression paths in R2, R3 and R5 of eight representative participants transitioning either from CN to MCI or from MCI to dementia. Different colors represent the distinct diagnoses. e, The baseline R5 shows significant associations with the risk of mortality, with age and sex adjusted as covariates in Cox regression. Similar to c, R-indices were progressively included as features in cross-validation for mortality risk prediction among participants over 60 years old (error bar, 95% CI; center line, median; box limits, upper and lower quartiles; whiskers, 1.5× interquartile range; points, outliers).
Fig. 4 |
Fig. 4 |. Associations between R-indices and lifestyle, cognition and CSF/plasma biomarkers.
a, The five R-indices have distinct levels of association with different cognitive variables. Partial correlation (two-sided) was used for testing the associations between R-indices and cognitive scores, adjusting for age and sex. Additional site adjustments were performed for MMSE, DSST, TMT-A and TMT-B to account for the utilization of multi-site data. Significantly associated R-indices are marked by *(P < 1.25 × 10⁻³, Bonferroni-corrected). Partial correlation coefficients are shown as centers of bar plots, with error bars representing 95% CIs. The sample sizes used to derive these coefficients are indicated next to the names of the cognitive variables. ADNI-MEM, ADNI-EF, ADNI-VS and ADNI-LAN are four ADNI composite cognitive scores related to memory, executive function, visuospatial functioning and language. b, Among the R-indices, R2, R3 and R5 have significant associations (marked by *) with 11 CSF/plasma biomarkers obtained from the ADNI study (P < 6 × 10⁻⁴). The CSF biomarkers are labeled in blue, and the plasma biomarkers are labeled in red. The radial graph presents the values (center) and 95% CI (error bands) of the correlation coefficients. For easier visualization, we invert the signs of negative coefficient (denoted by |ρ|) when making the plot. The ‘+’ and ‘−’ signs alongside the biomarker names indicate positive and negative correlations. Due to the small sample sizes, the Benjamini–Hochberg procedure was used for FDR correction c, The five R-indices show significant associations with a group of environmental/lifestyle factors and life events from the UKBB study (P < 8.7 × 10⁻⁵, Bonferroni-corrected). Partial correlation adjusting for age and sex was used, as in a. The number of ‘*’ indicates correlation coefficients (legend). Positive and negative associations are denoted by ‘+’ and ‘−’ signs, respectively, adjacent to the factor names. For all three figures, two-sided t-tests were performed to test the significance of correlation coefficients. MMSE, Mini-Mental State Exam; DSST, Digit Symbol Substitution Test; TMT-A/B, Trail Making Test Part A/B; ADNI-VS, ADNI visuospatial functioning composite; ADNI-LAN, ADNI language composite.
Fig. 5 |
Fig. 5 |. Five R-indices were associated with 73 genomic loci.
a, Overall, 73 genomic loci were associated with the five R-indices using a genome-wide P value threshold (−log10(P) > 7.30). For visualization purposes, we annotated the locus with the top lead SNP. Two-sided t-tests were applied for testing the significance of regression coefficients of SNPs. b, Phenome-wide associations of our identified genomic loci in the EMBL-EBI GWAS catalog (query date, 2 July 2023 via FUMA103 v.1.5.4). We examined the candidate and independent significant SNPs within each genomic locus and connected them to various clinical traits through a comprehensive query. The width of each connection represented the number of associations between the genomic loci revealed in our study and clinical traits in the literature. These traits were grouped into high-level categories, including different organ systems, psychiatric and psychological conditions and lifestyle factors, body shape, etc. To enhance visual understanding of each category, we generated keyword cloud plots based on the frequency of clinical traits within each category. We excluded brain structure-related traits, which were expected to have the highest number of associations with the SNPs we identified.
Fig. 6 |
Fig. 6 |. The R-indices can have broad implications for healthcare.
The deep-learning-derived R-indices are derived brain aging phenotypes that can serve as endophenotypes, or intermediate phenotypes, of diverse underlying neuropathologic processes that accompany aging. They also aid in understanding the risk and protective factors contributing to this heterogeneity. More notably, these R-indices, combined with risk factors and clinical profiles, establish a concrete system for personalized patient management and targeted clinical trial recruitment designs.

References

    1. Peters R Ageing and the brain. Postgrad. Med J 82, 84–88 (2006). - PMC - PubMed
    1. Davatzikos C, Xu F, An Y, Fan Y & Resnick SM Longitudinal progression of Alzheimer’s-like patterns of atrophy in normal older adults: the SPARE-AD index. Brain 132, 2026–2035 (2009). - PMC - PubMed
    1. Dubois B et al. Preclinical Alzheimer’s disease: definition, natural history, and diagnostic criteria. Alzheimers Dement 12, 292–323 (2016). - PMC - PubMed
    1. Davatzikos C Machine learning in neuroimaging: progress and challenges. Neuroimage 197, 652–656 (2019). - PMC - PubMed
    1. Tian YE et al. Heterogeneous aging across multiple organ systems and prediction of chronic disease and mortality. Nat. Med 29, 1221–1231 (2023). - PubMed