. 2024 Sep;30(9):2499-2507.
doi: 10.1038/s41591-024-03195-0. Epub 2024 Aug 15.

DNA liquid biopsy-based prediction of cancer-associated venous thromboembolism

Affiliations

DNA liquid biopsy-based prediction of cancer-associated venous thromboembolism

Justin Jee et al. Nat Med. 2024 Sep.

Abstract

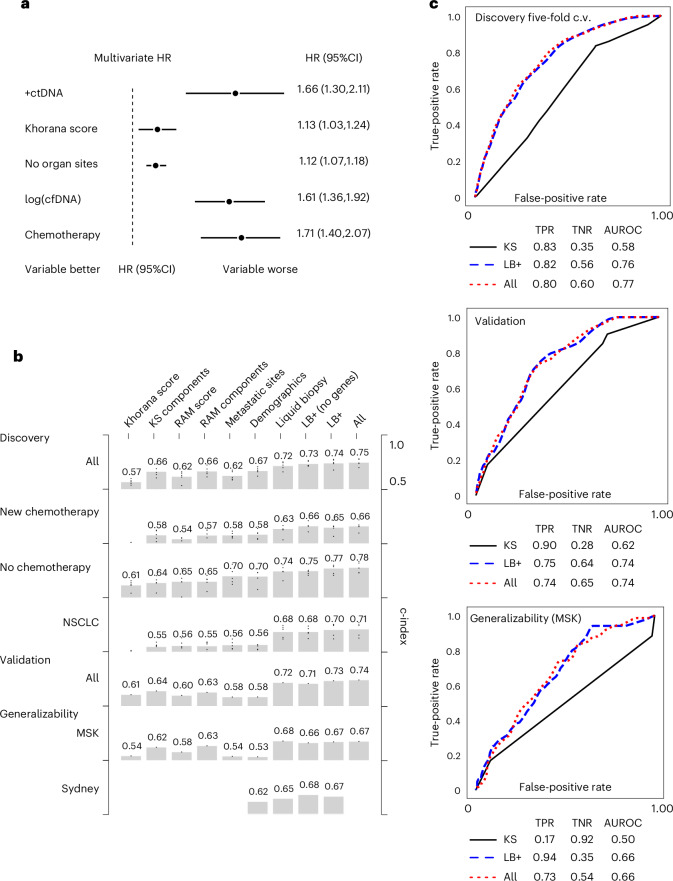
Cancer-associated venous thromboembolism (VTE) is a major source of oncologic cost, morbidity and mortality. Identifying high-risk patients for prophylactic anticoagulation is challenging and adds to clinician burden. Circulating tumor DNA (ctDNA) sequencing assays ('liquid biopsies') are widely implemented, but their utility for VTE prognostication is unknown. Here we analyzed three plasma sequencing cohorts: a pan-cancer discovery cohort of 4,141 patients with non-small cell lung cancer (NSCLC) or breast, pancreatic and other cancers; a prospective validation cohort consisting of 1,426 patients with the same cancer types; and an international generalizability cohort of 463 patients with advanced NSCLC. ctDNA detection was associated with VTE independent of clinical and radiographic features. A machine learning model trained on liquid biopsy data outperformed previous risk scores (discovery, validation and generalizability c-indices 0.74, 0.73 and 0.67, respectively, versus 0.57, 0.61 and 0.54 for the Khorana score). In real-world data, anticoagulation was associated with lower VTE rates if ctDNA was detected (n = 2,522, adjusted hazard ratio (HR) = 0.50, 95% confidence interval (CI): 0.30-0.81); ctDNA- patients (n = 1,619) did not benefit from anticoagulation (adjusted HR = 0.89, 95% CI: 0.40-2.0). These results provide preliminary evidence that liquid biopsies may improve VTE risk stratification in addition to clinical parameters. Interventional, randomized prospective studies are needed to confirm the clinical utility of liquid biopsies for guiding anticoagulation in patients with cancer.


Conflict of interest statement

J.J. has a patent licensed by MDSeq, Inc. J.G. is a former employee of Agilent Technologies and a current employee of NeoGenomics. J.H. and K.G. are current employees of Agilent Technologies. M.E.A. has consulted for Janssen Global Services, Bristol Myers Squibb, AstraZeneca, Roche and Biocartis and has participated in speaker’s bureau activities for Biocartis, Invivoscribe, Physiciansʼ Education Resource, PeerView Institute for Medical Education, Clinical Care Options and RMEI Medical Education. N.P. has received honoraria from Boehringer Ingelheim, Merck Sharp & Dohme, Merck, Bristol Myers Squibb, AstraZeneca, Takeda, Pfizer, Roche, Novartis, Ipsen and Bayer and received research funding from Bayer, Pfizer and Roche. S.P.S. holds equity in Canesia Health, Inc. P.R. has received research funding from GRAIL, Illumina, Novartis, Epic Sciences and ArcherDx and served as a consultant for Novartis, Foundation Medicine, AstraZeneca, Epic Sciences, Inivata, Natera and Tempus. J.S.R.-F. is a current employee of AstraZeneca; has served as a consultant for Goldman Sachs, Paige.AI and REPARE Therapeutics; and has served as an advisor for Roche, Genentech, Roche Tissue Diagnostics, Ventana, Novartis, InVicro, GRAIL, Goldman Sachs, Paige.AI and Volition RX. M.L. has received honoraria from Merck, AstraZeneca, Bristol Myers Squibb, Blueprint Medicines, Janssen Pharmaceuticals, Takeda Pharmaceuticals, Lilly Oncology, LOXO Oncology, Bayer, ADC Therapeutics, Riken Genesis and Paige.AI and research funding from LOXO Oncology, Merus and Helsinn Therapeutics. J.Z. has served as a consultant for Calyx, Sanofi, CSL Behring, Janssen, Sanofi, CSL and Parexel and received research funding from Incyte Corporation and QUercegen and honoraria from Pfizer/Bristol Myers Squibb, Portola and Daiichi. M.F.B. has consulted for PetDx and Eli Lilly and received research funding from GRAIL. B.T.L. has received research funding from Amgen, Genentech, AstraZeneca, Daiichi Sankyo, Eli Lilly, Illumina, GRAIL, Guardant Health, Hengrui Therapeutics, MORE Health and Bolt Biotherapeutics. S.M. has served as a consultant for Janssen Pharmaceuticals; is developing a licensing agreement with Superbio.ai, Inc. for NLP software featured in this paper; is the principal owner of Daboia Consulting, LLC; and has a US patent application for PINES. J.J., B.T.L. and S.M. have applied for a US patent related to the research in this paper. The other authors declare no competing interests.

Figures

Fig. 1
Fig. 1. ctDNA is associated with cancer-associated VTE risk.
a, Aalen–Johansen curves and associated Fine–Gray HR for time-to-VTE from time of plasma draw (first ctDNA sequencing) with death as a competing risk for patients with versus without ctDNA in the discovery cohort (P value from two-sided test = 1.1 × 10−15). b, Aalen–Johansen curves further stratified by VAF quartile (q1: detected VAF < 0.005, q2: 0.005 ≤ VAF < 0.21, q3: 0.21 ≤ VAF < 0.112, q4: 0.112 ≤ VAF < 0.99). c, HR for VTE if ctDNA+ by cancer type for all cancers. d, HR for VTE if an alteration in the listed genes was detected versus not detected in plasma (adjusted HR (aHR) for the cancer types in c for all genes with detected alterations in at least 30 patients in the discovery cohort). e, Fine–Gray HR for VTE if ctDNA+ in the validation and generalizability cohorts. For ce, center points denote HR, and whiskers denote 95% CI.
Fig. 2
Fig. 2. Predictors of VTE in patients with cancer.
a, Multivariate Fine–Gray model (center: HR, whiskers: ±95% CI) comparing associations between the listed variables and VTE (+ctDNA, patients with detectable ctDNA; cfDNA, cfDNA concentration in ng ml−1 plasma) in the discovery cohort. b, RSF trained on only listed subset of variables (All, all variables in separate categories combined; see Supplementary Information for details). Bar plots show mean Harrell’s c-index, with dots corresponding to individual experiments in five-fold cross-validation experiments or the validation and generalizability cohorts, for time of cancer-associated VTE from time of ctDNA draw. c, Dynamic ROC curve for the probability of VTE at 6 months computed using the listed RSFs. AUC, true-positive rate (TPR; sensitivity), true-negative rate (TNR; specificity) and recall (±95% CI) were computed in five-fold cross-validation (c.v.) in the discovery cohort or using the validation or generalizability cohorts as the test cohort.
Fig. 3
Fig. 3. Assessing the potential benefit of anticoagulation at time of cohort entry for preventing cancer-associated VTE stratified by ctDNA presence or absence.
a,b, Aalen–Johansen curves for time-to-VTE from time of plasma draw with death as a competing risk with or without anticoagulation (ac) in ctDNA+ patients (a) and in ctDNA patients (b). Adjusted hazard ratios (aHRs) for ac are from Fine–Gray proportional hazards models adjusted for age, cancer type and time since diagnosis.
Extended Data Fig. 1
Extended Data Fig. 1. Consort diagram.
Patient inclusion for the Discovery, Validation, and Generalizability cohorts.
Extended Data Fig. 2
Extended Data Fig. 2. Venous thromboembolism (VTE) rates by cancer type in the Discovery cohort.
Univariate hazard ratios for VTE events for patients with vs. all others without a given cancer type. The number in each subgroup is given in Supplementary Table 1.
Extended Data Fig. 3
Extended Data Fig. 3. Venous thromboembolism (VTE) rates and cell-free DNA (cfDNA) concentration.
Univariate hazard ratios (+−95%CI) for VTE with log10(cfDNA concentration in ng/mL plasma) as a variable stratified by cancer type in the discovery cohort.
Extended Data Fig. 4
Extended Data Fig. 4. Sensitivity Analyses.
Aalen-Johansen time-to-event analysis to time of venous thromboembolism (VTE) with death as a competing risk, (A) from time of diagnosis left truncated at time of plasma draw (* at risk numbers adjusted for left truncation; that is patients entering the risk set after the start date), (B) from time of plasma draw, showing only patients without VTE, death, or right censorship at 6 months for both cohorts stratified by the presence (ctDNA + ) or absence (ctDNA-) of detectable circulating tumor DNA (ctDNA), or (D) from time of second plasma draw in patients with two draws (Discovery cohort only), stratified by ctDNA status in each draw. Confidence interval (CI); hazard ratio (HR). C. Kaplan-Meier analysis with Cox Proportional Hazards reported for VTE in the Discovery cohort.
Extended Data Fig. 5
Extended Data Fig. 5. Circulating tumor DNA (ctDNA) levels in patients with vs. without prior venous thromboembolism (VTE).
ctDNA levels are quantified by the variant allele frequency (VAF) detected from individual patients. Graphs represent boxplots showing median +/− 25%ile and 75%ile with whiskers corresponding to 5%ile and 95%ile of the log10(max VAF of all mutations) among patients with (true) vs. without (false) prior VTE. Patients without detectable ctDNA had max VAF set to −5 on the log axis. Groups are different (two-sided p = 3.6x10⁻⁹ by Mann-Whitney U test).
Extended Data Fig. 6
Extended Data Fig. 6. Correlates of circulating tumor DNA (ctDNA) levels.
Boxplots show median +/− 25%ile and 75%ile with whiskers corresponding to 5%ile and 95%ile for log10(ctDNA variant allele frequency [VAF]) vs (A) number of organ sites (two-sided p = 5.5x10−190), (B) Khorana score (two-sided p = 2.1×10⁻¹⁶), and (D) chemotherapy receipt within 30 days of plasma draw from individual patients (two-sided p = 1.6×10−40). C. Scatterplot of max VAF vs cell-free DNA (cfDNA) concentration in ng/μL (two-sided p = 7.3x10−215). In A, B and D samples without ctDNA are represented by a log10(max VAF) of −5.
Extended Data Fig. 7
Extended Data Fig. 7. Multivariate Fine Gray models.
Cell-free DNA (cfDNA); circulating tumor DNA (ctDNA); metabolic tumor volume (MTV); hazard ratio (HR).
Extended Data Fig. 8
Extended Data Fig. 8. More on random survival forest performance.
a. Mean permutation variable importances (for all variables with >0.001 importance) in the ‘All’ RSF in Fig. 2b. Points represent individual experiments from 10x cross-validation. b. Risk scores from LB+ in 5-fold cross-validation by cancer type. Boxes represent median + /-IQR, with whiskers representing 5–95%iles and dots representing outliers. c. Aalen-Johansen survival curves for VTE from time of plasma draw with death as a competing risk stratified by the risk quantile from the’All’ RSF in Fig. 2b for the Discovery (left) and Generalizability (right) cohorts (Cox PH 2-sided p = 3.8x10−80). Area under the curve (AUC); cell-free DNA (cfDNA); hepatocellular carcinoma (HCC); non-small cell lung cancer (NSCLC); variant allele frequency (VAF); white blood cell count (WBC).
Extended Data Fig. 9
Extended Data Fig. 9. DNA extraction methods comparison.
Scatterplot of cell-free DNA (cfDNA) concentrations in ng/μL from same patient-matched MSK-ACCESS (extracted by MagMAX protocol) and ctDx Lung (extracted by Qiagen and Kingfisher kits as indicated) samples. Least squares linear regression with slope and intercept are reported for the Qiagen and Kingfisher methods to approximate the MagMAX concentrations and shown as dotted lines.
Extended Data Fig. 10
Extended Data Fig. 10. Associations between previous statin and aspirin receipt and venous thromboembolism.
Aalen-Johansen curves from time of plasma draw to time of VTE with death as a competing risk. (Top) Patients with vs. without prior statin administration. (Bottom) Patients with vs. without prior aspirin administration. The number of patients at risk at each time point are shown below the graphs.

References

    1. Lyman, G. H., Eckert, L., Wang, Y., Wang, H. & Cohen, A. Venous thromboembolism risk in patients with cancer receiving chemotherapy: a real-world analysis. Oncologist18, 1321–1329 (2013). 10.1634/theoncologist.2013-0226 - DOI - PMC - PubMed
    1. Lyman, G. H., Culakova, E., Poniewierski, M. S. & Kuderer, N. M. Morbidity, mortality and costs associated with venous thromboembolism in hospitalized patients with cancer. Thromb. Res.164, S112–S118 (2018). 10.1016/j.thromres.2018.01.028 - DOI - PubMed
    1. Khorana, A. A., Francis, C. W., Culakova, E., Kuderer, N. M. & Lyman, G. H. Thromboembolism is a leading cause of death in cancer patients receiving outpatient chemotherapy. J. Thromb. Haemost.5, 632–634 (2007). 10.1111/j.1538-7836.2007.02374.x - DOI - PubMed
    1. Agnelli, G. et al. Semuloparin for thromboprophylaxis in patients receiving chemotherapy for cancer. N. Engl. J. Med.366, 601–609 (2012). 10.1056/NEJMoa1108898 - DOI - PubMed
    1. Agnelli, G. et al. Nadroparin for the prevention of thromboembolic events in ambulatory patients with metastatic or locally advanced solid cancer receiving chemotherapy: a randomised, placebo-controlled, double-blind study. Lancet Oncol.10, 943–949 (2009). 10.1016/S1470-2045(09)70232-3 - DOI - PubMed

MeSH terms

LinkOut - more resources