. 2024 Aug 16;40(1):71.
doi: 10.1007/s10565-024-09901-5.

Cocaine-derived hippuric acid activates mtDNA-STING signaling in alcoholic liver disease: Implications for alcohol and cocaine co-abuse

Affiliations

Cocaine-derived hippuric acid activates mtDNA-STING signaling in alcoholic liver disease: Implications for alcohol and cocaine co-abuse

Hwan Ma et al. Cell Biol Toxicol. .

Abstract

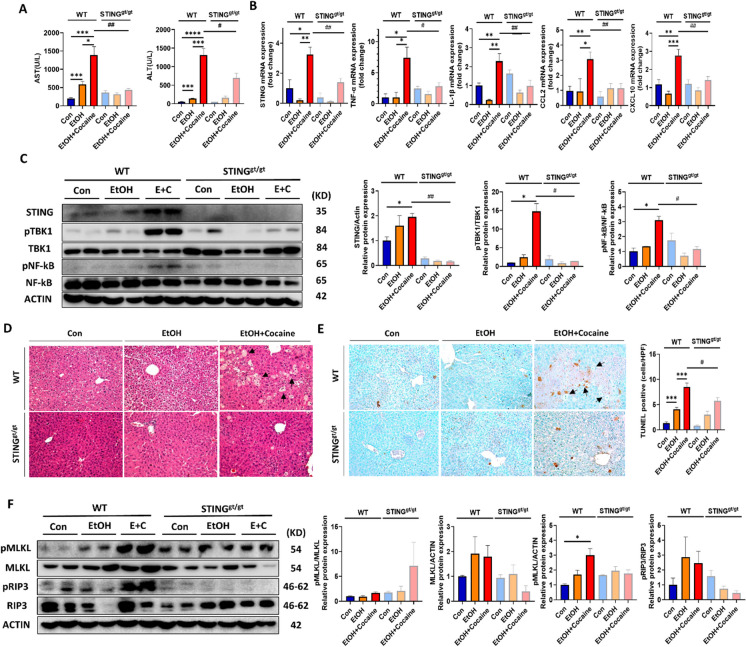
The simultaneous abuse of alcohol-cocaine is known to cause stronger and more unpredictable cellular damage in the liver, heart, and brain. However, the mechanistic crosstalk between cocaine and alcohol in liver injury remains unclear. The findings revealed cocaine-induced liver injury and inflammation in both marmosets and mice. Of note, co-administration of cocaine and ethanol in mice causes more severe liver damage than individual treatment. The metabolomic analysis confirmed that hippuric acid (HA) is the most abundant metabolite in marmoset serum after cocaine consumption and that is formed in primary marmoset hepatocytes. HA, a metabolite of cocaine, increases mitochondrial DNA leakage and subsequently increases the production of proinflammatory factors via STING signaling in Kupffer cells (KCs). In addition, conditioned media of cocaine-treated KC induced hepatocellular necrosis via alcohol-induced TNFR1. Finally, disruption of STING signaling in vivo ameliorated co-administration of alcohol- and cocaine-induced liver damage and inflammation. These findings postulate intervention of HA-STING-TNFR1 axis as a novel strategy for treatment of alcohol- and cocaine-induced excessive liver damage.

Keywords: Cocaine; Hippuric acid; Liver disease; Mitochondrial DNA leakage; STING; TNFR1.


Conflict of interest statement

The authors declare no competing interests.

The authors declare that they have no competing financial interests or personal relationships that could have appeared to influence the work reported in this paper.

Figures

Fig. 1
Fig. 1
Cocaine leads to liver damage and inflammation in marmosets. Cocaine (10 mg/kg) was administered intraperitoneally to the marmosets for four weeks until the animals were sacrificed. (A) Body weight changes were measured weekly; n = 3, Con group; n = 3, Cocaine group. (B) Serum ALP, LIPA, and AMY levels; n = 3, Con group; n = 3, Cocaine group. (C) IL-1β and TNF-α mRNA levels in liver tissue. mRNA levels were measured using qRT-PCR and expressed as fold change compared to control marmosets. Relative mRNA expression of target genes was normalized to that of marmoset GAPDH; n = 3, Con group; n = 3, Cocaine group. Representative images of liver pathology with (D) H&E and (E) TUNEL staining were acquired at 200x. (F) HA metabolite concentrations measured using HPLC of subsamples from marmoset hepatocytes supernatant treated with various concentrations (31.25, 62.5, and 125 µM) of Cocaine for 24 h; n = 3 per group. (G) Metabolomics analysis of marmoset serum was performed using an Agilent 1290 infinity UHPLC system; n = 6 per group. These show the relative content of various classes of metabolites. (H) Schematic of cocaine metabolism. Data are presented as mean SEM. * p < 0.05, ** p < 0.01, *** p < 0.001, **** p < 0.0001
Fig. 2
Fig. 2
Cocaine and ethanol induce hepatocyte death and liver inflammation in mice. Mouse (n = 28) were divided into four groups. EtOH group was fed an ethanol diet for 10 days and the Cocaine group were intraperitoneally administered cocaine (20 mg/kg) along with an ethanol diet for 10 days; n = 7, Con group; n = 7, EtOH group; n = 8, Cocaine group; n = 6, EtOH + Cocaine group. (A) Body weight and (B) liver weight changes were measured daily for 10 days; n = 7, Con group; n = 7, EtOH group; n = 8, Cocaine group; n = 6, EtOH + Cocaine group. (C) Serum AST and ALT levels; n = 7, Con group; n = 7, EtOH group; n = 8, Cocaine group; n = 6, EtOH + Cocaine group. (D) mRNA levels of IL-1β, IL-6, TNF-α, CCL2, CCL3, and CXCL10 in liver tissue were measured using qRT-PCR. Relative mRNA expression levels of target genes were normalized to that of mouse Gapdh; n = 7, Con group; n = 7, EtOH group; n = 8, Cocaine group; n = 6, EtOH + Cocaine group. Hepatic histopathological analysis was performed using (E) H&E staining and (F and G) TUNEL staining; n = 6 per group. Representative images were acquired at 200x magnification. (H) Cocaine (20 mg/kg) was administered intraperitoneally to the mice for 10 days. Serum was drawn, diluted 10 times with water, and analyzed by p-Toluenesulfonyl chloride colorimetric assay; n = 7, Con group; n = 7, EtOH group; n = 8, Cocaine group; n = 6, EtOH + Cocaine group. Data are presented as mean ± standard error of the mean (SEM). * p < 0.05, ** p < 0.01, *** p < 0.001, **** p < 0.0001; # p < 0.05, ## p < 0.01, ### p < 0.001, #### p < 0.0001
Fig. 3
Fig. 3
Cocaine-derived HA and cocaine increase mitochondrial DNA leakage and subsequent inflammation in KCs. (A) HSP60, TOM40, TIM23, and ACTIN expression analyzed using western blot analysis. ImKC cells were treated with HA (250 µM) for 24 h; n = 3 per group. (B) MitoSOX was measured in ImKC cells after treatment with various concentrations (62.5, 125, and 250 µM) of HA for 24 h; n = 4 per group. (C) mtDNA copy number after HA stimulation (250 µM, 24 h) in ImKC cells assessed using RT-PCR; n = 4 per group. (D) ImKC cells were treated with HA (250 µM) for 24 h. Mitochondrial membrane potential was determined using JC-1 staining. The red: green fluorescence ratio was used to quantify the mitochondrial membrane potential; n = 4 per group. (E) TNF-α, IL-1β, CCL2, and CCL3 mRNA levels in ImKC cells. ImKC cells were treated with HA (250 µM) for 24 and 48 h. Relative mRNA expression of target genes was normalized to that of mouse Gapdh; n = 3 per group. (F) HSP60, TOM40, TIM23, and ACTIN expression analyzed using western blot analysis after treatment with cocaine; n = 3 per group. (G) MitoSOX was measured in ImKC cells after treatment with various concentrations (31.25, 62.5, and 250 µM) of cocaine for 24 h; n = 3 per group. (H) mtDNA copy number after cocaine stimulation (250 µM, 24 h) in ImKC cells assessed using RT-PCR; n = 3 per group. (I) ImKC cells were treated with cocaine (250 µM) for 24 h. Mitochondrial membrane potential was determined using JC-1 staining. The red: green fluorescence ratio was used to quantify the mitochondrial membrane potential; n = 3 per group. (J) TNF-α, IL-1β, CXCL10, IFN-α, and IFN-β were measured using qRT-PCR, and relative mRNA expression of target genes was normalized to that of mouse Gapdh; n = 4 per group. Data are presented as mean ± SEM. * p < 0.05, ** p < 0.01, *** p < 0.001, **** p < 0.0001
Fig. 4
Fig. 4
Cocaine-derived HA and cocaine promote mitochondrial damage and STING signaling. (A) STING, pTBK1, TBK1, pNF-κB, NF-κB, and ACTIN expression analyzed using western blot analysis. ImKC cells were treated with HA (250 µM) and C-176 (STING inhibitor; 750 nM) for 24 h; n = 3 per group. (B) mRNA expression of STING, cGAS, TNF-α, IL-1β, CCL2, and CCL3 in KC isolated from WT and STING-deficient mice. mRNA levels were measured using qRT-PCR and expressed as fold changes compared to that of the control. Relative mRNA expression of target genes was normalized to that of mouse Gapdh; n = 3 per group. (C) STING, pTBK1, TBK1, pNF-κB, NF-κB, and ACTIN expression analyzed using western blot analysis. ImKC cells were treated with Cocaine (250 µM) and C-176 (STING inhibitor; 750 nM) for 24 h; n = 3 per group. (D) ImKC cells were cultured for 24 h after treatment with cocaine (250 µM) and mito-TEMPO (50 µM, pre-treat 1 h). TNF-α, IL-1β, CCL2, and CCL3 were measured using qRT-PCR and relative mRNA expression levels of these genes were normalized to that of mouse Gapdh levels; n = 4 per group. (E) Cocaine (250 µM, 24 h)-induced expression of STING, TNF-α, IL-1β, CCL3, and CXCL10 in KC isolated from WT mice and STINGgt/gt mice measured using qRT-PCR. Relative mRNA expression levels of the target genes were normalized to that of mouse Gapdh levels; n = 4 per group. Data are presented as mean ± SEM. * p < 0.05, ** p < 0.01, *** p < 0.001, **** p < 0.0001; # p < 0.05, ## p < 0.01, ### p < 0.001, #### p < 0.0001
Fig. 5
Fig. 5
Cocaine-mediated TNF-α enhances hepatocyte necroptosis. (A) Protein levels of TNF-α and IL-1β after stimulation with cocaine in ImKC cells for 0, 3, 6, 12, and 24 h were determined using ELISA; n = 3 per group. (B) Primary hepatocytes were cultured for for 0, 3, 6, 12, and 24 h after treatment with KC-derived CM. Cytotoxicity was measured using lactate dehydrogenase (LDH) assay via microplate leader; n = 3 per group. (C and D) Western blotting was performed to evaluate the protein levels of caspase3, Bax, Bcl-2, and ACTIN; n = 2 per group. (E) RIP1 and RIP3 mRNA levels were measured using qRT-PCR. Relative mRNA expression levels of target genes were normalized to that of mouse Gapdh; n = 2 per group. (F) RIP3 and MLKL phosphorylation assessed using western blotting. Primary hepatocytes were cultured treatment with KC-derived CM for 0, 3, 6, 12, and 24 h after. (G) mRNA expression of TNFR1 measured using qRT-PCR in primary hepatocytes; n = 4 per group. (H) Primary hepatocytes were cultured for 24 h after treatment with KC-derived CM and transfected with TNFR1 siRNA and scrambled siRNA control. Cytotoxicity was measured using LDH assay via microplate leader; n = 3 per group. (I) Primary hepatocytes were cultured for 24 h after treatment with KC-derived CM and transfected with TNFR1 siRNA and scrambled siRNA control. RIP3 and MLKL phosphorylation assessed using western blotting; n = 2 per group. All data are presented as mean ± SEM. * p < 0.05, ** p < 0.01, *** p < 0.001, **** p < 0.0001. # p < 0.05, ## p < 0.01, ### p < 0.001, #### p < 0.0001
Fig. 6
Fig. 6
Alcohol increases TNFR-1 expression in hepatocytes and enhances susceptibility to cocaine-mediated hepatic necroptosis. Primary hepatocytes were treated with cocaine-treated KC-derived CM in the presence of ethanol (50 µM) and then cultured for 24 h. (A) Cytotoxicity was measured using LDH assay; n = 3 per group. (B) mRNA expression of RIP3 was measured using qRT-PCR. Relative mRNA expression of target genes was normalized to that of mouse Gapdh; n = 5 per group (C) Western blotting was performed to evaluate the phosphorylation of MLKL; n = 2 per group (D) Primary hepatocytes were cultured for 24 h in the presence of ethanol (50 µM). The level of mRNA of TNFR1 was measured using qRT-PCR. Relative mRNA expression level of Tnfr1 was normalized to that of mouse Gapdh; n = 3 per group. (E) Primary hepatocytes were transfected with TNFR1 siRNA and scrambled siRNA (negative control). Cytotoxicity was assessed by measuring LDH levels; n = 3 per group (F and G) Western blot was performed to evaluate the phosphorylation of RIP3 and MLKL; n = 3 per group. All data are presented as mean ± SEM. * p < 0.05, ** p < 0.01, *** p < 0.001, **** p < 0.0001. # p < 0.05, ## p < 0.01, ### p < 0.001, #### p < 0.0001
Fig. 7
Fig. 7
STING regulates cocaine and alcohol-induced liver injury and inflammation. WT (n = 17) and STINGgt/gt (n = 17) mice were divided into three groups: Control (Con, n = 5), Ethanol (EtOH, n = 5), and Ethanol + Cocaine (EtOH + Cocaine, n = 7). The Ethanol and Ethanol + Cocaine groups were fed an ethanol diet for 10 days. Additionally, these mice were administered a single dose of ethanol (5 g/kg body weight). The Ethanol + Cocaine group was also intraperitoneally administered cocaine (20 mg/kg) along with the ethanol diet for 10 days. Additionally, these mice were administered a single dose of ethanol (5 g/kg body weight). (A) Serum AST and ALT levels (B) mRNA levels of STING, TNF-α, IL-1β, CCL2, and CXCL10 in liver tissue were measured using qRT-PCR. Relative mRNA expression levels of target genes were normalized to that of mouse Gapdh (C) TBK1, pTBK1, NF-κB, pNF-κB, and STING in the liver tissue analyzed using western blotting; n = 2 per group. Hepatic histopathological analysis was performed using (D) H&E staining and (E) TUNEL staining Representative images were acquired at 200x magnification. (F) RIP3 and MLKL phosphorylation in liver tissue assessed using western blotting; n = 2 per group. All data are presented as mean ± SEM. * p < 0.05, ** p < 0.01, *** p < 0.001, **** p < 0.0001. # p < 0.05, ## p < 0.01, ### p < 0.001, #### p < 0.0001
Fig. 8
Fig. 8
Graphical summary of the promotion and mechanisms of cocaine-mediated alcohol-induced liver injury and inflammation through HA-dependent activation of STING and TNFR1

References

    1. Abe T, Barber GN. Cytosolic-DNA-mediated, STING-dependent proinflammatory gene induction necessitates canonical NF-kappaB activation through TBK1. J Virol. 2014;88:5328–41. 10.1128/JVI.00037-14. - PMC - PubMed
    1. Amoedo ML, Craver L, Marco MP, Fernandez E. Cocaine-induced acute renal failure without rhabdomyolysis. Nephrol Dial Transplant. 1999;14:2970–1. 10.1093/ndt/14.12.2970. - PubMed
    1. An L, Wang X, Cederbaum AI. Cytokines in alcoholic liver disease. Arch Toxicol. 2012;86:1337–48. 10.1007/s00204-012-0814-6. - PubMed
    1. Bailey DN. Plasma cocaethylene concentrations in patients treated in the emergency room or trauma unit. Am J Clin Pathol. 1993;99:123–7. 10.1093/ajcp/99.2.123. - PubMed
    1. Barber GN. STING: infection, inflammation and cancer. Nat Rev Immunol. 2015;15:760–70. 10.1038/nri3921. - PMC - PubMed

Publication types

MeSH terms

Grants and funding

LinkOut - more resources