. 2024 Sep;6(9):1756-1774.
doi: 10.1038/s42255-024-01110-y. Epub 2024 Aug 15.

LIFR regulates cholesterol-driven bidirectional hepatocyte-neutrophil cross-talk to promote liver regeneration

Affiliations

LIFR regulates cholesterol-driven bidirectional hepatocyte-neutrophil cross-talk to promote liver regeneration

Yalan Deng et al. Nat Metab. 2024 Sep.

Abstract

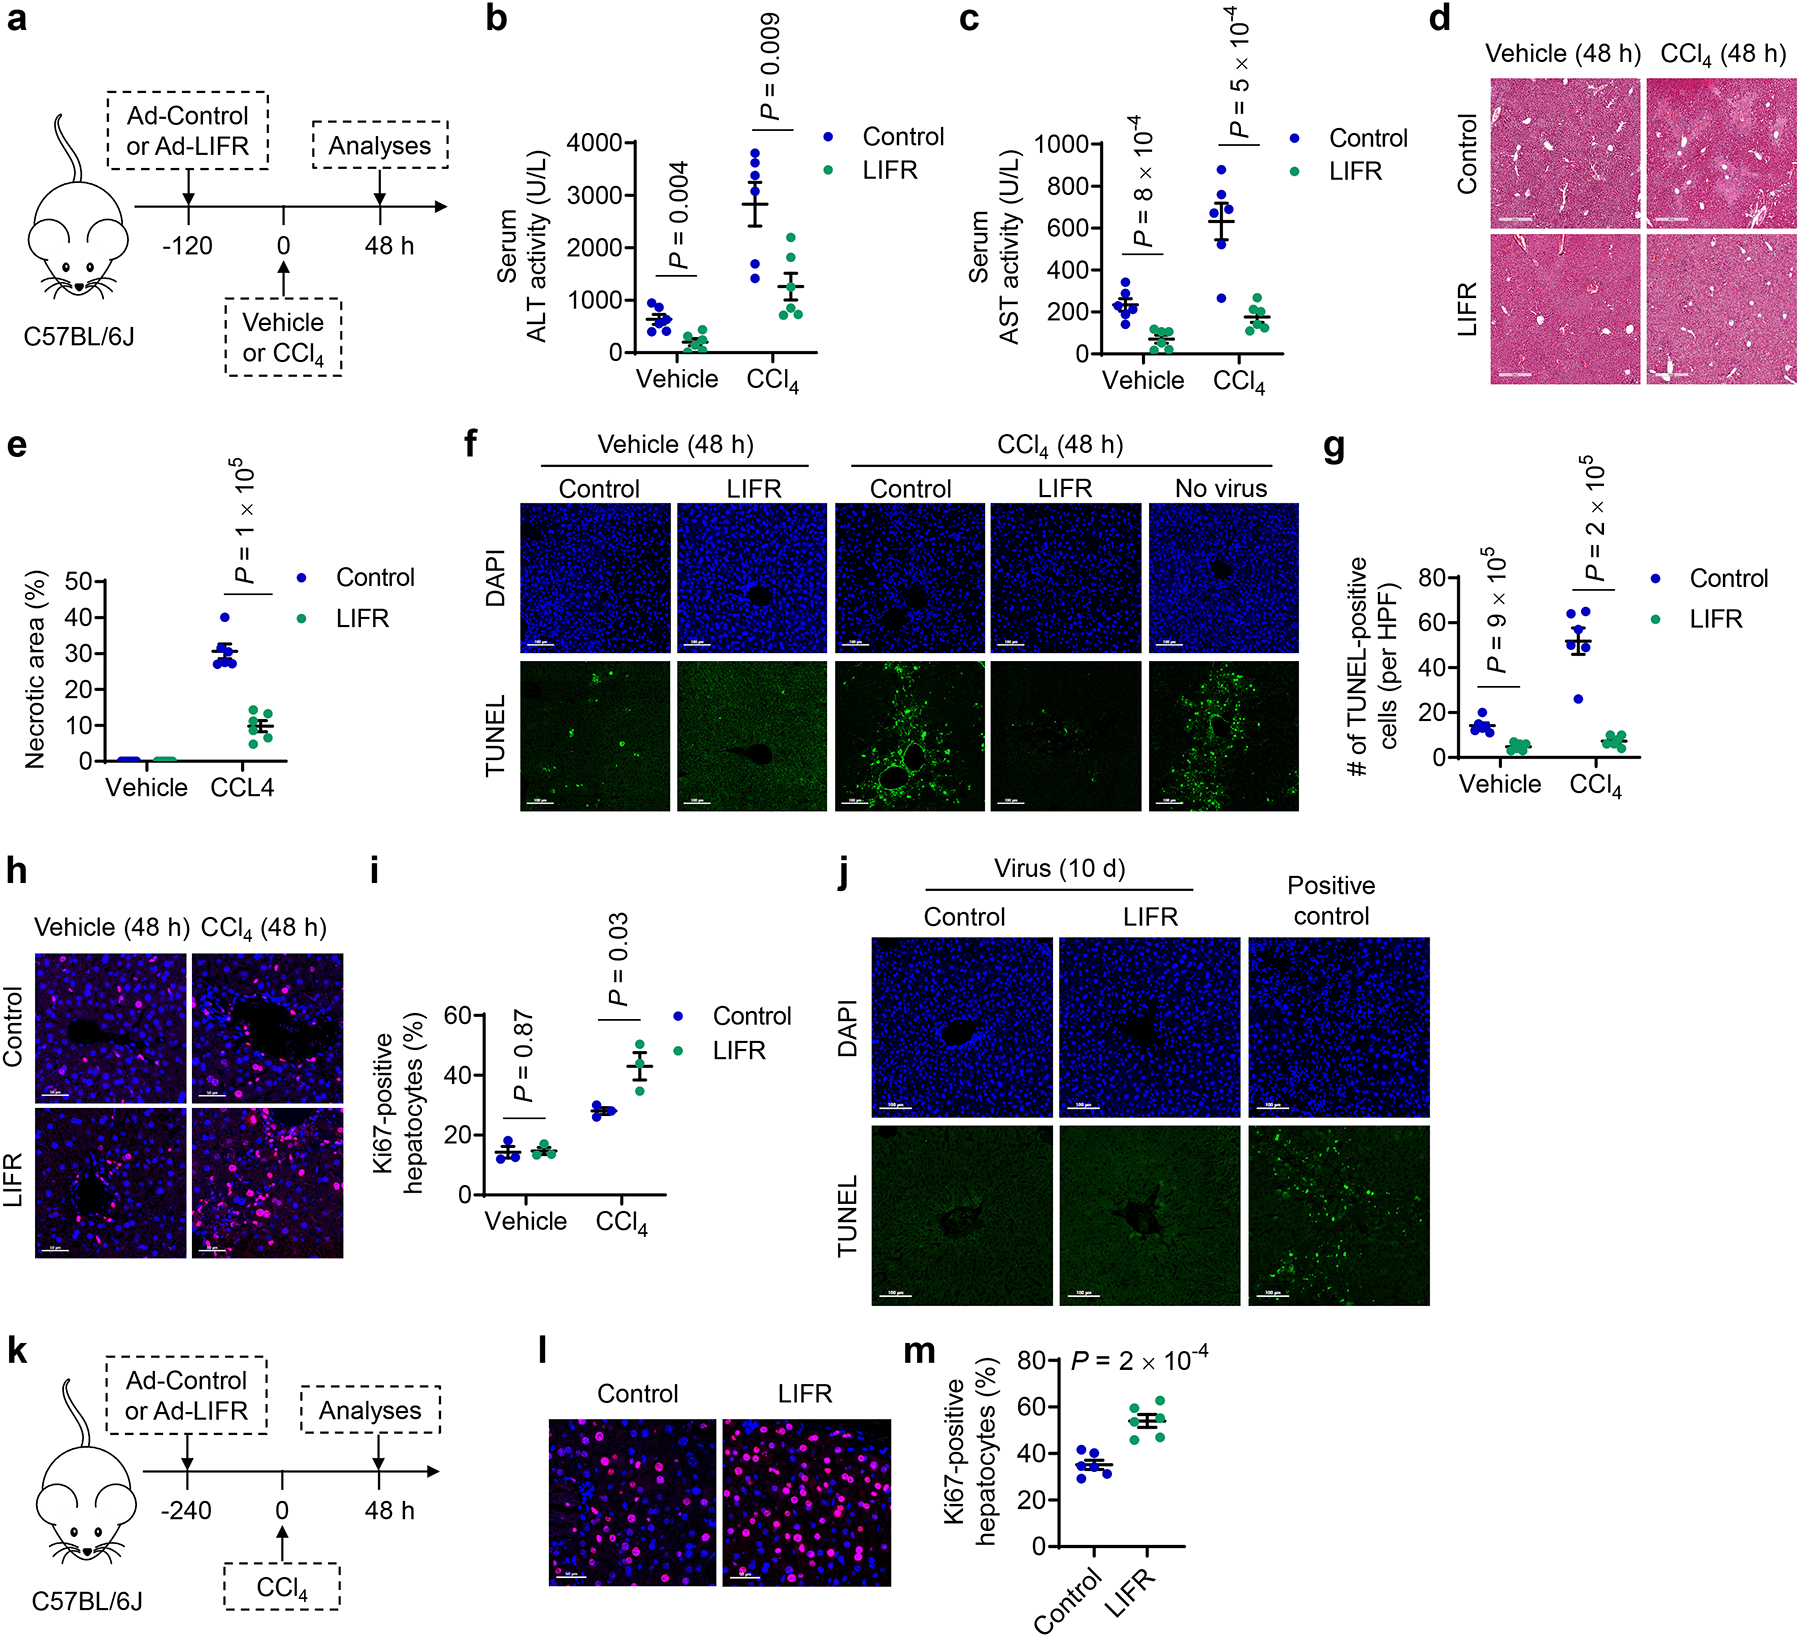
Liver regeneration is under metabolic and immune regulation. Despite increasing recognition of the involvement of neutrophils in regeneration, it is unclear how the liver signals to the bone marrow to release neutrophils after injury and how reparative neutrophils signal to hepatocytes to reenter the cell cycle. Here we report that loss of the liver tumour suppressor Lifr in mouse hepatocytes impairs, whereas overexpression of leukaemia inhibitory factor receptor (LIFR) promotes liver repair and regeneration after partial hepatectomy or toxic injury. In response to physical or chemical damage to the liver, LIFR from hepatocytes promotes the secretion of cholesterol and CXCL1 in a STAT3-dependent manner, leading to the efflux of bone marrow neutrophils to the circulation and damaged liver. Cholesterol, via its receptor ERRα, stimulates neutrophils to secrete hepatocyte growth factor to accelerate hepatocyte proliferation. Altogether, our findings reveal a LIFR-STAT3-CXCL1-CXCR2 axis and a LIFR-STAT3-cholesterol-ERRα-hepatocyte growth factor axis that form bidirectional hepatocyte-neutrophil cross-talk to repair and regenerate the liver.


Conflict of interest statement

H.Z. consults for Flagship Pioneering, Alnylam Pharmaceuticals, Jumble Therapeutics, and Chroma Medicines, and serves on the SAB of Ubiquitix. H.Z. has research support from Chroma Medicines. H.Z. owns stock in Ionis and Madrigal Pharmaceuticals. M.A.C. reports grants, personal fees, and an ownership interest in ImmunoGenesis, Inc. and personal fees from AstraZeneca, Inc. The above interests are not directly related to the contents of this paper. The other authors declare no competing interests.

Figures

Extended Data Figure 1.
Extended Data Figure 1.. Loss of Lifr in hepatocytes impairs liver injury repair and injury-induced upregulation of proliferative genes.
a. Immunoblotting of Lifr, cyclin D1, cyclin A2, and Gapdh in mouse livers at different time points after 2/3 partial hepatectomy (PHx). b. qPCR of mRNA of Lifr, cyclin D1, cyclin A2, cyclin B1, and cyclin E1 in the livers of Lifrfl/fl and Lifrfl/fl;Alb-Cre mice at 72 hours after PHx. n = 6, 5, 6, and 6 mice. c. Immunoblotting of Lifr, cyclin D1, and Gapdh in the livers of Lifrfl/fl and Lifrfl/fl;Alb-Cre mice at 72 hours after PHx. d, e. TUNEL staining (d) and the number of TUNEL-positive hepatocytes per high-power field (HPF; e) at 72 hours after CCl4 treatment. Scale bars, 50 μm. n = 4 mice. f. qPCR of mRNA of cyclin D1, cyclin A2, and Pcna in the livers of Lifrfl/fl and Lifrfl/fl;Alb-Cre mice at 48 and 72 hours after CCl4 treatment. n = 7, 7, 4, 4, 6, 6, 8, and 8 mice. g, h. Serum ALT (g) and AST (h) levels in Lifrfl/fl and Lifrfl/fl;Alb-Cre mice at 6 and 12 hours after CCl4 treatment. n = 8, 6, 6, 7, 6, and 8 mice. i. Immunoblotting of Cyp2e1 and Gapdh in mouse livers at 6 and 12 hours after CCl4 treatment. Representative results from one of three independent experiments are shown. Statistical significance in b and e-h was determined by a two-tailed unpaired t-test. Error bars are s.e.m.
Extended Data Figure 2.
Extended Data Figure 2.. Overexpression of LIFR promotes liver injury repair and regeneration.
a-i. C57BL/6J mice received control or LIFR-expressing adenovirus 5 days before CCl4 or vehicle treatment. Analyses were done at 48 hours after treatment. a. Experimental design. b, c. Serum ALT (b) and AST (c) levels in mice after CCl4 or vehicle treatment. n = 6 mice. d, e. H&E staining (d) and percentage of necrotic areas (e) in mouse livers after CCl4 or vehicle treatment. Scale bars, 500 μm. n = 6 mice. f, g. DAPI and TUNEL staining (f) and the number of TUNEL-positive hepatocytes per high-power field (HPF; g) in mouse livers after CCl4 or vehicle treatment. Scale bars, 100 μm. n = 6 mice. h, i. Immunofluorescence staining of Ki67 (h; overlay with DAPI staining) and percentage of Ki67-positive hepatocytes (i) in mouse livers after CCl4 or vehicle treatment. Scale bars, 50 μm. n = 3 mice. j. DAPI and TUNEL staining of mouse livers 10 days after injection of control or LIFR-expressing adenovirus. Scale bars, 100 μm. Representative results from one of three independent experiments are shown. k-m. C57BL/6J mice received control or LIFR-expressing adenovirus 10 days before CCl4 treatment. Analyses were done at 48 hours after treatment. k. Experimental design. l, m. Immunofluorescence staining of Ki67 (l; overlay with DAPI staining) and percentage of Ki67-positive hepatocytes (m) after CCl4 treatment. Scale bars, 50 μm. n = 6 mice. Statistical significance in b, c, e, g, i, and m was determined by a two-tailed unpaired t-test. Error bars are s.e.m.
Extended Data Figure 3.
Extended Data Figure 3.. LIFR deficiency or overexpression does not affect hepatocyte proliferation ex vivo or in vitro.
a-e. Primary hepatocytes isolated from Lifrfl/fl and Lifrfl/fl;Alb-Cre mice were cultured for 3 hours, followed by treatment with 100 ng/mL of Hgf and/or 20 ng/mL of Egf for 48 hours. a-c. qPCR of mRNA of Lifr (a), cyclin D1 (b), and Pcna (c) in Hgf- and/or Egf-treated hepatocytes. n = 4, 4, 5, 5, 5, 5, 4, and 4 biological replicates. d, e. Immunofluorescence staining of Ki67 (d; overlay with DAPI staining) and percentage of Ki67-positive cells (e) in Hgf- and/or Egf-treated hepatocytes. Scale bars, 100 μm. n = 4 biological replicates. f-j. Primary hepatocytes isolated from C57BL/6J mice 10 days after injection with control adenovirus or LIFR-expressing adenovirus were cultured for 3 hours, followed by treatment with 100 ng/mL of Hgf and/or 20 ng/mL of Egf for 48 hours. f-h. qPCR of mRNA of Lifr (f), cyclin D1 (g), and Pcna (h) in Hgf- and/or Egf-treated hepatocytes. n = 5, 5, 4, 4, 4, 4, 5, and 5 biological replicates. i, j. Immunofluorescence staining of Ki67 (i; overlay with DAPI staining) and percentage of Ki67-positive cells (j) in Hgf- and/or Egf-treated hepatocytes. Scale bars, 100 μm. n = 5 biological replicates. k-m. qPCR of mRNA of Lifr (k), cyclin D1 (l), and Pcna (m) in Hgf- and/or Egf-treated hepatocytes isolated from C57BL/6J mice. The cells were infected with control adenovirus or LIFR-expressing adenovirus for 24 hours before Hgf and/or Egf treatment. n = 5, 5, 4, 4, 4, 4, 5, and 5 biological replicates. Statistical significance in a-c, e-h, and j-m was determined by a two-tailed unpaired t-test. Error bars are s.e.m.
Extended Data Figure 4.
Extended Data Figure 4.. Effects of LIFR on neutrophil recruitment after liver injury.
a, b. Quantification of liver-infiltrating immune cell populations in Lifrfl/fl and Lifrfl/fl;Alb-Cre mice 72 hours after PHx (a; n = 5 and 4 mice) or CCl4 treatment (b; n = 4 mice). NK: natural killer cells. KC: Kupffer cells. MoMa: monocyte-derived macrophages. PMN: polymorphonuclear neutrophils. DC: dendritic cells. c. Immunohistochemical staining of neutrophil elastase (NE) in the livers of Lifrfl/fl mice at 72 hours after PHx. Scale bars, 200 μm (top left) and 50 μm (top right and bottom). Representative results from one of three independent experiments are shown. d. Number of CD45+ cells per gram of liver in Lifrfl/fl and Lifrfl/fl;Alb-Cre mice at 72 hours after PHx. n = 4 and 5 mice. e-g. C57BL/6J mice received control or LIFR-expressing adenovirus 10 days before CCl4 treatment. Analyses were done at 48 hours after CCl4 treatment. e. Experimental design. f, g. Flow cytometry plots and percentage of neutrophils in liver (e) and blood (f) CD45+ cells from mice at 48 hours after CCl4 treatment. n = 6 and 5 mice. Statistical significance in a, b, d, f, and g was determined by a two-tailed unpaired t-test. Error bars are s.e.m.
Extended Data Figure 5.
Extended Data Figure 5.. The neutrophils from Lifrfl/fl;Alb-Cre mice have a lower ability to promote hepatocyte proliferation.
a. Immunofluorescence staining of neutrophil elastase (NE, green) and Hgf (red) on liver sections from Lifrfl/fl and Lifrfl/fl;Alb-Cre mice at 72 hours after PHx. Scale bars, 100 μm. Representative results from one of three independent experiments are shown. b. Immunofluorescence staining of Ki67 (overlay with DAPI staining) and percentage of Ki67-positive cells in primary mouse hepatocytes cultured for 48 hours with the conditioned medium of liver-infiltrating neutrophils purified from Lifrfl/fl and Lifrfl/fl;Alb-Cre mice at 72 hours after PHx. Scale bars, 100 μm. n = 5 biological replicates. c. Immunofluorescence staining of Ki67 (overlay with DAPI staining) and percentage of Ki67-positive cells in primary mouse hepatocytes cultured for 48 hours with the conditioned medium of blood neutrophils purified from Lifrfl/fl and Lifrfl/fl;Alb-Cre mice at 72 hours after PHx. Scale bars, 100 μm. n = 5 biological replicates. d. Immunoblotting of p-Met, Met, p-Erk, Erk, and Gapdh in the livers of Lifrfl/fl and Lifrfl/fl;Alb-Cre mice at 72 hours after PHx. Representative results from one of three independent experiments are shown. Statistical significance in b and c was determined by a two-tailed unpaired t-test. Error bars are s.e.m.
Extended Data Figure 6.
Extended Data Figure 6.. Knockdown of HGF in AdHL-60 cells.
a. Giemsa staining of HL-60 and all-trans retinoic acid (ATRA)-differentiated HL-60 (AdHL-60) cells. Scale bars, 50 μm. b. Flow cytometry plots of CD11b in HL-60 and AdHL-60 cells. c. Giemsa staining of control and HGF-knockdown HL-60 cells with or without ATRA-induced differentiation. Scale bars, 50 μm. d. Flow cytometry plots of CD11b in control and HGF-knockdown HL-60 cells with or without ATRA-induced differentiation. e. qPCR of HGF in control and HGF-knockdown AdHL-60 cells. n = 3 biological replicates. f. Flow cytometry plots and quantification of HGF in control and HGF-knockdown AdHL-60 cells. n = 3 biological replicates. Statistical significance in e and f was determined by a two-tailed unpaired t-test. Error bars are s.e.m.
Extended Data Figure 7.
Extended Data Figure 7.. LIFR accelerates CCl4-induced liver injury repair and regeneration in a neutrophil-dependent manner.
a-n. C57BL/6J mice received control or LIFR-expressing adenovirus 10 days before CCl4 treatment. Six hours after CCl4 treatment, the mice were treated with control IgG or anti-Ly6G. Analyses were done at 48 hours after CCl4 treatment. a. Experimental design. b, c. Flow cytometry plots (b) and percentage (c) of neutrophils in liver CD45+ cells. n = 5 mice. d, e. Flow cytometry plots (d) and percentage (e) of neutrophils in blood CD45+ cells. n = 5 mice. f, g. Flow cytometry plots (f) and percentage (g) of neutrophils in bone marrow (BM) CD45+ cells. n = 5 mice. h, i. Serum ALT (h) and AST (i) levels in control and LIFR-expressing adenovirus-infected C57BL/6J mice injected with control IgG or anti-Ly6G after CCl4 treatment. n = 5 mice. j, k. H&E staining (j) and percentage of necrotic areas (k). Scale bars, 300 μm. n = 5 mice. l, m. TUNEL staining (l) and the number of TUNEL-positive hepatocytes per high-power field (HPF; m). Scale bars, 100 μm. n = 5 mice. n, o. Immunohistochemical staining of Ki67 (n) and percentage of Ki67-positive hepatocytes (o). Scale bars, 50 μm. n = 5 mice. Statistical significance in c, e, g, h, i, k, m, and o was determined by a two-tailed unpaired t-test. Error bars are s.e.m.
Extended Data Figure 8.
Extended Data Figure 8.. Loss of hepatic Lifr impairs neutrophil recruitment, neutrophilic Hgf production, and liver regeneration in female mice.
a. Experimental design for panels b-i. All mice used were females. b. Liver-to-body weight ratio of Lifrfl/fl and Lifrfl/fl;Alb-Cre mice at 72 hours after PHx. n = 6 mice. c. Immunofluorescence staining of Ki67 and percentage of Ki67-positive hepatocytes in the livers of Lifrfl/fl and Lifrfl/fl;Alb-Cre mice at 72 hours after PHx. LPF: low-power field; HPF: high-power field. Scale bars, 100 μm (left) and 20 μm (right). n = 6 mice. d, e. Flow cytometry plots (d) and percentage (e) of neutrophils in liver, blood, and bone marrow (BM) CD45+ cells from Lifrfl/fl and Lifrfl/fl;Alb-Cre mice at 72 hours after PHx. n = 5 mice. f. Serum cholesterol levels in Lifrfl/fl and Lifrfl/fl;Alb-Cre mice at 72 hours after PHx. n = 5 mice. g. Serum Hgf levels in Lifrfl/fl and Lifrfl/fl;Alb-Cre mice at 72 hours after PHx. n = 6 mice. h. Flow cytometry plots and quantification of Hgf in liver neutrophils from Lifrfl/fl and Lifrfl/fl;Alb-Cre mice at 72 hours after PHx. n = 5 mice. i. Flow cytometry plots and quantification of Hgf in blood neutrophils from Lifrfl/fl and Lifrfl/fl;Alb-Cre mice at 72 hours after PHx. n = 5 mice. Statistical significance in b, c, and e-i was determined by a two-tailed unpaired t-test. Error bars are s.e.m.
Extended Data Figure 9.
Extended Data Figure 9.. Cxcl1 facilitates the recruitment of neutrophils to the liver after hepatectomy.
a. Immunofluorescence staining of neutrophil elastase (NE, red), Cxcr2 (green), and Hgf (cyan) in blood neutrophils from wild-type mice at 72 hours after PHx. Scale bars, 5 μm. Representative results from one of three independent experiments are shown. b, c. Schematic of the experimental design (b): at 40 hours after PHx, CD45.2 mice were treated with isotype IgG or anti-Cxcl1. At 62 hours after PHx, CD45.1 neutrophils were adoptively transferred to the antibody-treated mice. The liver infiltration of CD45.1 neutrophils was analyzed at 4 hours after adoptive transfer (c). n = 6 mice. Statistical significance in c was determined by a two-tailed unpaired t-test. Error bars are s.e.m.
Extended Data Figure 10.
Extended Data Figure 10.. Model for LIFR-mediated regulation of neutrophil recruitment and cholesterol-driven hepatocyte-neutrophil crosstalk during liver injury repair and regeneration.
Figure created with BioRender.com.
Figure 1.
Figure 1.. Loss of Lifr in hepatocytes impairs liver regeneration.
a. Experimental design for panels b-i. b. Liver-to-body weight ratio of Lifrfl/fl and Lifrfl/fl;Alb-Cre mice at the indicated time points after 2/3 partial hepatectomy (PHx). n = 6, 6, 6, 6, 7, 6, 11, 6, 10, 6, 5, 6, 3, and 5 mice. c. Ratio of removed liver weight to body weight. n = 9 mice. d, e. Serum ALT (d) and AST (e) levels in Lifrfl/fl and Lifrfl/fl;Alb-Cre mice at 24, 48, and 72 hours after PHx. n = 5 mice. f, g. H&E staining (f) and percentage of mitotic hepatocytes (g; green arrows indicate mitotic nuclei) in the livers of Lifrfl/fl and Lifrfl/fl;Alb-Cre mice at 72 hours after PHx. Scale bars, 100 μm (upper) and 50 μm (lower). n = 6 mice. h, i. Immunohistochemical staining of Ki67 (h) and percentage of Ki67-positive hepatocytes (i) in the livers of Lifrfl/fl and Lifrfl/fl;Alb-Cre mice at 48 and 72 hours after PHx. Scale bars, 100 μm (upper) and 50 μm (lower). n = 6 mice. j. Experimental design for panels k-p. k, l. Serum ALT (k) and AST (l) levels in Lifrfl/fl and Lifrfl/fl;Alb-Cre mice at 24, 48, and 72 hours after CCl4 treatment. n = 5 mice. m, n. H&E staining (m) and percentage of necrotic areas (n) in the livers of Lifrfl/fl and Lifrfl/fl;Alb-Cre mice at 72 hours after CCl4 treatment. Scale bars, 100 μm (upper) and 50 μm (lower). n = 7 and 5 mice. o, p. Immunohistochemical staining of Ki67 (o) and percentage of Ki67-positive hepatocytes (p) in the livers of Lifrfl/fl and Lifrfl/fl;Alb-Cre mice at 72 hours after CCl4 treatment. Scale bars, 50 μm. n = 6, 5, 7, and 5 mice. Statistical significance in b-e, g, i, k, l, n, and p was determined by a two-tailed unpaired t-test. Error bars are s.e.m. LPF: low-power field; HPF: high-power field.
Figure 2.
Figure 2.. Hepatocytic Lifr promotes neutrophil recruitment in liver regeneration models.
a, b. CyTOF-based immune profiling of the livers (a) and quantification of liver-infiltrating PMNs (b) in Lifrfl/fl and Lifrfl/fl;Alb-Cre mice at 72 hours after PHx. n = 5 and 4 mice. NK: natural killer cells. KC: Kupffer cells. MoMa: monocyte-derived macrophages. PMN: polymorphonuclear neutrophils. DC: dendritic cells. c, d. CyTOF-based immune profiling of the livers (c) and quantification of liver-infiltrating PMNs (d) in Lifrfl/fl and Lifrfl/fl;Alb-Cre mice at 72 hours after CCl4 treatment. n = 4 mice. e-h. Immunofluorescence staining of Ly6G (green) and Ki67 (red) on liver sections (e), the number of neutrophils per high-power field (HPF; f), percentage of Ki67-positive hepatocytes (g), and correlation between hepatic neutrophil abundance and Ki67-positive hepatocyte abundance (h) at 72 hours after PHx. Scale bars, 50 μm. n = 6 mice. Statistical significance in h was determined by a two-tailed Pearson correlation test. i. Number of PMNs per gram of liver in C57BL/6J mice at the indicated time points after PHx. n = 3, 3, 4, 7, 5, and 4 mice. j, k. Flow cytometry plots (j) and percentage of neutrophils (k) in liver, blood, and bone marrow (BM) CD45+ cells from Lifrfl/fl and Lifrfl/fl;Alb-Cre mice at 72 hours after PHx. n = 4 and 5 mice. l. Number of PMNs per gram of liver in the mice described in j. n = 4 and 5 mice. m, n. Flow cytometry plots (m) and percentage of neutrophils (n) in liver, blood, and bone marrow (BM) CD45+ cells from Lifrfl/fl and Lifrfl/fl;Alb-Cre mice at 48 hours after CCl4 treatment. n = 4 mice. Statistical significance in b, d, f, g, i, k, l, and n was determined by a two-tailed unpaired t-test. Error bars are s.e.m.
Figure 3.
Figure 3.. Hepatocytic Lifr promotes Hgf production through neutrophils.
a. Serum Hgf, Egf, Il-6, Tnf-α, and Tgf-β levels in Lifrfl/fl and Lifrfl/fl;Alb-Cre mice at 72 hours after PHx. n = 7, 7, 6, 6, 6, 6, 7, 7, 7, and 7 mice. b. Serum Hgf levels in Lifrfl/fl and Lifrfl/fl;Alb-Cre mice at 24, 48, and 72 hours after PHx. n = 5, 5, 6, 6, 5, 5, 5, and 5 mice. c. Serum Hgf, Egf, Il-6, Tnf-α, and Tgf-β levels in Lifrfl/fl and Lifrfl/fl;Alb-Cre mice at 72 hours after CCl4 treatment. n = 4, 4, 4, 4, 4, 4, 6, 6, 6, and 6 mice. d. Serum Hgf levels in Lifrfl/fl and Lifrfl/fl;Alb-Cre mice at 48 hours after CCl4 treatment. n = 5 mice. e. Serum Hgf levels 48 hours after PHx in control and LIFR-expressing adenovirus-infected C57BL/6J mice injected with control IgG or anti-Ly6G. Adenovirus was administered 10 days before PHx. n = 6 mice. f, g. Flow cytometry analysis of neutrophils purified from mouse liver (f) and blood (g). Image in g: Giemsa staining. h. ELISA of Hgf in the conditioned medium of liver-infiltrating neutrophils purified from Lifrfl/fl and Lifrfl/fl;Alb-Cre mice at 72 hours after PHx. n = 3 mice. i. ELISA of Hgf in the conditioned medium of blood neutrophils purified from Lifrfl/fl and Lifrfl/fl;Alb-Cre mice at 72 hours after PHx. n = 5 mice. j. Flow cytometry plots and quantification of Hgf in liver neutrophils from Lifrfl/fl and Lifrfl/fl;Alb-Cre mice at 72 hours after PHx. n = 5 and 6 mice. k. Flow cytometry plots and quantification of Hgf in blood neutrophils from Lifrfl/fl and Lifrfl/fl;Alb-Cre mice at 72 hours after PHx. n = 7 and 4 mice. l. Flow cytometry plots and quantification of Hgf in bone marrow (BM) neutrophils from Lifrfl/fl and Lifrfl/fl;Alb-Cre mice at 72 hours after PHx. n = 5 mice. Statistical significance in a-e and h-l was determined by a two-tailed unpaired t-test. Error bars are s.e.m.
Figure 4.
Figure 4.. LIFR upregulates hepatocyte-derived cholesterol, which acts on neutrophils to boost HGF production.
a-d. Lipidomic analysis of plasma samples from Lifrfl/fl (CTL) and Lifrfl/fl;Alb-Cre (LIFR_KO) mice at 72 hours after PHx. n = 3 mice. a. Principal Component Analysis plot. b. Heatmap of plasma cholesterol (Ch) and cholesterol ester (ChE) levels. c, d. Plasma cholesterol (c) and cholesterol ester (d) levels in Lifrfl/fl and Lifrfl/fl;Alb-Cre mice. n = 5 cholesterol species in c. n = 16 cholesterol ester species in d. e. Cholesterol levels in the serum of Lifrfl/fl and Lifrfl/fl;Alb-Cre mice at 24, 48, and 72 hours after PHx. n = 6, 5, 6, 7, 5, 5, 6, and 6 mice. f. Cholesterol levels in the conditioned medium of primary hepatocytes isolated from Lifrfl/fl and Lifrfl/fl;Alb-Cre mice. n = 4 biological replicates. g. Cholesterol levels in the serum of control and LIFR-expressing adenovirus-injected C57BL/6J mice at 48 hours after PHx. n = 6 and 7 mice. h. ELISA of HGF in the conditioned medium of control and HGF-knockdown all-trans retinoic acid (ATRA)-differentiated HL-60 (AdHL-60) cells with or without cholesterol treatment (Ch, 30 μM) for 5 hours. n = 3 biological replicates. i. Immunofluorescence staining of Ki67 (overlay with DAPI staining) and percentage of Ki67-positive cells in primary human hepatocytes cultured with the conditioned medium described in h for 48 hours. Scale bars, 50 μm. n = 3 biological replicates. Statistical significance in c-i was determined by a two-tailed unpaired t-test. Error bars are s.e.m.
Figure 5.
Figure 5.. Cholesterol promotes HGF transcription through ERRα in neutrophils.
a, b. qPCR of HGF (a) and flow cytometry plots and quantification of HGF (b) in all-trans retinoic acid (ATRA)-differentiated HL-60 (AdHL-60) cells with or without XCT790 (10 μM) treatment for 6 hours. n = 3. c, d. qPCR of HGF (c) and flow cytometry plots and quantification of HGF (d) in AdHL-60 cells treated with cholesterol (Ch, 30 μM) with or without XCT790 (10 μM) co-treatment for 5 hours. n = 3. e. ELISA of HGF in the conditioned medium of AdHL-60 cells treated with cholesterol (Ch, 30 μM) with or without XCT790 (10 μM) co-treatment for 5 hours. n = 3. f. Flow cytometry and Giemsa staining of neutrophils purified from human blood. Representative results from one of three independent experiments are shown. g, h. qPCR of HGF (g) and flow cytometry plots and quantification of HGF (h) in primary human neutrophils treated with cholesterol (Ch, 80 μM) with or without XCT790 (10 μM) co-treatment for 4 hours. n = 3. i. ELISA of HGF in the conditioned medium of purified human neutrophils treated with cholesterol (Ch, 80 μM) with or without XCT790 (10 μM) co-treatment for 4 hours. n = 6. j, k. Immunofluorescence staining of Ki67 (j; overlay with DAPI staining) and percentage (k) of Ki67-positive cells in primary human hepatocytes cultured with the conditioned medium described in i for 48 hours. Scale bars, 50 μm. n = 4, 4, and 3. l, m. Normalized luciferase activity of the reporter containing the human HGF promoter region in HEK293T cells transfected with ERRα with (l) or without (m) co-transfection with its coactivator PGC-1α. n = 4. n. JASPAR prediction of the ERRα-binding sequences on the human HGF promoter. o. ChIP-qPCR analysis showing the occupancy of human HGF promoter by ERRα. Endogenous ERRα was immunoprecipitated from human neutrophils treated with cholesterol (Ch, 80 μM) with or without XCT790 (10 μM) co-treatment for 4 hours. n = 3. Statistical significance in a-e, g-i, k-m, and o was determined by a two-tailed unpaired t-test. Error bars are s.e.m. All replicates are biological replicates.
Figure 6.
Figure 6.. LIFR accelerates partial hepatectomy-induced liver injury repair and regeneration in a neutrophil-dependent manner.
a-m. C57BL/6J mice received control or LIFR-expressing adenovirus 10 days before PHx. Six hours after PHx, the mice were treated with control IgG or anti-Ly6G. Analyses were done at 48 hours after treatment. a. Experimental design. b, c. Flow cytometry plots (b) and percentage (c) of neutrophils in liver CD45+ cells. n = 6 mice. d, e. Flow cytometry plots (d) and percentage (e) of neutrophils in blood CD45+ cells. n = 6 mice. f, g. Flow cytometry plots (f) and percentage (g) of neutrophils in bone marrow (BM) CD45+ cells. n = 6 mice. h-j. Liver-to-body weight ratio (h) and levels of serum ALT (i) and AST (j) in control and LIFR-expressing adenovirus-infected C57BL/6J mice injected with control IgG or anti-Ly6G after PHx. n = 6 mice. k, l. H&E staining (k) and percentage of mitotic hepatocytes (l). Green arrows indicate mitotic nuclei. Scale bars, 100 μm (upper) and 50 μm (lower). n = 5 mice. m, n. Immunofluorescence staining of Ki67 (m; overlay with DAPI) and percentage of Ki67-positive hepatocytes (n). Scale bars, 100 μm (left) and 20 μm (right). n = 5 mice. Statistical significance in c, e, g, h-j, l, and n was determined by a two-tailed unpaired t-test. Error bars are s.e.m. LPF: low-power field; HPF: high-power field.
Figure 7.
Figure 7.. Hepatocytic Lifr promotes neutrophil recruitment through Cxcl1.
a, b. qPCR of Cxcl1 in the livers (a) and serum Cxcl1 levels (b) in Lifrfl/fl and Lifrfl/fl;Alb-Cre mice at 72 hours after sham surgery or PHx. n = 6, 5, 6, and 6 mice. c, d. qPCR of Cxcl2 (c) and Cxcl5 (d) in the livers of Lifrfl/fl and Lifrfl/fl;Alb-Cre mice at 72 hours after sham surgery or PHx. n = 6, 5, 6, and 6 mice. e-g. qPCR of Cxcl1 (e), Cxcl2 (f), and Cxcl5 (g) in the livers of Lifrfl/fl and Lifrfl/fl;Alb-Cre mice at the indicated times after CCl4 treatment. n = 7, 7, 4, 4, 6, 6, 8, and 8 mice. h. qPCR of Cxcl1 in primary hepatocytes isolated from Lifrfl/fl and Lifrfl/fl;Alb-Cre mice. n = 4 biological replicates. i. ELISA of Cxcl1 in the conditioned medium of primary hepatocytes isolated from Lifrfl/fl and Lifrfl/fl;Alb-Cre mice. n = 5 biological replicates. j, k. qPCR of Cxcl1 in the livers (j) and serum Cxcl1 levels (k) in control and LIFR-expressing adenovirus-injected C57BL/6J mice at 48 hours after PHx. n = 6 mice. l-s. Lifrfl/fl and Lifrfl/fl; Alb-Cre mice underwent PHx and received SB225002 treatment for 4 days. l. Experimental design. Analyses were done at 72 hours after PHx. m. Liver-to-body weight ratio. n = 6 mice. n. Immunoblotting of Lifr, cyclin D1, and Gapdh in the livers. o. Serum Hgf levels. n = 6 mice. p-s. Flow cytometry plots (p) and quantification of neutrophils in liver (q), blood (r), and bone marrow (BM; s) CD45+ cells from Lifrfl/fl and Lifrfl/fl;Alb-Cre mice. n = 6 mice. Statistical significance in a-k, m, o, and q-s was determined by a two-tailed unpaired t-test. Error bars are s.e.m.
Figure 8.
Figure 8.. LIFR regulates CXCL1 and cholesterol levels through STAT3, and treatment with a STAT3 inhibitor reverses LIFR-accelerated liver regeneration.
a, b. Immunoblotting of Lifr, Stat3, p-Stat3, cyclin D1, and Gapdh in the livers of Lifrfl/fl and Lifrfl/fl;Alb-Cre mice (a) and of control and LIFR-expressing adenovirus-injected C57BL/6J mice (b) 48 hours after PHx. Representative results from one of three independent experiments are shown. c. Immunoblotting of Lifr, Stat3, p-Stat3, and Gapdh in primary hepatocytes isolated from C57BL/6J mice. Hepatocytes were infected with control or LIFR-expressing adenovirus for 24 hours and treated with 10 μM TTI-101 or vehicle for 72 hours. Representative results from one of three independent experiments are shown. d. qPCR of Cxcl1 in the hepatocytes described in c. n = 3 biological replicates. e, f. Levels of secreted Cxcl1 (e) and cholesterol (f) in the conditioned medium of the hepatocytes described in c. n = 3 biological replicates. g-n. C57BL/6J mice received control or LIFR-expressing adenovirus 10 days before PHx and were treated with TTI-101 or SB225002 for 3 days. Analyses were done at 48 hours after PHx. g. Experimental design. h. Liver-to-body weight ratio. n = 5 mice. i, j. Immunohistochemical staining of Ki67 of liver sections (i) and percentage of Ki67-positive hepatocytes (j). Scale bars, 50 μm. n = 5, 5, 5, and 4 mice. k-n. Flow cytometry plots (k) and quantification of neutrophils in liver (l), blood (m), and bone marrow (BM; n) CD45+ cells. n = 4 mice. Statistical significance in d-f, h, j, and l-n was determined by a two-tailed unpaired t-test. Error bars are s.e.m.

References

    1. Michalopoulos GK & Bhushan B Liver regeneration: biological and pathological mechanisms and implications. Nat Rev Gastroenterol Hepatol 18, 40–55 (2021). - PubMed
    1. Forbes SJ & Rosenthal N Preparing the ground for tissue regeneration: from mechanism to therapy. Nat Med 20, 857–869 (2014). - PubMed
    1. Thorgersen EB et al. The Role of Complement in Liver Injury, Regeneration, and Transplantation. Hepatology 70, 725–736 (2019). - PMC - PubMed
    1. Sakamoto Y et al. Favorable indications for hepatectomy in patients with liver metastasis from gastric cancer. J Surg Oncol 95, 534–539 (2007). - PubMed
    1. Li N & Hua J Immune cells in liver regeneration. Oncotarget 8, 3628–3639 (2017). - PMC - PubMed

Substances

LinkOut - more resources