. 2024 Aug 15;81(1):351.
doi: 10.1007/s00018-024-05322-z.

SARS-CoV2 infection in whole lung primarily targets macrophages that display subset-specific responses

Affiliations

SARS-CoV2 infection in whole lung primarily targets macrophages that display subset-specific responses

Thien-Phong Vu Manh et al. Cell Mol Life Sci. .

Abstract

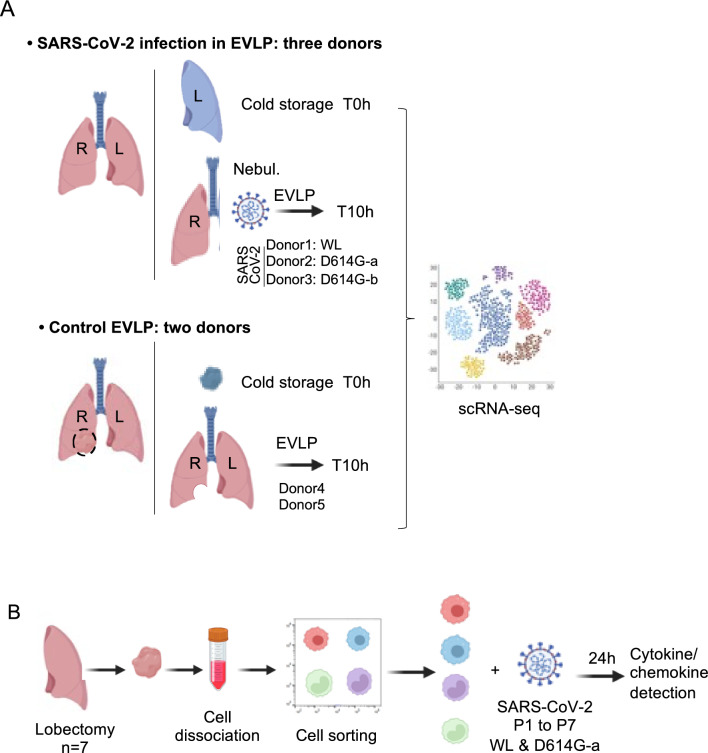
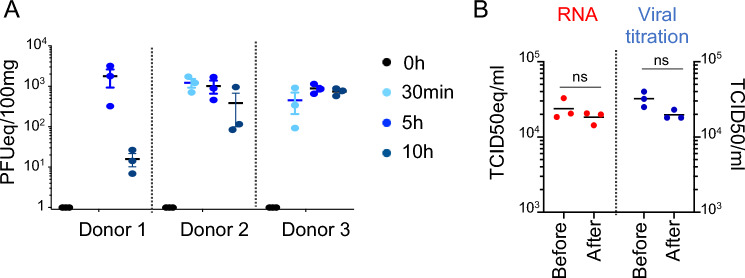
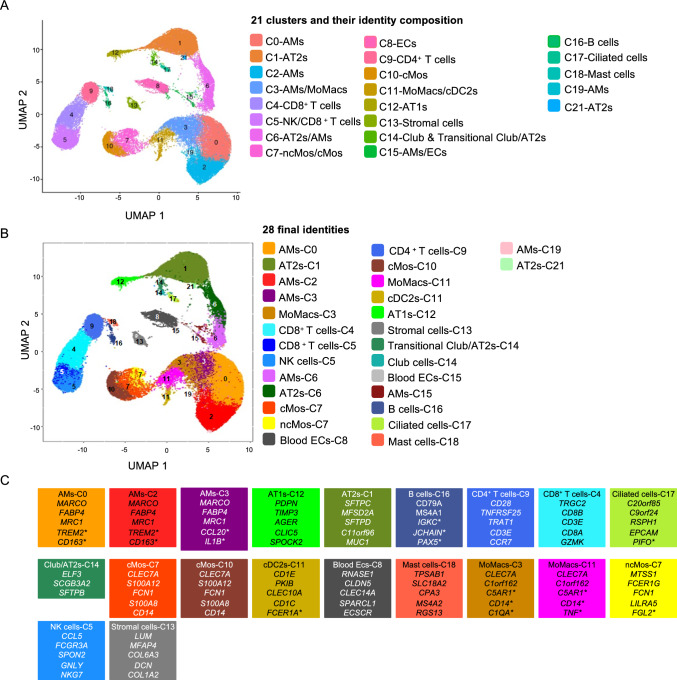
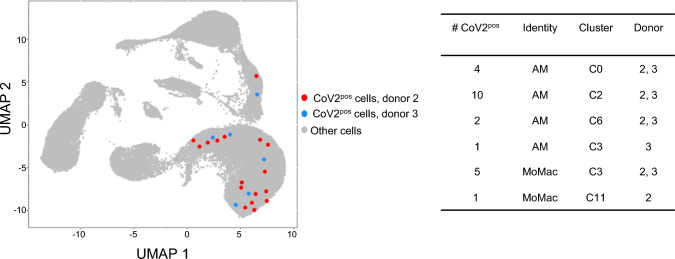
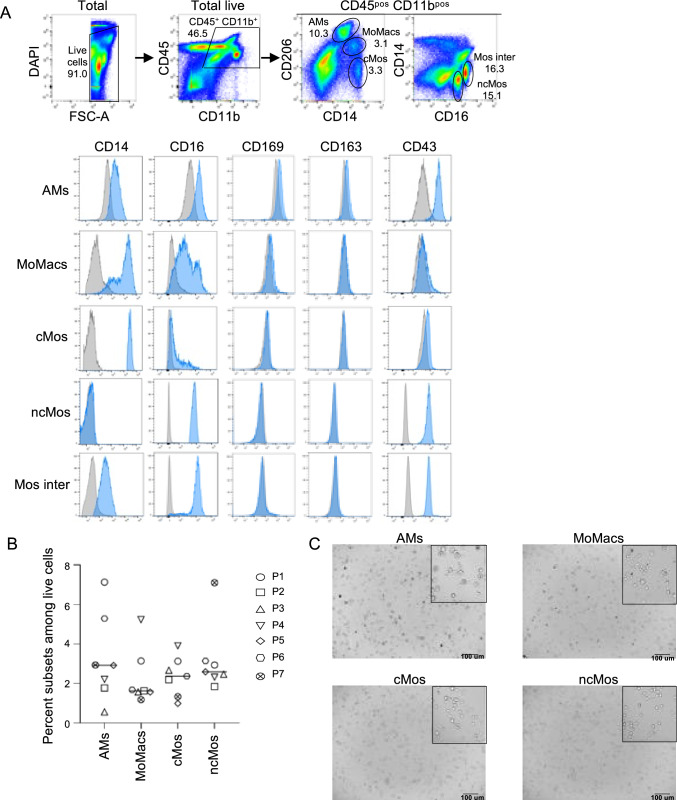
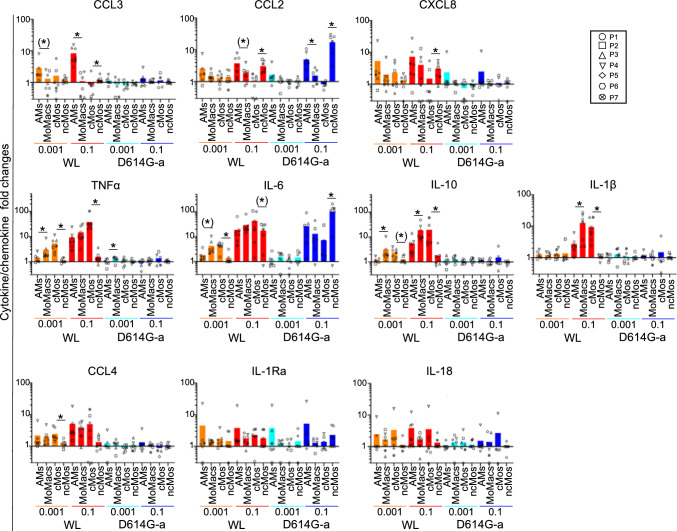
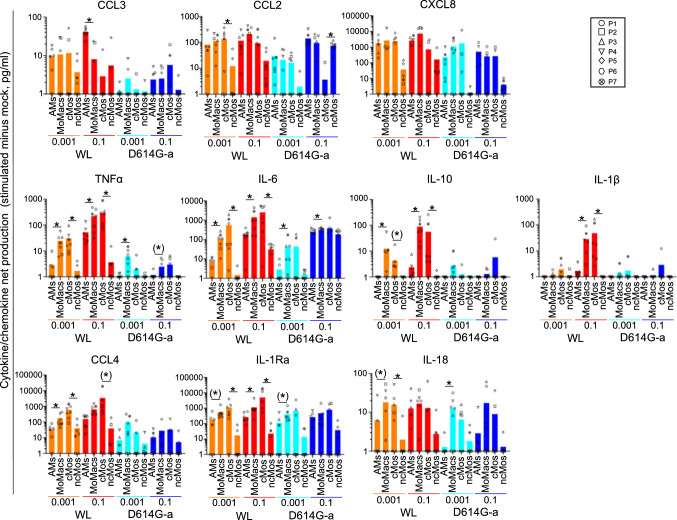
Deciphering the initial steps of SARS-CoV-2 infection, that influence COVID-19 outcomes, is challenging because animal models do not always reproduce human biological processes and in vitro systems do not recapitulate the histoarchitecture and cellular composition of respiratory tissues. To address this, we developed an innovative ex vivo model of whole human lung infection with SARS-CoV-2, leveraging a lung transplantation technique. Through single-cell RNA-seq, we identified that alveolar and monocyte-derived macrophages (AMs and MoMacs) were initial targets of the virus. Exposure of isolated lung AMs, MoMacs, classical monocytes and non-classical monocytes (ncMos) to SARS-CoV-2 variants revealed that while all subsets responded, MoMacs produced higher levels of inflammatory cytokines than AMs, and ncMos contributed the least. A Wuhan lineage appeared to be more potent than a D614G virus, in a dose-dependent manner. Amidst the ambiguity in the literature regarding the initial SARS-CoV-2 cell target, our study reveals that AMs and MoMacs are dominant primary entry points for the virus, and suggests that their responses may conduct subsequent injury, depending on their abundance, the viral strain and dose. Interfering on virus interaction with lung macrophages should be considered in prophylactic strategies.

Keywords: 10X genomics; Azimuth software; Ex vivo lung perfusion; Viral nebulization.


Conflict of interest statement

The authors declare no competing interests.

Figures

Fig. 1
Fig. 1
Experimental scheme. A The EVLP part of the study (see Methods). Three right lungs (Additional file 1-Anamnesis), processed to EVLP for 10 h, were infected with SARS-CoV-2 using a nebulizer at the onset of EVLP. Three different viruses were used: WL for donor 1 (1.2 × 108 PFUs), D614G-a for donor 2 (3.3 × 107 PFUs), D614G-b for donor 3 (107 PFUs). A lung biopsy from the left lung was taken at 0 h and placed in hypothermosol at 4 °C. Another lung biopsy was taken at 10 h. Two control lungs were processed to EVLP for 10 h and the sampling was performed similarly. Lung cells were isolated from the EVLP biopsies collected at 0 h and 10 h and subjected to scRNA-seq. In the case of donor 2 and 3, additional samples with HLA-DR-enriched cells were subjected to scRNA-seq. B The isolated lung monocyte/macrophage part of the study (see Methods). Lung tissue samples were obtained from seven patients undergoing surgical resection for lung carcinoma (Additional file 1-Anamnese). Lung cells were isolated, labelled with mAbs for monocyte/macrophage identification, and sorted with a CytoFLEX sorter. The 4 purified subsets (AM, MoMacs, cMos, ncMos) were exposed to SARS-CoV-2 WL or D614G-a virus at 0.1 and 0.001 MOI for 24 h and the supernatants were assayed for cytokine detection using a human ProcartaPlexTM Mix&Match 12-plex. Created with Biorender.com
Fig. 2
Fig. 2
Analysis of SARS-CoV2 viral exposure upon infection of whole lung maintained alive and functional by ex vivo perfusion and ventilation. A Detection of SARS-CoV-2 genome in different lung biopsies after nebulization. From donor 1, 2 and 3 lungs, independent lung biopsies (100 mg each, 3 per timing) were collected in RNAlater before nebulization (0 h) and 30 min, 5 h and 10 h after the end of the nebulization (20 min duration). The 30 min time point was not done in case of donor 1. SARS-CoV-2 E gene was detected in the tissue RNA using RT-qPCR run in parallel to a calibration curve established from a titrated WL viral preparation, and the results were expressed in PFU equivalents (PFUeq) reported to 100 mg of lung tissue. B Control of viral infectious potential upon nebulization. A WL viral preparation (106 PFU) was nebulized in 6.5 ml RPMI for 20 min in a collection tube in place of a lung. Three viral suspension samples were collected before the nebulization (Before) and 30 min after (After) the end of nebulization, viral RNA was extracted, subjected to RT-qPCR detection as described in A except that the results were expressed in TCID50eq/ml. In parallel, three other viral suspension samples (before and after) were titrated for their infectivity on Vero E6 cells and the results were expressed in TCID50/ml
Fig. 3
Fig. 3
Single cell RNA-seq analysis of lung samples undergoing EVLP upon SARS-CoV-2 nebulization and control conditions, and definition of cell identities. A Cells were isolated from 5 donor lungs subjected to EVLP, at 0 h (no EVLP) and at 10 h EVLP; 3 lungs were nebulized at the onset of EVLP with SARS-CoV-2 (donor 1 with WL, donor 2 with D614G-a, donor 3 with D614G-b) and 2 lung EVLPs were conducted without virus (control EVLP for donors 4 and 5), see Fig. 1, and Methods. Donor lung samples (14 samples total) were used for 10X genomics scRNA-seq and processed for high quality transcriptomes, integrated, clustered and submitted to cell annotation analysis with the Azimuth package. A grouping of “close cell subtypes" identified by Azimuth was done (see Methods). Cells with low annotation scores (< 0.6), under represented identities (< 10% per cluster in donor 1, 2 or 3), and identities in clusters not shared between donors 1, 2 and 3 were excluded (see Additional file 6. Cell identity determination). The filtered cells were projected onto the "integrated UMAP-filtered" shown in A, with 21 clusters (C0 to C21, with C20 removed due to mix/undefined cell composition). For each cluster, the cell identity composition assigned by Azimuth is indicated. B The final cell identities defined based on Azimuth and cluster belonging are projected on the UMAP. A total of 28 final identities were obtained. C Top markers expressed by the major final identities. The italic gene names are shared with the canonical markers of the similar identities of two resource papers [43, 44]. Top markers with a * are representative of a cell type or of a cell type function/activation state reported by others: TREM2 and CD163 [45], CCL20 and IL1B [12], IGKC, J chain and PAX5 [46], PIFO [47], FCER1A [48], C5AR1, CD14, C1QA and TNF [14], FGL2 [32]
Fig. 4
Fig. 4
SARS-CoV-2 RNA is dominantly associated with macrophages upon whole lung infection. The SARS-CoV-2-positive cells (23 after filtration) were projected on the UMAP and the association with identities and clusters is shown. The viral sequences associated to the cells are reported in Additional file 11. ViralReadSeq
Fig. 5
Fig. 5
Lung monocyte/macrophage subset characterization and sorting. A Gating strategy and expression of markers on lung monocyte/macrophage subsets (representative patient). Lung cells were isolated from lung biopsy obtained upon lobectomy, and stained with a combination of the following conjugated mAbs: anti-CD45-FITC, anti-CD11b-APC/Cy7, anti-CD206-APC, anti-CD14-PE, anti-CD16-Alexa700, anti-CD163-PerCp/Cy5.5, anti-CD169-BV605, anti-CD43-PerCp/Cy5.5. For each mAb, a labelled isotype-matched control was used and the specificity of the labeling was controlled using the fluorescence minus one method. Dead cells were excluded by DAPI staining. From the live CD45posCD11bpos cell gate, AMs were identified as CD206hiCD14lo cells, MoMacs as CD206intCD14hi cells, cMos as CD206negCD14hi cells, ncMos as CD16posCD14neg, and intermediate monocytes (Mos inter) as CD16posCD14pos cells. The staining intensity of the different subsets for CD14, CD16, CD169, CD163 and CD43 is shown in blue histograms overlaid on their respective isotype control histogram in grey. B The  percentage of AMs, MoMacs, cMos and ncMos is reported for 7 patients used for cell subset sorting. C Images of AMs, MoMacs, cMos and ncMos plated in 96-well plates were captured with a Zoe Cell Imager (× 20) and the areas marked with a black square correspond to higher magnification (× 60)
Fig. 6
Fig. 6
Cytokine/chemokine fold changes induced by SARS-CoV-2 in lung monocytes/macrophages, depending on viral doses, viral strains and cell subsets. The sorted lung AMs, MoMacs, cMos, ncMos (5 × 104, duplicates) from 7 patients were exposed to SARS-CoV-2 WL and D614G-a at 2 MOI, i.e. 0.1 and 0.001. The supernatants from mock cultures and viral exposed cultures were collected after 24 h and subjected to cytokine detection using Human ProcartaPlexTM Mix&Match 12-plex. The detection limit for each cytokine was established from the lowest calculated data by the BioPlex Manager software. For the different cytokines/chemokines, for each subset in each condition, a ratio between the stimulated and mock culture was calculated, Additional file 16. Means ± sd. The ratios were log transformed and analyzed with R. A Shapiro test was used to evaluate the normality of the data distribution in each group and timing. When the data did not pass the normality test, a non-parametric paired Wilcoxon test was used to compare the data between 2 groups. Alternatively, a paired t-test was used upon equal variance evaluation. The statistical results of paired comparisons are reported in Additional file 17 and 18. The p-values between the AMs and MoMacs and between the cMos and ncMos are reported on the figure, as * when < 0.05 and as (*) when comprised between 0.08 and 0.05. The cytokine result panels were grouped as follows: top lane with several AM values > MoMac values and ncMos values > cMo values, mid lane with AM values < MoMac values and ncMos values < cMos values, bottom lane without clear pattern
Fig. 7
Fig. 7
Cytokine/chemokine net production induced by SARS-CoV-2 in lung monocytes/macrophages, depending on viral doses, viral strains and cell subsets. For the different cytokines/chemokines analyzed with the human ProcartaPlexTM Mix&Match 12-plex, for each subset in each condition, the difference of cytokine levels between the stimulated and mock culture was calculated and analyzed as in Fig. 6, Additional file 16. Mean + sd. The statistical results of paired comparisons are reported in Additional file 19 and 20. The p-values between the AMs and MoMacs are reported on the figure, as * when < 0.05 and as (*) when comprised between 0.08 and 0.05. The cytokine result panels were grouped as follows: top lane with AM values > or not different to MoMac values, mid and bottom lanes with AM values < MoMac values

Similar articles

Cited by

References

    1. Bost P, De Sanctis F, Cane S, Ugel S, Donadello K, Castellucci M, Eyal D, Fiore A, Anselmi C, Barouni RM et al (2021) Deciphering the state of immune silence in fatal COVID-19 patients. Nat Commun 12:1428. 10.1038/s41467-021-21702-6 10.1038/s41467-021-21702-6 - DOI - PMC - PubMed
    1. Delorey TM, Ziegler CGK, Heimberg G, Normand R, Yang Y, Segerstolpe A, Abbondanza D, Fleming SJ, Subramanian A, Montoro DT et al (2021) COVID-19 tissue atlases reveal SARS-CoV-2 pathology and cellular targets. Nature 595:107–113. 10.1038/s41586-021-03570-8 10.1038/s41586-021-03570-8 - DOI - PMC - PubMed
    1. Bhatnagar J, Gary J, Reagan-Steiner S, Estetter LB, Tong S, Tao Y, Denison AM, Lee E, DeLeon-Carnes M, Li Y et al (2021) Evidence of severe acute respiratory syndrome coronavirus 2 replication and tropism in the lungs, airways, and vascular endothelium of patients with fatal coronavirus disease 2019: an autopsy case series. J Infect Dis 223:752–764. 10.1093/infdis/jiab039 10.1093/infdis/jiab039 - DOI - PMC - PubMed
    1. Ren X, Wen W, Fan X, Hou W, Su B, Cai P, Li J, Liu Y, Tang F, Zhang F et al (2021) COVID-19 immune features revealed by a large-scale single-cell transcriptome atlas. Cell 184(1895–1913):e1819. 10.1016/j.cell.2021.01.05310.1016/j.cell.2021.01.053 - DOI - PMC - PubMed
    1. Rodriguez-Rodriguez L, Gillet L, Machiels B (2023) Shaping of the alveolar landscape by respiratory infections and long-term consequences for lung immunity. Front Immunol 14:1149015. 10.3389/fimmu.2023.1149015 10.3389/fimmu.2023.1149015 - DOI - PMC - PubMed

MeSH terms

Supplementary concepts