Host and venom evolution in parasitoid wasps: does independently adapting to the same host shape the evolution of the venom gland transcriptome?
- PMID: 39148049
- PMCID: PMC11328476
- DOI: 10.1186/s12915-024-01974-2
Host and venom evolution in parasitoid wasps: does independently adapting to the same host shape the evolution of the venom gland transcriptome?
Abstract
Background: Venoms have repeatedly evolved over 100 occasions throughout the animal tree of life, making them excellent systems for exploring convergent evolutionary novelty. Growing evidence supports that venom evolution is predominantly driven by prey or host-related selection pressures, and the expression patterns of venom glands reflect adaptive evolution. However, it remains elusive whether the evolution of expression patterns in venom glands is likewise a convergent evolution driven by their prey/host species.
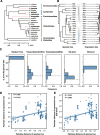
Results: We utilized parasitoid wasps that had independently adapted to Drosophila hosts as models to investigate the convergent evolution of venom gland transcriptomes in 19 hymenopteran species spanning ~ 200 million years of evolution. Comparative transcriptome analysis reveals that the global expression patterns among the venom glands of Drosophila parasitoid wasps do not achieve higher similarity compared to non-Drosophila parasitoid wasps. Further evolutionary analyses of expression patterns at the single gene, orthogroup, and Gene Ontology (GO) term levels indicate that some orthogroups/GO terms show correlation with the Drosophila parasitoid wasps. However, these groups rarely include genes highly expressed in venom glands or putative venom genes in the Drosophila parasitoid wasps.
Conclusions: Our study suggests that convergent evolution may not play a predominant force shaping gene expression levels in the venom gland of the Drosophila parasitoid wasps, offering novel insights into the co-evolution between venom and prey/host.
Keywords: Comparative transcriptome; Convergent evolution; Gene expression; Parasitoid wasps; Venom.
© 2024. The Author(s).
Conflict of interest statement
The authors declare no competing interests.
Figures


Similar articles
-
Transcriptome analysis provides insight into venom evolution in a seed-parasitic wasp, Megastigmus spermotrophus.Insect Mol Biol. 2016 Oct;25(5):604-16. doi: 10.1111/imb.12247. Epub 2016 Jun 10. Insect Mol Biol. 2016. PMID: 27286234
-
Partial venom gland transcriptome of a Drosophila parasitoid wasp, Leptopilina heterotoma, reveals novel and shared bioactive profiles with stinging Hymenoptera.Gene. 2013 Sep 10;526(2):195-204. doi: 10.1016/j.gene.2013.04.080. Epub 2013 May 17. Gene. 2013. PMID: 23688557 Free PMC article.
-
Rapid and Differential Evolution of the Venom Composition of a Parasitoid Wasp Depending on the Host Strain.Toxins (Basel). 2019 Oct 29;11(11):629. doi: 10.3390/toxins11110629. Toxins (Basel). 2019. PMID: 31671900 Free PMC article.
-
Venom Proteins from Parasitoid Wasps and Their Biological Functions.Toxins (Basel). 2015 Jun 26;7(7):2385-412. doi: 10.3390/toxins7072385. Toxins (Basel). 2015. PMID: 26131769 Free PMC article. Review.
-
Variation of Leptopilina boulardi success in Drosophila hosts: what is inside the black box?Adv Parasitol. 2009;70:147-88. doi: 10.1016/S0065-308X(09)70006-5. Adv Parasitol. 2009. PMID: 19773070 Review.
Cited by
-
Oxidative, Genotoxic and Epigenotoxic Effects of Pimpla turionellae Venom at Pharmacological Perspective.Neotrop Entomol. 2025 May 22;54(1):69. doi: 10.1007/s13744-025-01283-5. Neotrop Entomol. 2025. PMID: 40402420 Free PMC article.
References
-
- Losos JB. Improbable destinies: how predictable is evolution? 1st ed. London: Riverhead Books; 2017.
MeSH terms
Substances
Grants and funding
- 32202376/Program of the National Natural Science Foundation of China (NSFC)
- 32302408/Program of the National Natural Science Foundation of China (NSFC)
- 2022QNRC001/Young Elite Scientists Sponsorship Program by China Association for Science and Technology
- 2021M700125/China Postdoctoral Science Foundation
- 2022M722803/China Postdoctoral Science Foundation
LinkOut - more resources
Full Text Sources

