. 2024 Dec 3;23(12):1801-1814.
doi: 10.1158/1535-7163.MCT-24-0369.

Separable Cell Cycle Arrest and Immune Response Elicited through Pharmacological CDK4/6 and MEK Inhibition in RASmut Disease Models

Affiliations

Separable Cell Cycle Arrest and Immune Response Elicited through Pharmacological CDK4/6 and MEK Inhibition in RASmut Disease Models

Jin Wu et al. Mol Cancer Ther. .

Abstract

The combination of CDK4/6 and MEK inhibition as a therapeutic strategy has shown promise in various cancer models, particularly in those harboring RAS mutations. An initial high-throughput drug screen identified high synergy between the CDK4/6 inhibitor palbociclib and the MEK inhibitor trametinib when used in combination in soft tissue sarcomas. In RAS mutant models, combination treatment with palbociclib and trametinib induced significant G1 cell cycle arrest, resulting in a marked reduction in cell proliferation and growth. CRISPR-mediated RB1 depletion resulted in a decreased response to CDK4/6 and MEK inhibition, which was validated in both cell culture and xenograft models. Beyond its cell cycle inhibitory effects, pathway enrichment analysis revealed the robust activation of interferon pathways upon CDK4/6 and MEK inhibition. This induction of gene expression was associated with the upregulation of retroviral elements. The TANK-binding kinase 1 inhibitor GSK8612 selectively blocked the induction of interferon-related genes induced by palbociclib and trametinib treatment and highlighted the separable epigenetic responses elicited by combined CDK4/6 and MEK inhibition. Together, these findings provide key mechanistic insights into the therapeutic potential of CDK4/6 and MEK inhibition in soft tissue sarcomas.


Conflict of interest statement

Competing Interests:

Both ESK and AKW have sponsored research funded by Blueprint Medicines and Bristol Myers Squibb. ESK is also affiliated with Cancer Cell Cycle-LLC.

Figures

Figure 1.
Figure 1.. CDK4/6 and MEK inhibition in RASmut models elicits potent cell cycle inhibition.
A. Heat map representing the relative growth rate of HT1080 cells in response to MEK inhibitors from a drug library at a concentration of 100 nM. B. Live-cell imaging tracking HT1080 cell growth when treated with DMSO, CDK4/6i (Palbociclib, 100 nM), MEKi (Trametinib, 25 nM), or CDK4/6i and MEKi in combination at indicated concentrations for 96 h. C. BrdU incorporation was assessed in HT1080 cells treated with CDK4/6i (Palbociclib, 100 nM) or MEKi (Trametinib, 25 nM) alone, or in combination at indicated concentrations for 72 h. D. Heatmap illustrating relative BrdU incorporation after 72 h of treatment. Synergy was determined using the BLISS method. E. Live-cell imaging tracking MIA PaCa-2 cell growth when treated with DMSO, CDK4/6i (Palbociclib, 100 nM), MEKi (Trametinib, 12.5 nM), or CDK4/6i and MEKi in combination at indicated concentrations for 96 h. F. BrdU incorporation in MIA PaCa-2 cells treated with DMSO, CDK4/6i (Palbociclib, 100 nM), MEKi (Trametinib, 12.5 nM), or CDK4/6i and MEKi in combination for 72 h. G. Heatmap illustrating relative BrdU incorporation after 72 h of treatment. Synergy was determined using the BLISS method. H. qPCR analysis of E2F target genes (CCNA2 and EZH2) in HT1080 cells treated with DMSO, CDK4/6i (Palbociclib, 100 nM), MEKi (Trametinib, 25 nM), or CDK4/6i and MEKi in combination for 48 h. I. Immunoblot analysis of cell cycle proteins in HT1080 cells treated with DMSO, CDK4/6i (Palbociclib, 100 nM), MEKi (Trametinib, 25 nM), or CDK4/6i and MEKi in combination for 48 h. J. Representative propidium iodide-flow cytometry analysis of HT1080 cells treated with DMSO, CDK4/6i (Palbociclib, 100 nM), MEKi (Trametinib, 25 nM), or CDK4/6i and MEKi in combination for 48 h. Error bars represent standard deviation (SD) from triplicates. *p < 0.05, **p < 0.01, ***p < 0.001, as determined by one-way ANOVA with multiple comparisons.
Figure 2.
Figure 2.. RB1 is required for full response to CDK4/6 and MEK inhibition in both cell culture and xenograft fibrosarcoma models.
A. Immunoblot analysis for E2F target proteins in HT1080 and MIA PaCa-2-sgCtrl/sgRB cells treated with DMSO or CDK4/6i (Palbociclib, 100 nM) and MEKi (Trametinib, 25 nM) in combination for 48 h. B. BrdU incorporation was assessed in HT1080 and MIA PaCa-2-sgCtrl/sgRB cells treated with DMSO or CDK4/6i (Palbociclib, 100 nM) and MEKi (Trametinib, 25 nM) in combination at indicated concentrations for 72 h. Data shown as mean ± standard deviation (SD). C. Live-cell imaging tracking HT1080 or MIA PaCa-2-sgCtrl/sgRB cell growth when treated with DMSO or CDK4/6i (Palbociclib, 100 nM) and MEKi (Trametinib, 25 nM) in combination at indicated concentrations for 96 h. Data displayed as mean ± SD. D. Clonogenic assay in HT1080 or MIA PaCa-2-sgCtrl/sgRB cells treated with DMSO or CDK4/6i (Palbociclib, 100 nM) and MEKi (Trametinib, 25 nM) in combination for 14 days. E. HT1080-sgCtrl/sgRB-injected xenograft models treated with vehicle or CDK4/6i (Palbociclib, 100 mg/kg) and MEKi (Trametinib, 0.5 mg/kg) in combination once tumor volume reached 200 mm3. Relative tumor volume was determined every 24 h. Data shown as mean ± SD. * p < 0.05, ** p < 0.01, *** p < 0.001, **** p < 0.0001 as determined by two-way ANOVA. F. HT1080-sgCtrl/sgRB xenograft tumors from vehicle and CDK4/6i (Palbociclib, 100 mg/kg) and MEKi (Trametinib, 0.5 mg/kg)-treated mice stained for pRB (S807/811), Ki67 and by H&E. Representative images are displayed (scale bar = 100 μm).
Figure 3.
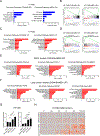
Figure 3.. CDK4/6 and MEK inhibition in fibrosarcoma, PDAC and lung cancer models leads to inhibition of E2F and induction of IFN-like response.
A. ENRICHR analysis identifying downregulated pathways in HT1080 cells treated with CDK4/6i (Palbociclib, 2 μM) or MEKi (Pimasertib, 0.5 μM). B. GSEA from CDK4/6i (Palbociclib, 2 μM) or MEKi (Pimasertib, 0.5 μM)-treated HT1080 cells displaying enrichment of downregulated genes in cell cycle pathways, including E2F_Targets and G2M_checkpoint. C. ENRICHR analysis identifying upregulated pathways in HT1080 cells treated with CDK4/6i (Palbociclib, 2 μM) or MEKi (Pimasertib, 0.5 μM). D. GSEA from CDK4/6i (Palbociclib, 2 μM) or MEKi (Pimasertib, 0.5 μM)-treated HT1080 cells displaying enrichment of upregulated genes in IFN alpha response pathway. E. ENRICHR analysis identifying upregulated pathways in response to CDK4/6i (Palbociclib, 0.5 μM) and MEKi (Trametinib, 25 nM) treatment in three PDAC models: MIA PaCa-2, PANC-1 and PA-TU 8988T. F. ENRICHR analysis identifying upregulated pathways in response to CDK4/6i (Palbociclib, 0.5 μM) and MEKi (Trametinib, 25 nM) treatment in three lung cancer models: A549 (left), H2030 (middle) and H460 (right). G. qPCR analysis for STAT2 and IRF9 in HT1080 cells treated with DMSO, CDK4/6i (Palbociclib, 100 nM), MEKi (Trametinib, 25 nM), or CDK4/6i and MEKi in combination for 48 h. Data displayed as mean ± SD in triplicate. * p < 0.05, ** p < 0.01, *** p < 0.001, **** p < 0.0001 as determined by one-way ANOVA with multiple comparisons. H. ISRE-mCherry IFN reporter assay in HT1080 cells treated with DMSO, CDK4/6i (Palbociclib, 100 nM), MEKi (Trametinib, 25 nM), or CDK4/6i and MEKi in combination for 0 – 120 h. Scale bar = 400 μm.
Figure 4.
Figure 4.. RB1 deficiency blunts cell cycle suppression and IFN response to combination palbociclib-trametinib treatment.
A. qPCR analysis of CCNA2, CCNB1, and EZH2 cell cycle genes in HT1080-sgCtrl/sgRB cells treated with DMSO or CDK4/6i (Palbociclib, 100 nM) and MEKi (Trametinib, 25 nM) in combination. B. qPCR analysis of CCNA2, CCNB1, and EZH2 cell cycle genes in HT1080-sgCtrl/sgRB tumor tissues treated with vehicle or CDK4/6i (Palbociclib, 100 mg/kg) and MEKi (Trametinib, 0.5 mg/kg) in combination. C. qPCR analysis of STAT2, IRF9 and HLA-A immune-related genes in HT1080-sgCtrl/sgRB cells treated with DMSO or CDK4/6i (Palbociclib, 100 nM) and MEKi (Trametinib, 25 nM) for 48 h. D. qPCR analysis of STAT2, IRF9, and HLA-A immune-related genes in HT1080-sgCtrl/sgRB tumor tissues treated with vehicle or CDK4/6i (Palbociclib, 100 mg/kg) and MEKi (Trametinib, 0.5 mg/kg) in combination. E. ISRE-mCherry IFN reporter assay in HT1080-sgCtrl/sgRB cells treated with DMSO, CDK4/6i (Palbociclib, 100 nM), MEKi (Trametinib, 25 nM), or CDK4/6i and MEKi in combination for 72 h. Scale bar = 100 μm. Data displayed as mean ± SD in triplicate. * p < 0.05, ** p < 0.01, *** p < 0.001 **** p < 0.0001 as determined by two-way ANOVA.
Figure 5.
Figure 5.. CDK4/6 and MEK inhibition triggers transposable element upregulation in lung and PDAC models.
A. Volcano plot displaying differentially expressed transposable elements in combined CDK4/6i (Palbociclib, 100 nM) and MEKi (Trametinib, 25 nM)-treated compared to DMSO-treated 519 and 3226 cell lines. B. Transposable element analysis using TEtranscripts to analyze the differential expression of transposable elements in different PDAC and lung cancer cell lines treated with CDK4/6i (Palbociclib, 0.5 μM) and MEKi (Trametinib, 25 nM) in combination. C. Venn diagram showing distribution of significantly upregulated transposable elements in different lung and PDAC cell models treated with CDK4/6i (Palbociclib, 0.5 μM) and MEKi (Trametinib, 25 nM) in combination. D. Heatmap displaying log fold change of the 6 conserved upregulated transposable elements from the five indicated cell lines treated with CDK4/6i (Palbociclib, 100 nM for 519 and 3226 cells; 0.5 μM for PA-TU 8988T, MIA PaCa-2 and A549 cells) and MEKi (Trametinib, 25 nM) in combination. E. qPCR analysis of ERV3–1 expression in CDK4/6i (Palbociclib, 100 nM) and MEKi (Trametinib, 25 nM)-treated 3226 and 519 cells over 48 h post-treatment. Data displayed as mean ± SD in triplicate. * p < 0.05, **** p < 0.0001 as determined by students t test with multiple comparisons. TE, transposable element.
Figure 6.
Figure 6.. TBK1 inhibitor uncouples the cell cycle inhibitory response from the IFN response.
A. ISRE-mCherry reporter assay representative images of HT1080 cells treated with DMSO, CDK4/6i (Palbociclib, 100 nM) and MEKi (Trametinib, 25 nM), TBK1i (GSK8612, 5 μM) or in combination. Poly (I:C) was used as a positive control for dsRNA-activated IFN response as measured by the ISRE-mCherry reporter system. Scale bar = 400 μm. B. qPCR analysis of STAT2 and IRF9 IFN-related gene expression in HT1080 cells treated with vehicle, Poly (I:C) alone or in combination with TBK1i (GSK8612, 5 μM). C. qPCR analysis of STAT2 and IRF9 IFN-related gene expression in HT1080 cells treated with DMSO or CDK4/6i (Palbociclib, 100 nM) and MEKi (Trametinib, 25 nM), with and without TBK1i (GSK8612, 5 μM). D. Immunoblot analysis for TBK1, pTBK1, and cell cycle proteins in HT1080 cells treated with DMSO, CDK4/6i (Palbociclib, 100 nM) and MEKi (Trametinib, 25 nM), TBK1i (GSK8612, 5 μM) or in combination. E. qPCR analysis of STAT2 and IRF9 IFN-related gene expression in HT1080 cells treated with DMSO, CDK4/6i (Palbociclib, 100 nM) and MEKi (Trametinib, 25 nM) with and without TBK1i (GSK8612, 5 μM). F. Bubble plot of gene ontology analysis for both CDK4/6i (Palbociclib, 100 nM) and MEKi (Trametinib, 25 nM) and triple-treatment (Palbociclib + Trametinib + GSK8612) groups using GSEA and KEGG database (biological process) of the top 25 downregulated (blue) and upregulated (red) pathways. G. Venn diagram displaying distribution of significantly differentially expressed genes in 519 cells treated with CDK4/6i (Palbociclib, 100 nM) and MEKi (Trametinib, 25 nM) or triple treatment with TBK1i (GSK8612, 5 μM) included. ENRICHR analysis identifying shared enriched pathways downregulated in 519 cells treated with CDK4/6i (Palbociclib, 100 nM) and MEKi (Trametinib, 25 nM) and triple treatment with TBK1i (GSK8612, 5 μM) included or uniquely expressed genes in 519 cells treated with CDK4/6i (Palbociclib, 100 nM) and MEKi (Trametinib, 25 nM). H. Heatmap of select cell cycle and IFN-related gene expression in HT1080 cells treated with CDK4/6i (Palbociclib, 100 nM) and MEKi (Trametinib, 25 nM) ± TBK1i (GSK8612, 5 μM). Data displayed as mean ± SD in triplicate. **** p < 0.0001 as determined by one-way (B) and two-way ANOVA (C, E).

Similar articles

References

    1. Zhang M, Zhang L, Hei R, Li X, Cai H, Wu X et al. CDK inhibitors in cancer therapy, an overview of recent development. Am J Cancer Res 2021; 11: 1913–1935. - PMC - PubMed
    1. Mughal MJ, Bhadresha K, Kwok HF. CDK inhibitors from past to present: A new wave of cancer therapy. Semin Cancer Biol 2023; 88: 106–122. - PubMed
    1. Asghar U, Witkiewicz AK, Turner NC, Knudsen ES. The history and future of targeting cyclin-dependent kinases in cancer therapy. Nat Rev Drug Discov 2015; 14: 130–146. - PMC - PubMed
    1. Knudsen ES, Witkiewicz AK, Rubin SM. Cancer takes many paths through G1/S. Trends in Cell Biology 2023. - PMC - PubMed
    1. Panagiotou E, Gomatou G, Trontzas IP, Syrigos N, Kotteas E. Cyclin-dependent kinase (CDK) inhibitors in solid tumors: a review of clinical trials. Clin Transl Oncol 2022; 24: 161–192. - PubMed

MeSH terms

LinkOut - more resources