

Renormalization of radiobiological response functions by energy loss fluctuations and complexities in chromosome aberration induction: deactivation theory for proton therapy from cells to tumor control
- PMID: 39148557
- PMCID: PMC11325099
- DOI: 10.1140/epjd/e2019-90263-5
Renormalization of radiobiological response functions by energy loss fluctuations and complexities in chromosome aberration induction: deactivation theory for proton therapy from cells to tumor control
Abstract
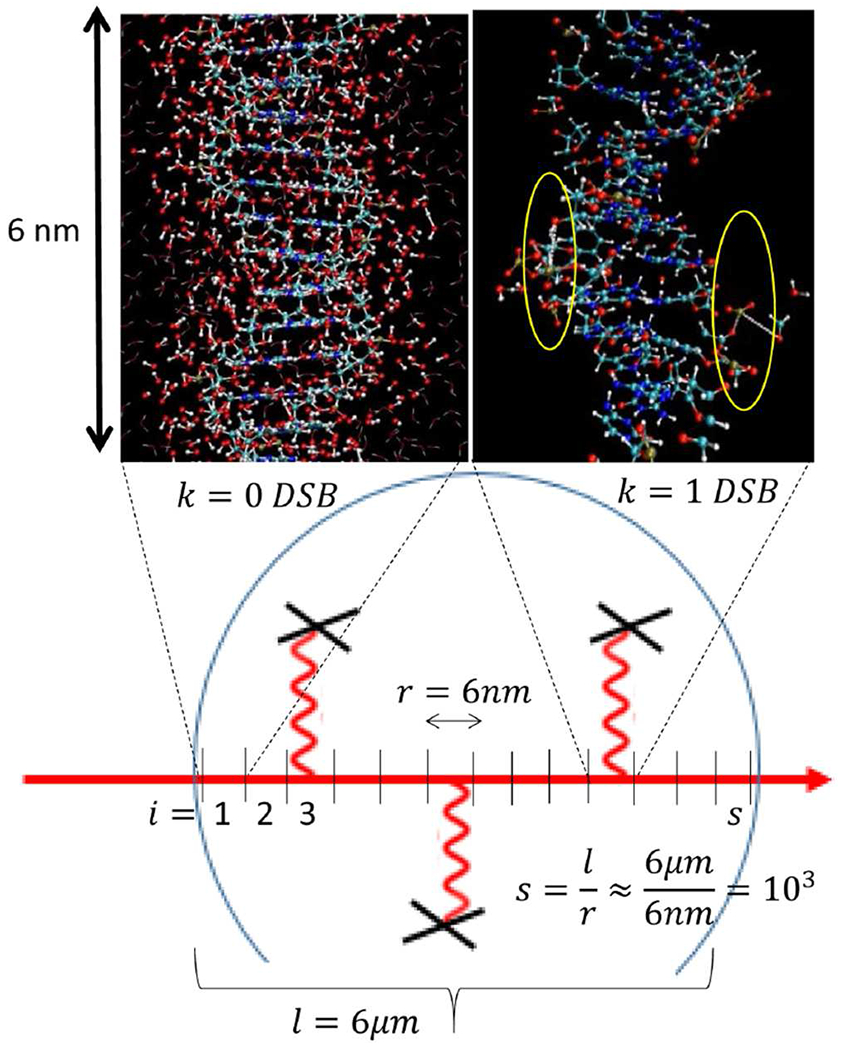
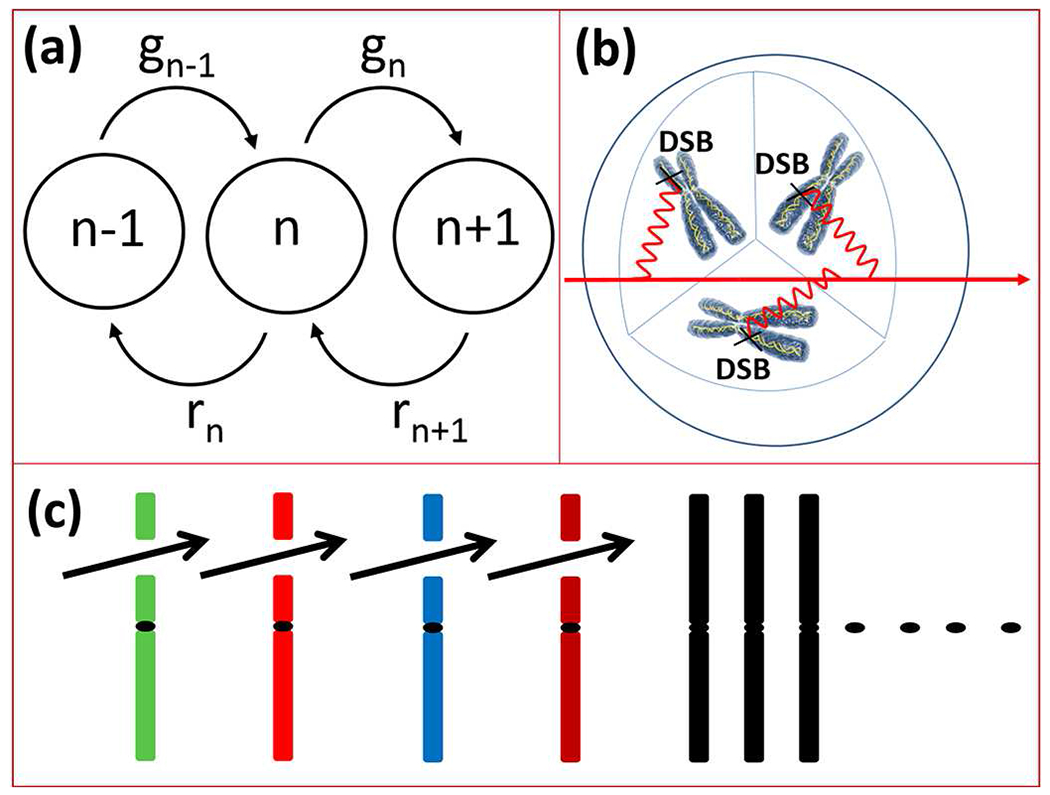
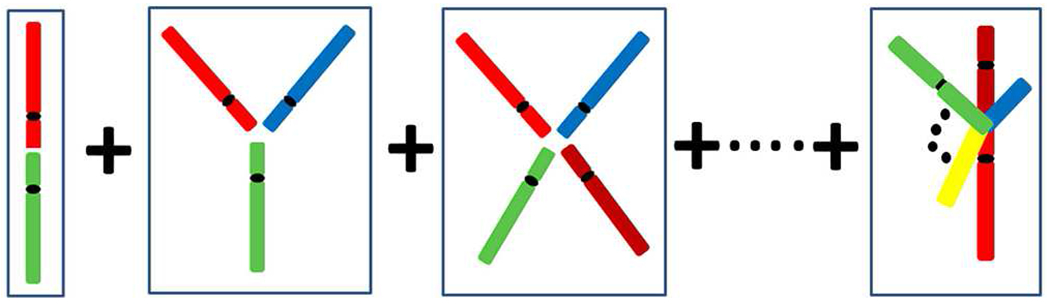
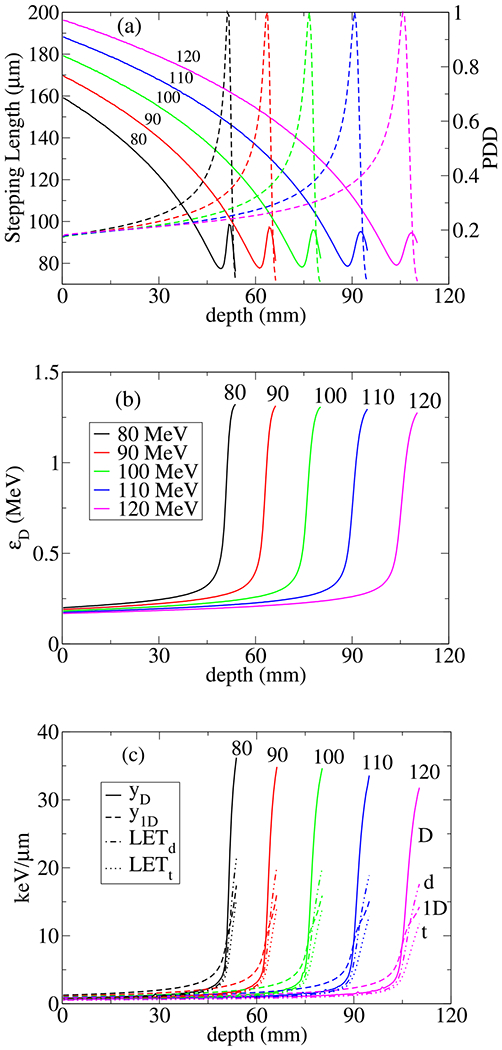
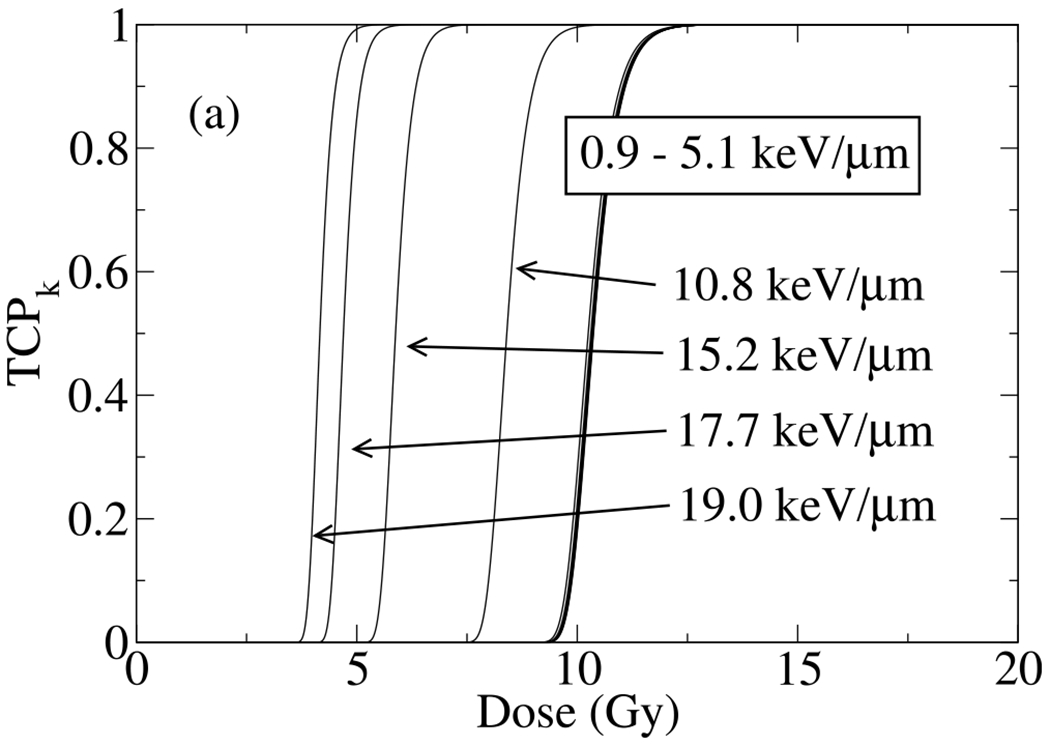
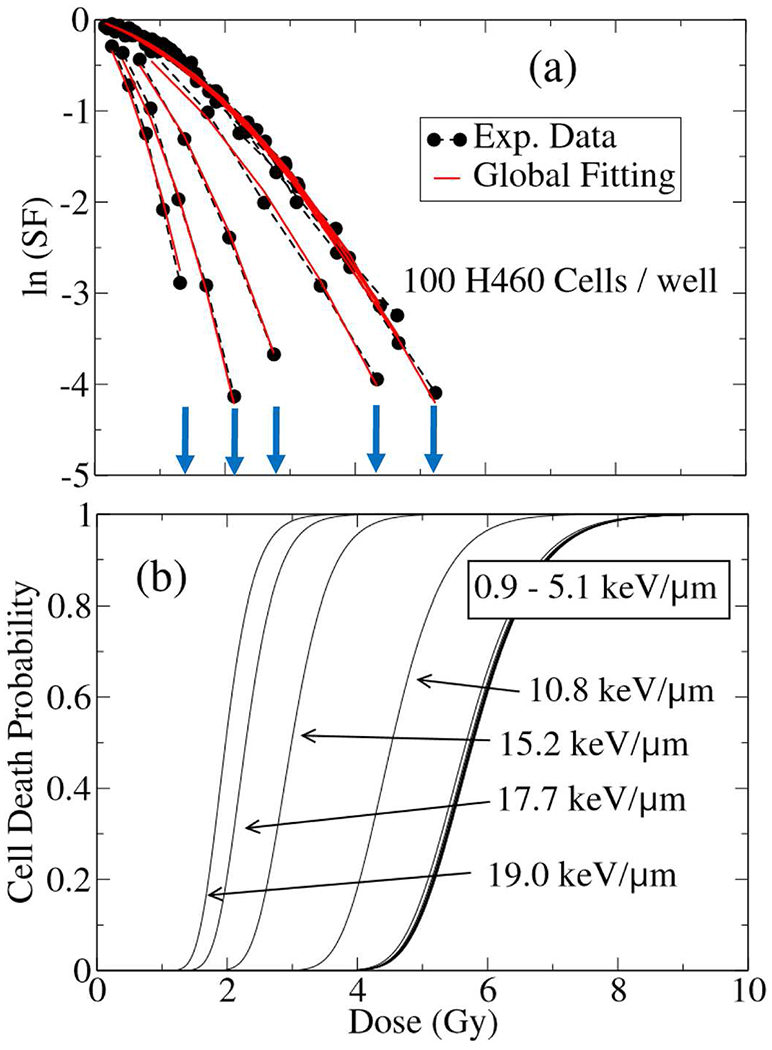
We employ a multi-scale mechanistic approach built upon our recent phenomenological/computational methodologies [R. Abolfath et al., Sci. Rep. 7, 8340 (2017)] to investigate radiation induced cell toxicities and deactivation mechanisms as a function of linear energy transfer in hadron therapy. Our theoretical model consists of a system of Markov chains in microscopic and macroscopic spatio-temporal landscapes, i.e., stochastic birth-death processes of cells in millimeter-scale colonies that incorporates a coarse-grained driving force to account for microscopic radiation induced damage. The coupling, hence the driving force in this process, stems from a nano-meter scale radiation induced DNA damage that incorporates the enzymatic end-joining repair and mis-repair mechanisms. We use this model for global fitting of the high-throughput and high accuracy clonogenic cell-survival data acquired under exposure of the therapeutic scanned proton beams, the experimental design that considers γ-H2AX as the biological endpoint and exhibits maximum observed achievable dose and LET, beyond which the majority of the cells undergo collective biological deactivation processes. An estimate to optimal dose and LET calculated from tumor control probability by extension to ~106 cells per mm-size voxels is presented. We attribute the increase in degree of complexity in chromosome aberration to variabilities in the observed biological responses as the beam linear energy transfer (LET) increases, and verify consistency of the predicted cell death probability with the in vitro cell survival assay of approximately 100 non-small cell lung cancer (NSCLC) cells. The present model provides an interesting interpretation to variabilities in α and β indices via perturbative expansion of the cell survival fraction (SF) in terms of specific and lineal energies, z and y, corresponding to continuous transitions in pair-wise to ternary, quaternary and more complex recombination of broken chromosomes from the entrance to the end of the range of proton beam.
Figures
Similar articles
-
Nonhomologous End Joining Is More Important Than Proton Linear Energy Transfer in Dictating Cell Death.Int J Radiat Oncol Biol Phys. 2019 Dec 1;105(5):1119-1125. doi: 10.1016/j.ijrobp.2019.08.011. Epub 2019 Aug 16. Int J Radiat Oncol Biol Phys. 2019. PMID: 31425731 Free PMC article.
-
A model for relative biological effectiveness of therapeutic proton beams based on a global fit of cell survival data.Sci Rep. 2017 Aug 21;7(1):8340. doi: 10.1038/s41598-017-08622-6. Sci Rep. 2017. PMID: 28827691 Free PMC article.
-
Enhanced RBE of Particle Radiation Depends on Beam Size in the Micrometer Range.Radiat Res. 2024 Feb 1;201(2):140-149. doi: 10.1667/RADE-23-00217.1. Radiat Res. 2024. PMID: 38214379
-
Relative biological effectiveness (RBE) values for proton beam therapy. Variations as a function of biological endpoint, dose, and linear energy transfer.Phys Med Biol. 2014 Nov 21;59(22):R419-72. doi: 10.1088/0031-9155/59/22/R419. Epub 2014 Oct 31. Phys Med Biol. 2014. PMID: 25361443 Review.
-
A comparison of mechanism-inspired models for particle relative biological effectiveness (RBE).Med Phys. 2018 Nov;45(11):e925-e952. doi: 10.1002/mp.13207. Med Phys. 2018. PMID: 30421808 Review.
Cited by
-
A new approach to modeling the microdosimetry of proton therapy beams.Med Phys. 2020 Jul;47(7):3184-3190. doi: 10.1002/mp.14165. Epub 2020 Apr 30. Med Phys. 2020. PMID: 32249429 Free PMC article.
-
Towards the ionizing radiation induced bond dissociation mechanism in oxygen, water, guanine and DNA fragmentation: a density functional theory simulation.Sci Rep. 2022 Nov 18;12(1):19853. doi: 10.1038/s41598-022-23727-3. Sci Rep. 2022. PMID: 36400823 Free PMC article.
-
A DNA damage multiscale model for NTCP in proton and hadron therapy.Med Phys. 2020 Apr;47(4):2005-2012. doi: 10.1002/mp.14034. Epub 2020 Feb 10. Med Phys. 2020. PMID: 31955444 Free PMC article.
-
Construction of a ceRNA network in hepatocellular carcinoma and comprehensive analysis of immune infiltration patterns.Am J Transl Res. 2021 Dec 15;13(12):13356-13379. eCollection 2021. Am J Transl Res. 2021. PMID: 35035681 Free PMC article.
References
-
- Hall EJ, Giaccia AJ, Radiobiology for the Radiologist, 6th edn. (Lippincott Williams & Wilkins, Philadelphia, 2006)
-
- Olsen DR, Bruland OS, Frykholm G, Nordergaug IN, Radiother. Oncol 83, 123 (2007) - PubMed
-
- Schardt D, Elsässer T, Schulz-Ertner D, Rev. Mod. Phys 82, 383 (2010)
-
- Durante M, Paganetti H, Rep. Prog. Phys 79, 096702 (2016) - PubMed
-
- MacDonald SM, Delaney TF, Loefier JS, Cancer Investig 24, 199 (2006) - PubMed
Grants and funding
LinkOut - more resources
Full Text Sources