[Preprint]. 2024 Aug 8:2024.08.07.24311381.
doi: 10.1101/2024.08.07.24311381.

Loss-of-function of the Zinc Finger Homeobox 4 (ZFHX4) gene underlies a neurodevelopmental disorder

Affiliations

Loss-of-function of the Zinc Finger Homeobox 4 (ZFHX4) gene underlies a neurodevelopmental disorder

Pérez Baca María Del Rocío et al. medRxiv. .

Update in

  • Loss of function of the zinc finger homeobox 4 gene, ZFHX4, underlies a neurodevelopmental disorder.
    Pérez Baca MDR, Palomares-Bralo M, Vanhooydonck M, Hamerlinck L, D'haene E, Leimbacher S, Jacobs EZ, De Cock L, D'haenens E, Dheedene A, Malfait Z, Vantomme L, Silva A, Rooney K, Zhao X, Saeidian AH, Owen NM, Santos-Simarro F, Lleuger-Pujol R, García-Miñaúr S, Losantos-García I, Menten B, Gestri G, Ragge N; ZFHX4 consortium; Sadikovic B, Bogaert E, Vleminckx K, Naert T, Syx D, Callewaert B, Vergult S. Pérez Baca MDR, et al. Am J Hum Genet. 2025 Jun 5;112(6):1388-1414. doi: 10.1016/j.ajhg.2025.04.008. Epub 2025 May 13. Am J Hum Genet. 2025. PMID: 40367947

Abstract

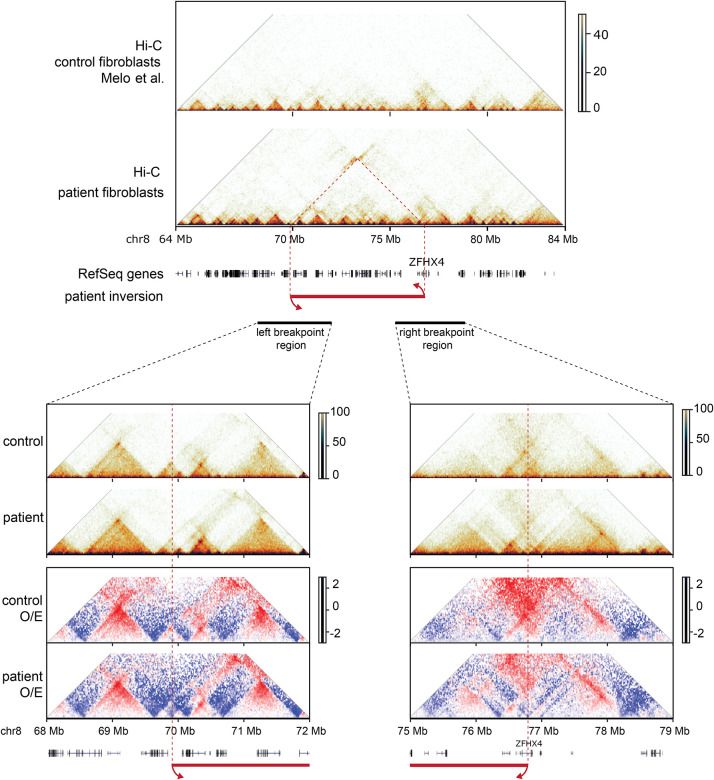
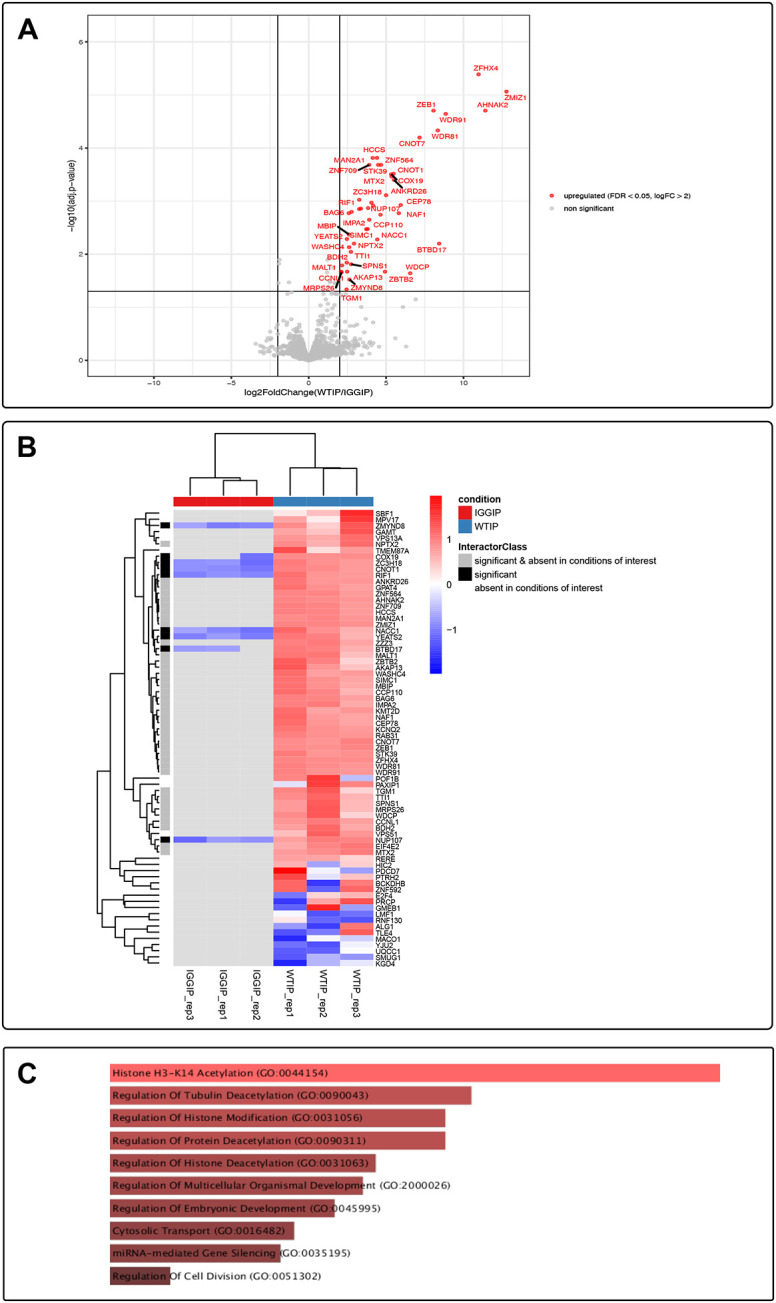
8q21.11 microdeletions encompassing the gene encoding transcription factor ZFHX4, have previously been associated by us with a syndromic form of intellectual disability, hypotonia, decreased balance and hearing loss. Here, we report on 57 individuals, 52 probands and 5 affected family members, with protein truncating variants (n=36), (micro)deletions (n=20) or an inversion (n=1) affecting ZFHX4 with variable developmental delay and intellectual disability, distinctive facial characteristics, morphological abnormalities of the central nervous system, behavioral alterations, short stature, hypotonia, and occasionally cleft palate and anterior segment dysgenesis. The phenotypes associated with 8q21.11 microdeletions and ZFHX4 intragenic loss-of-function variants largely overlap, identifying ZFHX4 as the main driver for the microdeletion syndrome, although leukocyte-derived DNA shows a mild common methylation profile for (micro)deletions only. We identify ZFHX4 as a transcription factor that is increasingly expressed during human brain development and neuronal differentiation. Furthermore, ZFHX4 interacting factors identified via IP-MS in neural progenitor cells, suggest an important role for ZFHX4 in cellular and developmental pathways, especially during histone modifications, cytosolic transport and development. Additionally, using CUT&RUN, we observed that ZFHX4 binds with the promoter regions of genes with crucial roles in embryonic, neuron and axon development. Since loss-of-function variants in ZFHX4 are found with consistent dysmorphic facial features, we investigated whether the disruption of zfhx4 causes craniofacial abnormalities in zebrafish. First-generation (F0) zfhx4 crispant zebrafish, (mosaic) mutant for zfhx4 loss-of-function variants, have significantly shorter Meckel's cartilages and smaller ethmoid plates compared to control zebrafish. Furthermore, behavioral assays show a decreased movement frequency in the zfhx4 crispant zebrafish in comparison with control zebrafish larvae. Although further research is needed, our in vivo work suggests a role for zfhx4 in facial skeleton patterning, palatal development and behavior.


Conflict of interest statement

Declaration of interests No declaration of interests is reported in this manuscript.

Figures

Figure 1:
Figure 1:. Overview of ZFHX4 aberrations in 52 probands and 5 affected family members.
(A) (Micro)deletions identified in probands 1–20 (#) are represented by the red bars and the duplication in proband 16 by the purple bar, all affecting ZFHX4 (light blue box). RefSeq coding genes are indicated respectively in blue131. The numbers colored in black corresponding to their CNV, represent an individual with a training DNA sample for methylome analysis. The numbers colored in grey corresponding to each CNV variant, are individuals with their DNA samples used as testing samples for the methylome analysis. Genomic positions are according to hg38; ZFHX4 is located on the reverse strand. (B) Nonsense, frameshift and splice variants in ZFHX4 are identified in probands 21–52 and visualized with IBS 2.0132. Protein and gene structure of the canonical transcript (GenBank: NM_024721.5) are shown in the top and bottom part, respectively. The majority of PTVs are located in exon 2 and 10. Top: LoF variants are present in the ZFHX4 cohort and located in different domains of ZFHX4. Blue dots represent the frameshift variants, the yellow dots the nonsense variant and the brown-grey dot represents the variants of proband 52 which contains a nonsense (Trp2176*) and a frameshift (Asn2188*fs) mutation. The dot has been placed on the position of the nonsense variant (Trp2176*). Bottom: coding exons are indicated as light blue boxes and the UTRs are represented with white boxes.
Figure 2:
Figure 2:. Hi-C on proband 1 fibroblasts reveals disrupted chromatin structure at inversion breakpoints.
Hi-C contact frequency matrix for control and proband 1 fibroblast (inversion indicated by red arrows). Close-up of left and right breakpoint region, including observed/expected (O/E) contact frequencies for control and proband 1.
Figure 3:
Figure 3:
(A) The Euclidean clustering plot depicts ZFHX4 cases in red and the matched controls are shown in blue. The rows represent selected probes for the identified methylation pattern, while columns represent training cases and controls. A clear separation between cases and controls was observed. Methylation levels are color-coded: blue for 0 beta values and red for 1 beta values, with intensity indicating methylation level intensity. (B) The MDS plot demonstrates the differentiation between case and control samples based on selected probes. Cases are represented by red circles and controls by blue circles. C. Utilizing SVM classification trained with ZFHX4 samples against matched controls, as well as 75% of other control samples and samples from other disorders (blue), in addition to the remaining 25% of the database samples used for testing (gray), produced significant findings. Except for the ZFHX4 deletion samples (training), all other conditions and ZFHX4 testing samples (ZFHX4_truncating) exhibited significantly low MVP scores, indicating an enhancement in the specificity of the model. The ZFHX4 testing samples, which encompass truncating variants (ZFHX4_truncating), a large duplication variant (ZFHX4_duplication), an inversion variant (ZFHX4 _inversion) as well as an intragenic deletion (ZFHX4_in_frame_del) were included, enabling the model to predict class probability for ZFHX4 samples. Abbreviations: ADCADN, cerebellar ataxia, deafness, and narcolepsy, autosomal dominant; ARTHS, Arboleda-Tham syndrome; ATRX, alpha-thalassemia/intellectual development syndrome, X-linked; AUTS18, autism, susceptibility to 18; BEFAHRS, Beck-Fahrner syndrome; BFLS, Börjeson-Forssman-Lehmann syndrome; BIS, blepharophimosis intellectual disability SMARCA2 syndrome; CdLS, Cornelia de Lange syndrome1–4; CHARGE, CHARGE syndrome; 16p11.2del, 16p11.2 deletion syndrome; CSS_c.6200, Coffin-Siris syndrome (c.6232G>A [GenBank: NM_006015.4 (ARID1A)]; p.Glu2078Lys) (c.6254T>G [GenBank: NM_006015.4 (ARID1A)];p.Leu2085Arg) (c.6133T>C [GenBank: NM_017519.2 (ARID1B)]; p.Cys2045Arg); CSS4_c.2650, Coffin-Siris syndrome (c.2656A>G [GenBank: NM_001128849.1 (SMARCA4)]; p.Met886Val); CSS9, Coffin-Siris syndrome-9; Down, Down syndrome; Dup7, Williams-Beuren duplication syndrome (7q11.23 duplication syndrome); DYT28, Dystonia-28, childhood onset; EEOC, epileptic encephalopathy, childhood onset; FLHS, Floating-Harbour syndrome; GADEVS, Gabriele de Vries syndrome; GTPTS, Genitopatellar syndrome; HMA, HVDAS_C, Helsmoortel-Van der Aa syndrome (ADNP syndrome [central]); HVDAS_T, Helsmoortel-Van der Aa syndrome (ADNP syndrome [Terminal]); ICF1 Immunodeficiency, centromeric instability, facial anomalies syndrome 1, ICF2_3_4, immunodeficiency, centromeric instability, facial anomalies syndrome 2, 3, and 4; IDDSELD, intellectual developmental disorder with seizures and language delay; Kabuki, Kabuki syndromes 1 and 2; KDM2B, KDM2B-related syndrome; KDM4B, KDM4B-related syndrome; KDVS, Koolen de Vries syndrome; Kleefstra, Kleefstra syndrome 1; LLS, Luscan-Lumish syndrome; MKHK_ID4, Menke-Hennekam syndrome-1, 2; MLASA2, myopathy, lactic acidosis, and sideroblastic anemia-2; MRD23, intellectual developmental disorder, autosomal dominant 23; MRD51, intellectual developmental disorder, autosomal dominant 51; MRX93, intellectual developmental disorder, X-linked, XLID93; MRX97, intellectual developmental disorder, X-linked 97, XLID97; MRXSA, Armfield syndrome; MRXSCJ, syndromic X-linked intellectual disability, Claes-Jensen type; MRXSN, syndromic X-linked intellectual disability, Nascimento type; MRXSSR, syndromic X-linked intellectual disability, Snyder-Robinson type; PHMDS, Phelan-McDermid syndrome; PRC2, RENS1, Renpenning syndrome; RMNS, Rahman syndrome; RSTS, Rubinstein-Taybi syndrome-1, 2; RSTS1, Rubinstein-Taybi syndrome-1; RSTS2, Rubinstein-Taybi syndrome-2; SBBYSS, Say-Barber-Biesecker-Young-Simpson syndrome; Sotos, Sotos syndrome; TBRS, Tatton-Brown-Rahman syndrome; VCFS_comp, velocardiofacial syndrome; VCFS_core, velocardiofacial syndrome; WDSTS, Wiedemann-Steiner syndrome; WHS, Wolf-Hirschhorn syndrome; and Williams, Williams-Beuren deletion syndrome (7q11.23 deletion syndrome).
Figure 4:
Figure 4:. ZFHX4 expression increases during human neuronal differentiation, brain and craniofacial development
(A) ZFHX4 expression levels during in vitro neural differentiation. RNA was sampled at the following stages: iPSCs, NSC (neural stem cells), neural progenitor cells (NPC) and direct differentiated neurons (Ns). An increasing expression is observed upon differentiation. The median expression value is indicated by the middle horizontal line. The whiskers indicate the minimum and maximum values. CNRQ, calibrated normalized relative quantity. (B) Endogenous ZFHX4 (399 kDa) levels in HEK293T, iPSCs, and NPCs as detected with western blot using the ZFHX4 antibody (top) and a vinculin antibody as a loading control (bottom). (C) ZFHX4 levels in developing human brain. ZFHX4 expression in the developing human brain (normalized RPKM data) showing higher expression during early prenatal development followed by decreased expression upon brain maturation. Data obtained from BrainSpan: http://www.brainspan.org. (D) Human embryonic craniofacial tissue bulk RNA-seq is visualized in a plot, showing an increase in ZFHX4 in craniofacial samples from five carnegie stages (CS13, CS14, CS15, CS17 and CS22)133.
Figure 5:
Figure 5:. ZFHX4 interacts with 46 enriched proteins involved in axonogenesis, cell differentiation and neuron differentiation.
(A) The enriched ZFHX4 interacting proteins in NPCs shown in a volcano plot. For each detected protein, the log2 fold change (FC) between the ZFHX4 IP-enriched samples and the IgG controls is shown on the x axis, while the −log10 of the p value is shown on the y axis. The horizontal dashed line indicates the −log10 value of a p value equal to 0.05. Proteins with an FDR < 0.05, log2 FC > 2 and log2 FC < −2 are, respectively, highlighted in blue and red. (B) Hierarchical clustering of potentially interesting proteins. The proteins shown to be differentially abundant between groups are visualized in a heatmap after non-supervised hierarchical clustering of z-scored log 2 PG.MaxLFQ intensities. The heatmap color scale from blue to red represents the level of abundance. The interacting factors which are absent in the IgG control, significant but not absent at the IgG control and significantly enriched protein and absent in the IgG control, are listed in Tables S7 and S8. (C) ZFHX4 interacting factors associated to their biological processes with EnrichR.
Figure 6:
Figure 6:. CUT&RUN sequencing data shows ZFHX4 binding to genes involved in axonogenesis, the regulation of the nervous system development, neurogenesis and neural migration.
(A) Annotation of CUT&RUN consensus peaks reveals ZFHX4 binding to promoter regions. Left: Distribution of the ZFHX4 consensus peaks relative to transcription start sites (TSS). Half of the peaks are found between 0–1 kb of the TSS. Right: Pie chart visualizing the genomic annotation and the percentage of the peaks that overlap a TSS, 5’ UTR, 3’ UTR, exonic, intronic, downstream or distal intergenic regions. This shows that 55.62% of ZFHX4 consensus peaks are found near gene promoters. (B) ZFHX4 binds to genes involved in axonogenesis, forebrain and nervous system development, including the regulation of the neurogenesis and synapse organization; cell and neuron differentiation. The gene ontology (GO) dot plot displays the top 20 enriched biological processes (BPs) ranked by gene ratio (the number of genes related to GO term/total number of significant genes) and the p-adjusted values for these terms (colour, p-value 1e10−7-1e10−5). The size of the dot represents the gene counts per BP. (C) ZFHX4 plays a key role in embryonic, neuron and axon developmental pathways. The Kyoto Encyclopedia of Genes and Genomes (KEGG) dot plot provides all enriched biological pathways ranked by gene ratio (# of genes related to GO term/total number of significant genes) and the p-adjusted values for these terms (color). The size of the dot represents the gene counts per pathway.
Figure 7:
Figure 7:. Zebrafish zfhx4 crispants showed both craniofacial and behavioral changes.
(A) Gene structure of the zebrafish zfhx4 and ZFHX4. Top: The coding exons of ZFHX4 are shown as light grey boxes and light blue boxes for the CDS (coding sequence), and untranslated regions in red (5’-UTR) and green (3’-UTR). Bottom: The coding exons of zfhx4 are shown as light grey boxes and light blue boxes for the CDS, and untranslated regions in red (5’-UTR) and green (3’-UTR). (B) Representative craniofacial images for zfhx4 and scrambled zebrafish crispants are shown. Left: microscopic ventral view scrambled (top panel) and zfhx4 crispants (bottom panel) of Alcian blue stained craniofacial structures at 5 dpf reveal smaller ethmoid plates and shorter Meckel’s cartilage in the F0 zfhx4 crispant larvae. Right: Adapted image from the representation of the cartilage structures of the zebrafish neurocranium (dark blue) at 5 dpf by lines. The red lines and circle show the measurements taken and normalized with the length of the head (purple line). (C) Left: the surface area of the ethmoid plate was measured and normalized to the head length of the larvae. Right: The length of the individual Meckel’s cartilage structures was measured and normalized to the head length of the larvae. The ethmoid plate and the Meckel’s cartilage showed significant differences between crispant larvae compared to scrambled larvae (p-value ≤ 0.001 (***), p-value ≤ 0.0001 (****)) (D) zfhx4 crispants show a consistently lower movement frequency compared to scrambled control larvae during the complete behavior experiment but the trends during light and dark cycles remain similar. Dark periods are indicated with grey boxes. Data is represented as mean ± SEM (n=60/genotype).

References

    1. Jansen S., Vissers L.E.L.M., and de Vries B.B.A. (2023). The Genetics of Intellectual Disability. Brain Sci 13, 231. 10.3390/brainsci13020231. - DOI - PMC - PubMed
    1. Palomares M., Delicado A., Mansilla E., De Torres M.L., Vallespín E., Fernandez L., Martinez-Glez V., García-Miñaur S., Nevado J., Simarro F.S., et al. (2011). Characterization of a 8q21.11 microdeletion syndrome associated with intellectual disability and a recognizable phenotype. American Journal of Human Genetics 89, 295–301. 10.1016/j.ajhg.2011.06.012. - DOI - PMC - PubMed
    1. Hofmann K., Becker J., Heller R., Boute O., Andrieux J., Hoyer J., Ekici A.B., Reis A., and Rauch A. (2011). 7 Mb de novo deletion within 8q21 in a patient with distal arthrogryposis type 2B (DA2B). European Journal of Medical Genetics 54, e495–e500. 10.1016/j.ejmg.2011.06.002. - DOI - PubMed
    1. Vulto-van Silfhout A.T., Hehir-Kwa J.Y., van Bon B.W.M., Schuurs-Hoeijmakers J.H.M., Meader S., Hellebrekers C.J.M., Thoonen I.J.M., de Brouwer A.P.M., Brunner H.G., Webber C., et al. (2013). Clinical significance of de novo and inherited copy-number variation. Hum Mutat 34, 1679–1687. 10.1002/humu.22442. - DOI - PubMed
    1. Happ H., Schilter K.F., Weh E., Reis L.M., and Semina E.V. (2016). 8q21.11 microdeletion in two patients with syndromic peters anomaly. Am J Med Genet A 170, 2471–2475. 10.1002/ajmg.a.37840. - DOI - PMC - PubMed

Publication types