[Preprint]. 2025 Jul 21:2024.06.19.24308302.
doi: 10.1101/2024.06.19.24308302.

Variants in the proteasome regulator PSMF1 cause a phenotypic spectrum from early-onset Parkinson's disease to perinatal lethality and disrupt mitochondrial function

Francesca Magrinelli  1 Christelle Tesson  2 Plamena R Angelova  1 Jose A Rodriguez  3 Annarita Scardamaglia  4 Benjamin O'Callaghan  5 Simon A Lowe  6 Ainara Salazar-Villacorta  4 Brian Hon-Yin Chung  7   8 Matthew Jaconelli  9 Barbara Vona  10   11 Noemi Esteras  1   12   13 Angela Mammana  14 Junko Shimazu  3 Anna Ka-Yee Kwong  7 Thomas Courtin  2 Shahryar Alavi  5 Reza Maroofian  4 Raja Nirujogi  9 Mariasavina Severino  15 Edoardo Monfrini  16 Clarissa Rocca  4 Patrick A Lewis  5   17 Stephanie Efthymiou  4 Rebecca Buchert  18 Linda Sofan  18 Pawel Lis  9 Chloé Pinon  2 Guido J Breedveld  19 Martin Man-Chun Chui  7 David Murphy  1 Vanessa Pitz  20 Mary B Makarious  21 Simone Baiardi  14   22 Marina Volin  3 Marlene Cassar  2 Bassem A Hassan  2 Sana Iftikhar  23 Peter Bauer  24 Michele Tinazzi  25 Marina Svetel  26 Bedia Samanci  27 Haşmet A Hanağası  27 Basar Bilgiç  27 Francesco Cavallieri  28 Mario Santangelo  29 José A Obeso  13   30   31 Monica M Kurtis  32 Guillaume Cogan  2 Güneş Kiziltan  33 Tuğçe Gül-Demirkale  34 Hülya Tireli  35 Gülbün A Yüksel  36 Gül Yalçın-Cakmakli  37 Bülent Elibol  37 Nina Barišić  38 Earny Wei-Sen Ng  7 Sze-Shing Fan  7 Tova Hershkovitz  39 Karin Weiss  40   41 Javeria Raza Alvi  42 Tipu Sultan  42 Issam Azmi Alkhawaja  43 Tawfiq Froukh  44 Hadeel Abdollah E Alrukban  45 Christine Fauth  46 Ulrich A Schatz  46   47 Thomas Zöggeler  48 Michael Zech  47   49   50 Karen Stals  51 Vinod Varghese  52 Sonia Gandhi  1   53 Cornelis Blauwendraat  20   54 John A Hardy  5 Alessio Di Fonzo  16 Vincenzo Bonifati  19 Tobias B Haack  18   47 Aida M Bertoli-Avella  24 Suzanne Lesage  2 Ayşe Nazlı Başak  34 Robert Steinfeld  55   56 Piero Parchi  14   22 James E C Jepson  6 Dario R Alessi  9 PSMF1 Study GroupAlexis Brice  2 Hermann Steller  3 Andrey Y Abramov  1 Kailash P Bhatia  1 Henry Houlden  4
Affiliations

Variants in the proteasome regulator PSMF1 cause a phenotypic spectrum from early-onset Parkinson's disease to perinatal lethality and disrupt mitochondrial function

Francesca Magrinelli et al. medRxiv. .

Abstract

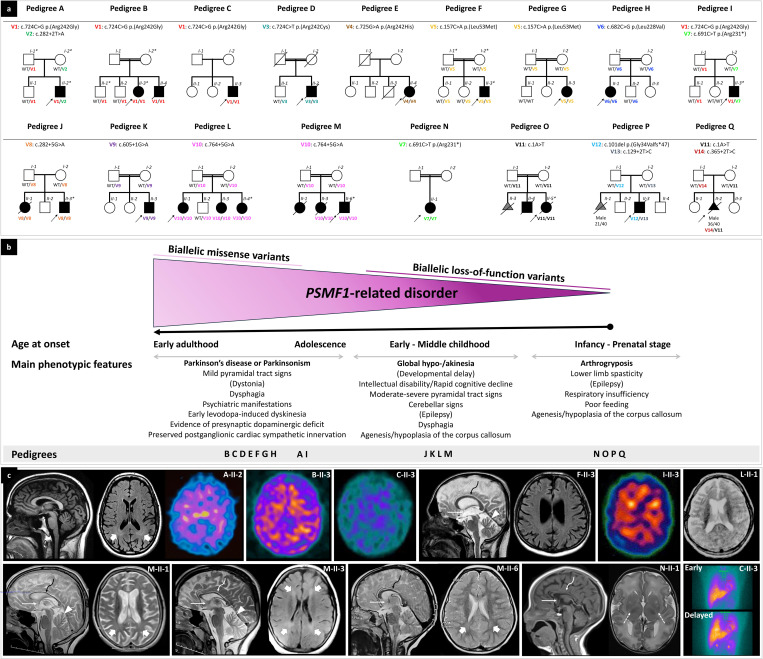
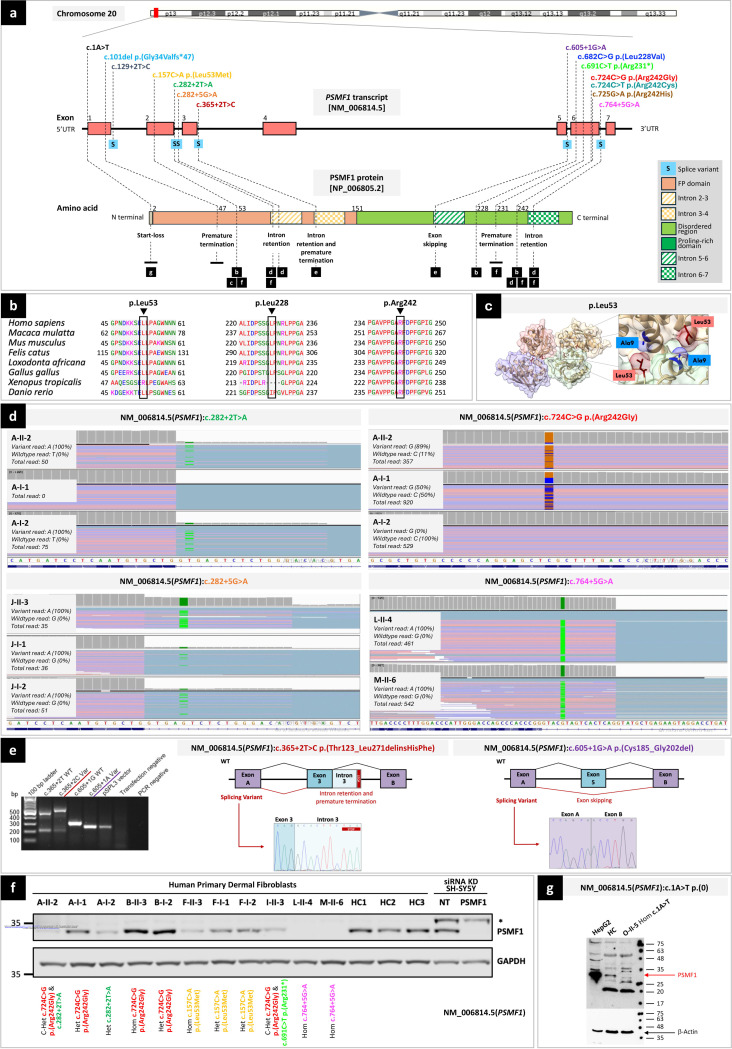
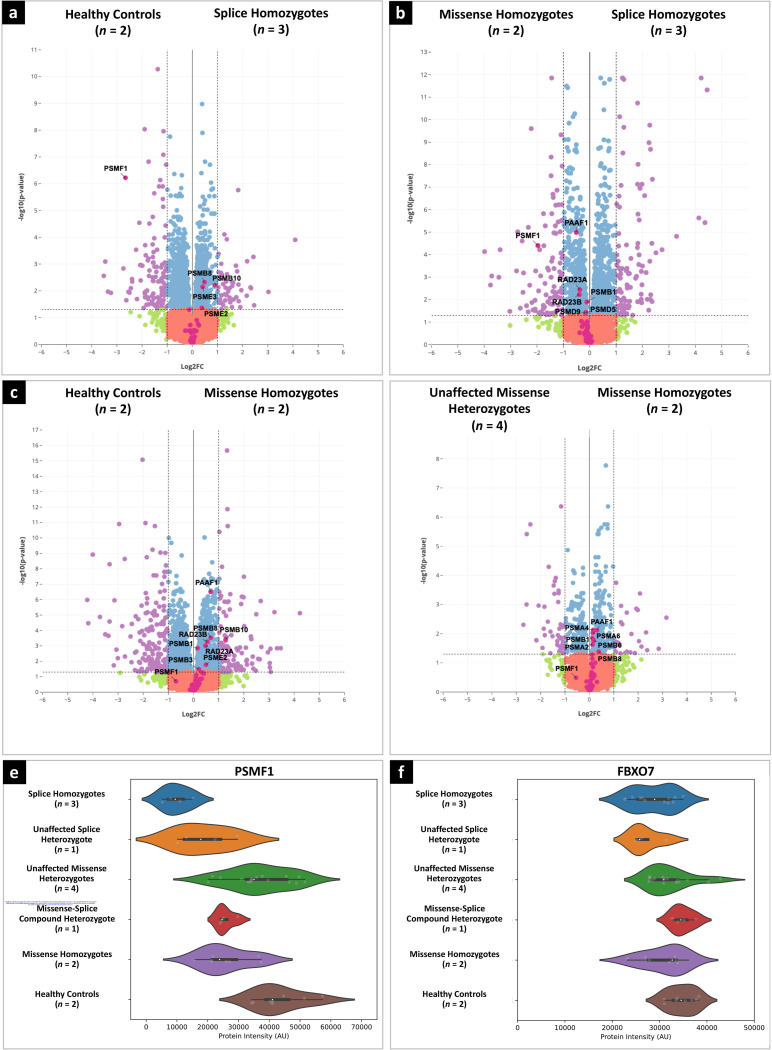
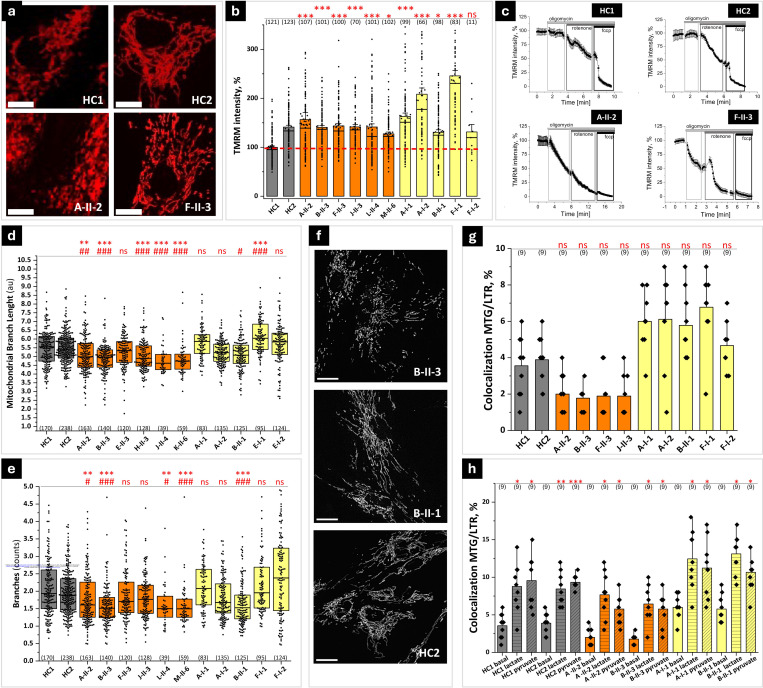
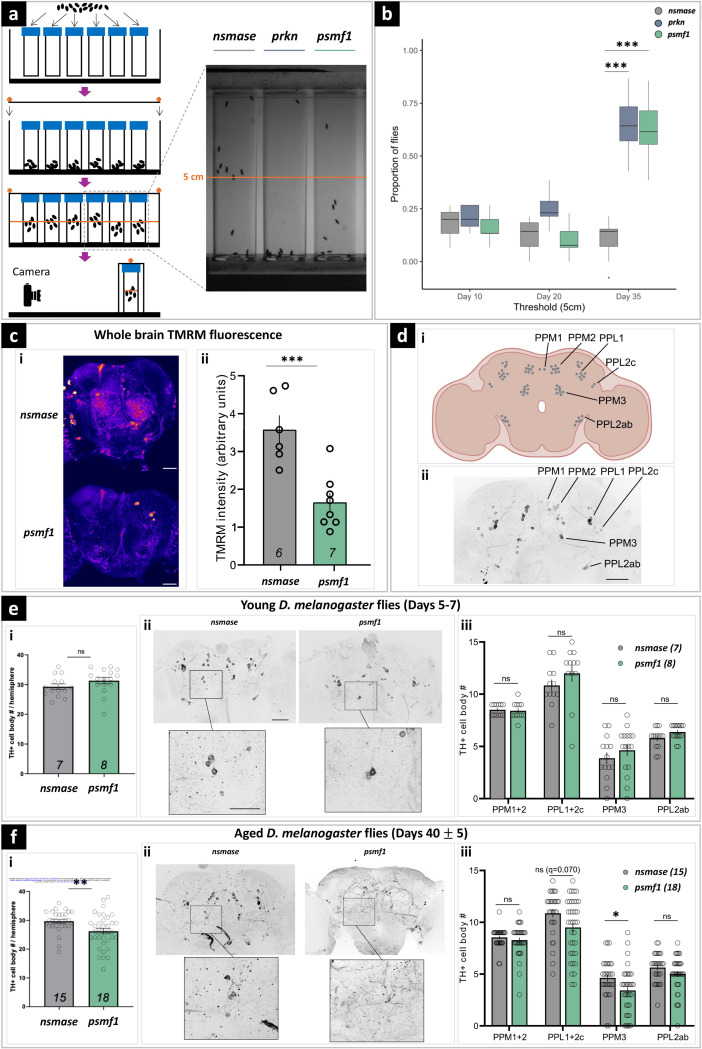
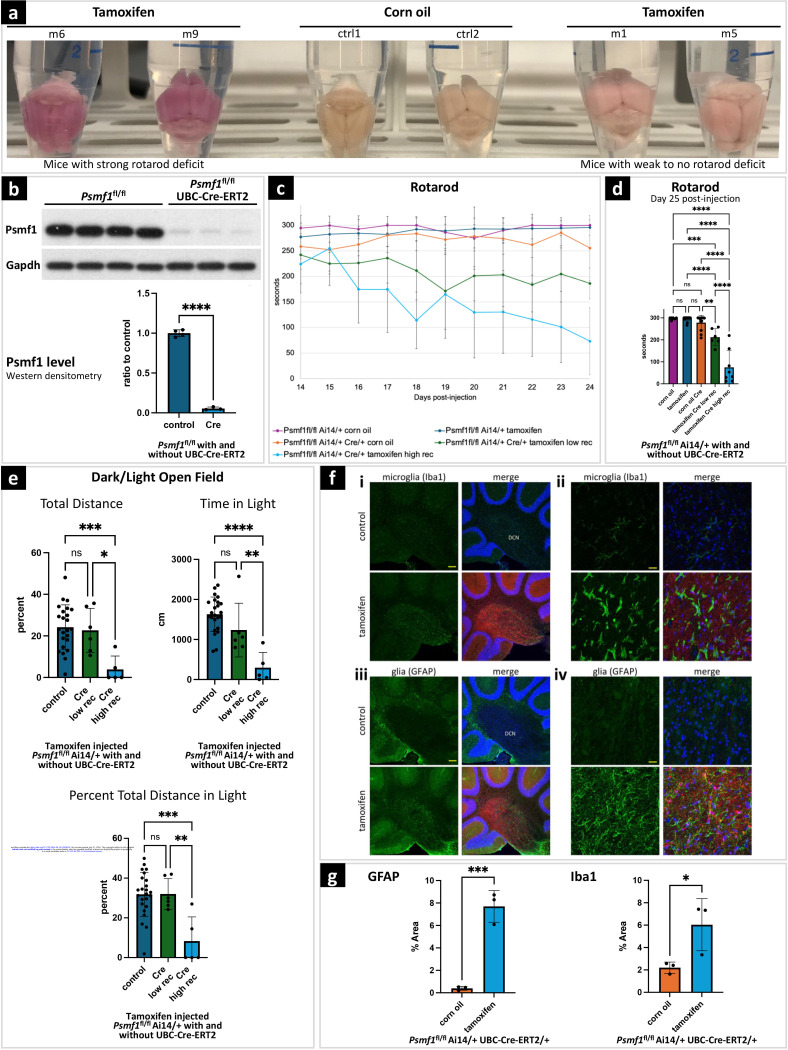
Dissecting biological pathways highlighted by Mendelian gene discovery has provided critical insights into the pathogenesis of Parkinson's disease (PD) and neurodegeneration. This approach ultimately catalyzes the identification of potential biomarkers and therapeutic targets. Here, we identify PSMF1 as a novel gene implicated in parkinsonism and childhood neurodegeneration. We find that biallelic PSMF1 missense and loss-of-function variants co-segregate with phenotypes from early-onset PD to perinatal lethality with neurological manifestations across 17 pedigrees with 24 affected subjects, showing clear genotype-phenotype correlation. PSMF1 encodes the proteasome regulator PSMF1/PI31, a highly conserved, ubiquitously expressed partner of the 20S proteasome and neurodegeneration-associated F-box-O 7 and valosin-containing proteins. We demonstrate that PSMF1 variants impair mitochondrial membrane potential, dynamics and mitophagy, and may affect proteasomal abundance and assembly in patient-derived fibroblasts. Furthermore, Drosophila and mouse models of PSMF1 loss of function exhibit age-dependent motor impairment, as well as brain-wide mitochondrial membrane depolarization and dopaminergic neurodegeneration in aged flies, and diffuse gliosis in mice. Collectively, our findings unequivocally link defective PSMF1 to early-onset parkinsonism and neurodegeneration, and suggest proteasomal and mitochondrial dysfunction as mechanistic contributors.


Figures

Figure 1.
Figure 1.. Pedigrees and phenotypic features of individuals with biallelic PSMF1 variants.
(a) Simplified pedigrees of PSMF1 families. Pedigrees of 17 PSMF1 families are presented, with the results of segregation analysis of PSMF1 variants. In the diagrams, males are represented by squares, females by circles, and fetuses by triangles. A diagonal line across a symbol indicates a deceased individual. Fetal gender and gestational age at death (n weeks/40 weeks) are reported below their symbol, if available. Consanguineous marriages are denoted by double lines between symbols, while probands are marked with an arrow. Individuals exhibiting a neurological disease phenotype are represented by black filled symbols. Fetuses aborted for undetermined cause (O-II-3, P-II-1) are represented by a gray filled symbol. Roman numerals indicate generations, whereas Arabic numbers denote individuals within each generation. Variants are referenced to PSMF1 transcript NM_006814.5 and displayed with different font colors (Fig. 2a; Supplementary File 1). “WT” designates the PSMF1 wild-type allele. An asterisk identifies dermal fibroblast donors. (b) Genotype-phenotype correlation in PSMF1-related disorder. Schematic representation of the core phenotypic features associated with biallelic variants in PSMF1, with indication of age at onset and main clinical manifestations in subgroups of subjects belonging to the study cohort. Increasingly more severe phenotypes correspond to progressively more deleterious mutational effects. (c) Neuroimaging and ¹²³I-MIBG myocardial scintigraphy features of PSMF1-related disorder. Brain MRI with sagittal T1- or T2-weighted images and axial FLAIR or T2-weighted images of individuals A-II-2 (25–30 years), F-II-3 (25–30 years), L-II-1 (10–15 years), M-II-1 (10–15 years), M-II-3 (10–15 years), M-II-6 (0–5 years) and N-II-1 (neonatal period). Mild-to-moderate enlargement of the cerebral subarachnoid spaces is noted in subjects A-II-2, F-II-3, L-II-1, M-II-1 and M-II-3. Enlargement of the subarachnoid spaces of the superior cerebellar vermis is present in individuals F-II-3, M-II-1 and M-II-3. Additional faint T2/FLAIR-signal alterations are visible in the periventricular white matter in individuals A-II-2, M-II-1, M-II-3 and M-II-6 (thick arrows). There is hypoplasia of the corpus callosum (curved arrows) and small anterior commissure (thin arrows) in subjects F-II-3, L-II-1, M-II-1, M-II-3, M-II-6 and N-II-1. There is lack of myelination of the posterior limbs of the internal capsules in patient N-II-1 (dashed arrows), associated with foci of T2 hyperintensity at the level of the putamina. DaTscan of subjects A-II-2, B-II-3, C-II-3 and I-II-3 reveals severely reduced tracer uptake in the striatum bilaterally, with increased background activity. 123I-MIBG myocardial scintigraphy measured 15 minutes (early registration) and four hours (late registration) after intravenous 123I-MIBG application was normal in proband C-II-3 (30–35 years). 123I-MIBG = 123I-metaiodobenzylguanidine.
Figure 2.
Figure 2.. Location, computational analyses and functional characterization of PSMF1 variants.
(a) Schematic of PSMF1 and its protein product with location of 14 variants identified in this study and their effect. Upper part. Chromosome 20 showing position of PSMF1 on 20p13. Middle part. Schematic of PSMF1 with variants identified in the human disease gene discovery study cohort. Introns are not to scale. Exon numbers are according to the canonical transcript (NM_006814.5). Lower part. Schematic of PSMF1 protein with amino acid changes linked to disease (reference sequence NP_006805.2). Black labels below individual PSMF1 variants guide to corresponding panels of Figure 2 (b–g), where computational or functional characterization of these variants is presented. (b) Interspecies alignment showing strong evolutionary conservation of the amino acids affected by the PSMF1 missense variants identified in this study across species, down to invertebrates. (c) Localization of the p.Leu53 residue within the PSMF1–PSMF1 homotetramer crystal structure, revealing a role for this residue in PSMF1 homodimerization. The residue p.Leu53 is involved in the PSMF1 variant detected in Pedigrees F–G (Fig. 1a; Supplementary File 4). Image derived from PDB 4OUH using ChimeraX. (d) RNA sequencing. Integrative Genomics Viewer (IGV) screen captures showing results of RNA sequencing for Pedigree A (upper panels), Pedigree J (left lower panel) and probands L-II-4 and M-II-6 (right lower panel). For transcripts with PSMF1 splice variants c.282+2T>A (A-I-2, A-II-2), c.282+5G>A (J-I-1, J-I-2, J-II-3), and c.764+5G>A (L-II-4, M-II-6), IGV enables visualization of (partial) intron retention. (e) Minigene (splicing) assays. Left panel. Agarose gel of the RT-PCR from the minigene cDNA. Middle panel. Splicing schematic of the NM_006814.5(PSMF1):c.365+2T>C variant showing intron retention with stop codon sequence marked. Right panel. Splicing assay of the NM_006814.5(PSMF1):c.605+1G>A variant shows exon skipping. (f) PSMF1 immunoblots for human primary dermal fibroblasts from available probands, unaffected relatives and healthy controls indicating loss of PSMF1 immunoreactivity in most affected individuals. Immunoblots for non-targeting siRNA and PSMF1 siRNA KD SH-SY5Ys shown alongside indicate specificity of the anti-PSMF1 antibody used. (g) Western blot to functionally characterize the start-loss variant NM_006814.5(PSMF1):c.1A>T. Protein lysates (30 μg) from HepG2 cells, and either control or proband (O-II-5) fibroblasts were analyzed by Western blotting using a polyclonal anti-PSMF1 antibody. HepG2 cells express PSMF1 at high levels. Control but not proband fibroblasts express PSMF1. β-actin expression was used as loading control. C-Het = compound heterozygote; Het = heterozygote; Hom = homozygote; siRNA KD = small interfering RNA knockdown.
Figure 3.
Figure 3.. Quantitative proteomic analysis of PSMF1 patient- and carrier-derived dermal fibroblasts.
Volcano plots showing: (a) statistically significant downregulation of PSMF1 in affected individuals with homozygous PSMF1 splice variants (n = 3; J-II-3, L-II-4, M-II-6) compared to healthy controls (HC); (b) Statistically significant reduction in PSMF1 expression in affected individuals with homozygous PSMF1 splice variants (n = 3; J-II-3, L-II-4, M-II-6) compared to probands with homozygous PSMF1 missense variants (n = 2; B-II-3, F-II-3); (c) PSMF1 expression was not downregulated in probands with homozygous PSMF1 missense variants (n = 2; B-II-3, F-II-3) compared to HC or (d) unaffected individuals having a single heterozygous PSMF1 missense variant (n = 4; A-I-1, B-II-1, F-I-1, F-I-2). Different colored dots within each quadrant of the volcano plot denote their respective p-value cut-off (0.05 > p OR p ≤ 0.05; y-axis) and log₂ fold-change (FC > 1 OR FC ≤ 1; x-axis). Additional pink-colored dots indicate proteins associated with the proteasomal pathway (as annotated within the Curtain web tool: https://curtain.proteo.info/#/), with differentially abundant proteins that passed the statistical significance threshold (p < 0.05) being further annotated by text within each volcano plot. Violin plots showing: (e) PSMF1 protein expression across different groups, including probands with homozygous PSMF1 splice variants (n = 3; J-II-3, L-II-4, M-II-6), unaffected individuals with one heterozygous PSMF1 splice variant (n = 1; A-I-2) or one heterozygous PSMF1 missense variant (n = 4; A-I-1, B-II-1, F-I-1, F-I-2), proband with one PSMF1 splice and one PSMF1 missense variant in compound heterozygosity (n = 1; A-II-2), probands with homozygous PSMF1 missense variants (n = 2; B-II-3, F-II-3), and healthy controls; (f) FBXO7 protein expression across the same groups. Patients with homozygous PSMF1 splice variants (n = 3; J-II-3, L-II-4, M-II-6) exhibit a statistically significant reduction (p < 0.05) in protein expression vs HC following differential expression analysis, albeit with a log2 fold-change < 1. HC = healthy controls (n = 2; M:F = 0:1; age at skin biopsy = 19.5 ± 0.5 years).
Figure 4.
Figure 4.. PSMF1 deficiency is associated with defects in mitochondrial bioenergetics and dynamics.
(a-c) Mitochondrial membrane potential status and maintenance: (a) Representative images of tetramethylrhodamine methyl ester (TMRM)-loaded mitochondria in fibroblasts from healthy controls (HC1, HC2) and PSMF1 probands (A-II-2, F-II-3; Fig.1a). Scale bar = 20 μm. (b) Quantification bar graphs depict the mean mitochondrial membrane potential for HC’ (gray bars; see also red dash line), probands’ (orange bars) and unaffected carriers’ (yellow boxes) mitochondria. Non-parametric Kruskal-Wallis ANOVA with post-hoc Dunn’s test for each group. Data are presented as mean ± standard error of the mean (SEM). *p < 0.05, **p < 0.01, ***p < 0.001, ns = not statistically significant. (c) Inhibitor analysis of the mitochondrial membrane potential maintenance and electron transport chain function in HC (upper quadrants) compared to probands’ (lower quadrants) mitochondria. (d-f) Mitochondrial dynamics: (d) Quantification box charts depicting average length of all mitochondrial rod and branches and (e) average number of branches analyzed in individual fibroblasts from HC’ (gray boxes), probands’ (orange boxes) and unaffected carriers’ (yellow boxes) fibroblasts. (f) Representative images of mitochondrial shape and dynamics in one unaffected carrier (B-II-1), one proband (B-II-3) and one HC (HC2). In (d) and (e) each dot represents a cell and total number of cells (n; shown in brackets) analyzed in 3–9 independent experiments (N). Non-parametric Kruskal-Wallis ANOVA with post-hoc Dunn’s test for each group. *p < 0.05, **p < 0.01, ***p < 0.001 compared to control HC1; # p < 0.05, ## p < 0.01, ### p < 0.001 compared to control HC2. Scale bar = 20 μm. (g-h) Mitophagy: (g) Basal mitophagy rate assessed as co-localization of LysoTracker Red DND-99 with MitoTracker Green in HC (gray bars), probands’ (orange bars) and unaffected carriers’ (yellow bars) fibroblasts. (h) Mitophagy rate after induction with either lactate or pyruvate. In (g) and (h) each dot represents the number of cover slips (n; shown in brackets) from 3–6 independent culturing conditions (N). Non-parametric Kruskal-Wallis ANOVA with post-hoc Dunn’s test for each group. Data are presented as mean ± standard error of the mean (SEM). *p < 0.05, **p < 0.01, ***p < 0.001, ns = not statistically significant.
Figure 5.
Figure 5.. Effects of pan-neuronal psmf1 knockdown in Drosophila.
(a) Setup for comparative climbing test of three different Drosophila RNA interference (RNAi) lines (nsmase, prkn, psmf1) with prkn used as positive control (significant motor impairment) and nsmase as a negative control (no motor impairment). H. sapiens and Drosophila orthologues: PRKN (H. sapiens)/prkn (Drosophila); PSMF1 (H. sapiens)/psmf1 (Drosophila); SMPD2 (H. sapiens)/nsmase (Drosophila). (b) Climbing test performed at Days 10, 20 and 35 after eclosure represented as percentage of flies that did not reach the 5-cm tube threshold. Significant motor defect was observed at Day 35 after eclosure for the psmf1 and prkn lines compared to the negative control nsmase. Analyses are χ² (chi-squared) tests. ***p < 0.0005. (c) Whole-brain mitochondrial membrane potential. (c-i) Representative images of TMRM fluorescence in whole brain preparations from 35 days post-eclosure psmf1- and control nsmase-knockdown flies (scale bar = 50 μM). (c-ii) Quantification of mean TMRM fluorescence within region of interests (ROIs) encompassing the whole central brain. N values are number of brains. Analysis is Mann-Whitney U-test. ***p < 0.0005. (d-i) Schematic showing the location of dopaminergic neuron clusters in the adult Drosophila brain: PPM1–3, protocerebral posterior medial clusters 1–3; PPL1–2c, protocerebral posterior lateral clusters 1–2c. (d-ii) Representative image of anti-TH immunostaining in a control (nsmase-knockdown, 5 days after eclosure) brain, with the same neuronal clusters indicated (scale bar = 50 μM). Total number of TH+ cell bodies in young (5–7 days after eclosure) (e-i) and aged (40 ± 5 days after eclosure) (f-i) brains. N values are number of brains. Analysis is unpaired t-test. **p < 0.005. (e-ii, f-ii) Representative images of anti-TH immunostaining in the indicated genotype (scale bar = 50 μM), with enlarged sections showing PPM3 clusters (scale bar = 20 μM). (e-iii, f-iii) Number of TH+ cell bodies in indicated clusters per hemisphere (i.e. two data points per brain). Indicated n values are number of brains. Analyses are Mann-Whitney tests within clusters, with False Discovery Rate correction for multiple comparisons. *q < 0.05.
Figure 6.
Figure 6.. Behavioral tests and neuropathology in mice with conditional Psmf1 inactivation.
(a) Psmf1fl/fl UBC-Cre-ERT2/+ Ai14/+ brains post perfusion (28 days after injection of tamoxifen or corn oil as a control). Tamoxifen-induced recombination induced tdTomato (red) expression and marked cells in which Psmf1 was inactivated (Supplementary File 9). Successful tamoxifen-induced recombination was macroscopically assessed based on the color of dissected mouse brains, which appeared dark pink in mice with severe motor deficit in the rotarod assay (m6, m9) and light pink in mice with mild to no motor deficit in the rotarod assay (m1, m5) compared to controls (ctrl1, ctrl2), which reflected high (~90%) or low (30–50%) recombination rates, respectively. Psmf1fl/fl Ai14 UBC-Cre-ERT2 mice were injected with either corn oil (control) or tamoxifen to induce Cre recombination of floxed Psmf1 exon 3 for loss of Psmf1 and a floxed stop cassette in Ai14 for expression of tdTomato to evaluate recombination efficiency. Mice were sacrificed 28 days post injection. (b) Quantification of Psmf1 protein levels in mice. Western blot analysis for Psmf1 and Gapdh of whole brain extracts from mice 20 days post tamoxifen injection for high recombination rate. Less than 6% Psmf1 remains in tamoxifen-injected Cre mice. Quantification of Western blots by densitometry, n = 4 Psmf1fl/fl, n = 3 Psmf1fl/fl UBC-Cre-ERT2. T-test, ****p < 0.0001. (c–d) Rotarod assay. In the rotarod assay, mice with high recombination rates (~90%) developed severe motor deficits (light blue line in (c) and light blue bar in (d), whereas the motor performance of mice with low (30–50%) recombination rates was mildly or not impaired (green line in (c) and green bar in (d)). Panel (c) shows single rotarod trials for individual mice on each day. X-axis indicates days of testing after the initial four-day training period. Day 1 corresponds to Day 14 after tamoxifen injection. In panel (d), each bar represents the average of three trials for a mouse on Day 25 post tamoxifen injection (i.e., 12 days after the initial four-day training period). Error bars indicate standard deviations. One-way ANOVA with Tukey post-hoc test. n = 6 Psmf1fl/fl Ai14/+ corn oil, n = Psmf1fl/fl Ai14/+ tamoxifen, n = 12 Psmf1fl/fl Ai14/+ UBC-Cre-ERT2/+ corn oil, n = 6 Psmf1fl/fl Ai14/+ UBC-Cre-ERT2/+ tamoxifen low recombination rate, and n = 8 Psmf1fl/fl Ai14/+ UBC-Cre-ERT2/+ tamoxifen high recombination rate. **p < 0.01, ***p < 0.001, **p < 0.0001. (e) Dark/light open field assay. Mice with high recombination rates (~90%, fourth subgroup) strongly avoided walking in the open field, which reflects severe anxiety-related behavior. In contrast, the motor performance of mice with low recombination rates (30–50%, third subgroup) was comparable to controls. One-way ANOVA with Tukey post-hoc test. n = 24 Psmf1fl/fl Ai14/+ tamoxifen, n = 6 Psmf1fl/fl Ai14/+ UBC-Cre-ERT2/+ tamoxifen low recombination rate, and n = 5 Psmf1fl/fl Ai14/+ UBC-Cre-ERT2/+ tamoxifen high recombination rate. **p < 0.01, ***p < 0.001, ****p < 0.0001. (f) Sagittal brain sections stained with either Iba1 (green) for microglia or GFAP for glia (astrocytes) and with Hoechst 33342 for nuclei (blue). TdTomato (red) fluorescence indicates recombination efficiency. (i) In the deep cerebellar nuclei (DCN), reactive microglia in tamoxifen-induced mice indicated gliosis induction. Scale bar = 100 μm. (ii) Higher magnification in the DCN shows morphologically distinct ramified microglia with more amoeboid appearance upon loss of Psmf1. Scale bar = 20 μm. (iii) In the DCN of tamoxifen-induced mice, we observe an increase in glia staining strongly for GFAP in the DCN, a marker for astrogliosis (of note, GFAP also stains the Bergmann glia in the molecular layer). Scale bar = 100 μm. (iv) Higher magnification image of (iii). Scale bar = 20 μm. (g) Quantification of percent area positive for signal of either GFAP or Iba1 staining in the DCN. T-test, n = 3 Psmf1fl/fl Ai14/+ UBC-Cre-ERT2/+ corn oil and n = 3 Psmf1fl/fl Ai14/+ UBC-Cre-ERT2/+ tamoxifen. *p < 0.05, ***p < 0.001.

References

    1. Poewe W. et al. Parkinson disease. Nature Reviews Disease Primers 3, 17013 (2017). - PubMed
    1. Dorsey E.R., Sherer T., Okun M.S. & Bloem B.R. The Emerging Evidence of the Parkinson Pandemic. J Parkinsons Dis 8, S3–S8 (2018). - PMC - PubMed
    1. Trevisan L. et al. Genetics in Parkinson’s disease, state-of-the-art and future perspectives. Br Med Bull 149, 60–71 (2024). - PMC - PubMed
    1. Morris H.R., Spillantini M.G., Sue C.M. & Williams-Gray C.H. The pathogenesis of Parkinson’s disease. Lancet 403, 293–304 (2024). - PubMed
    1. Smolders S. & Van Broeckhoven C. Genetic perspective on the synergistic connection between vesicular transport, lysosomal and mitochondrial pathways associated with Parkinson’s disease pathogenesis. Acta Neuropathol Commun 8, 63 (2020). - PMC - PubMed

Publication types

LinkOut - more resources