[Preprint]. 2024 Aug 8:2024.08.07.24310974.
doi: 10.1101/2024.08.07.24310974.

Linoleoyl-lysophosphatidylcholine suppresses immune-related adverse events due to immune checkpoint blockade

Affiliations

Linoleoyl-lysophosphatidylcholine suppresses immune-related adverse events due to immune checkpoint blockade

Ian T Mathews et al. medRxiv. .

Abstract

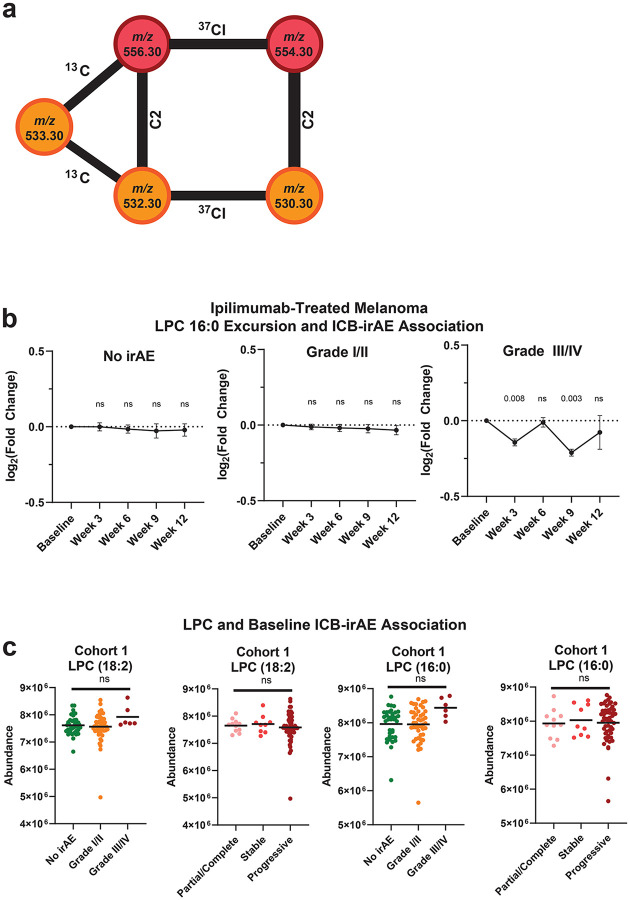
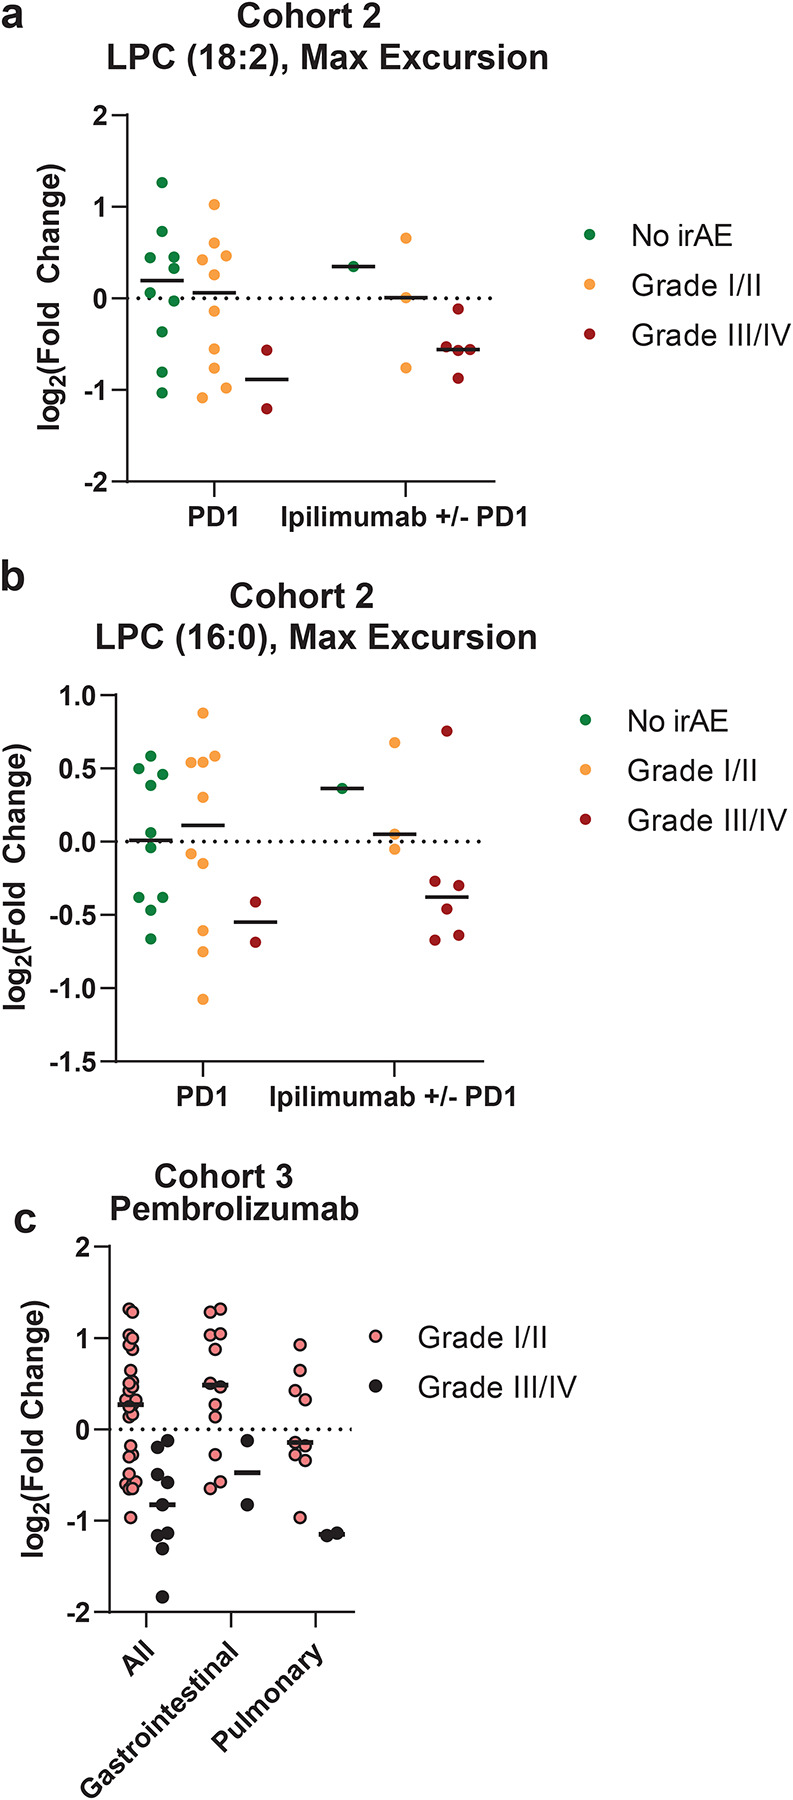
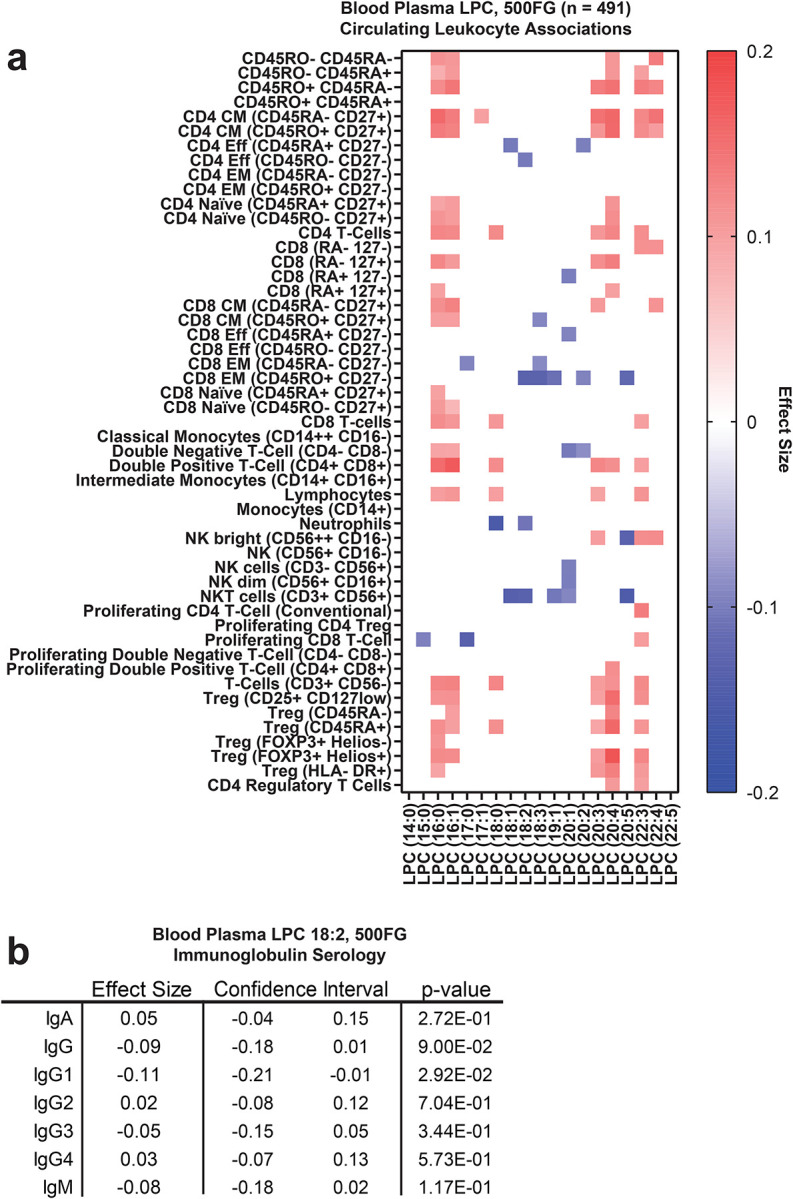
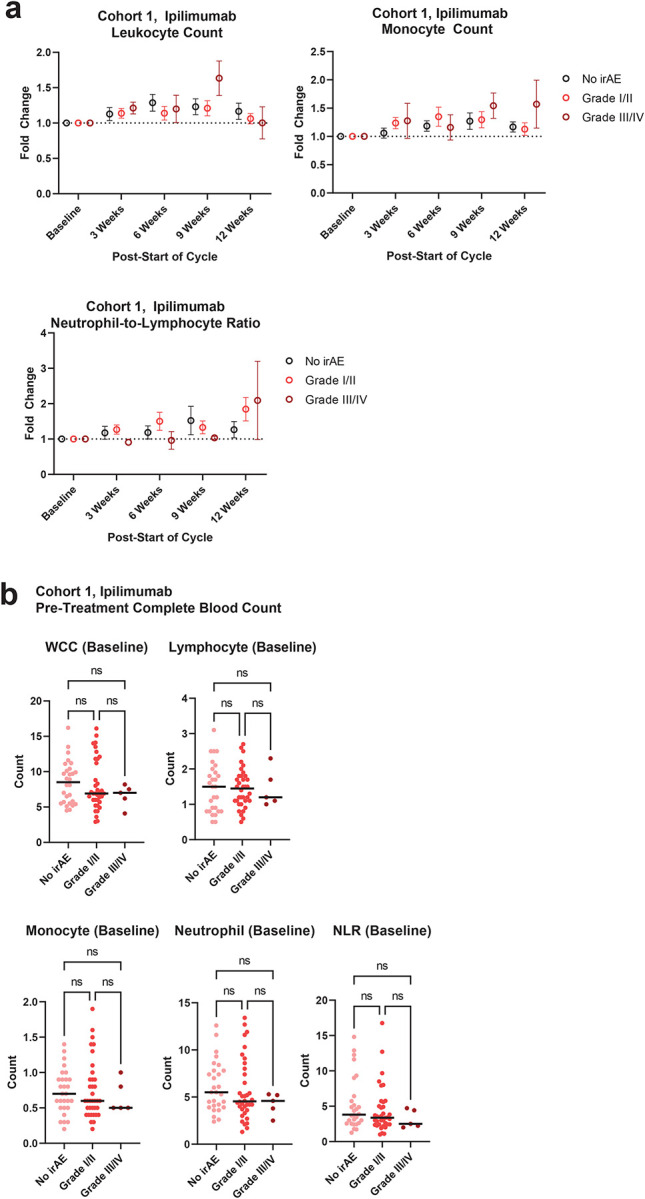
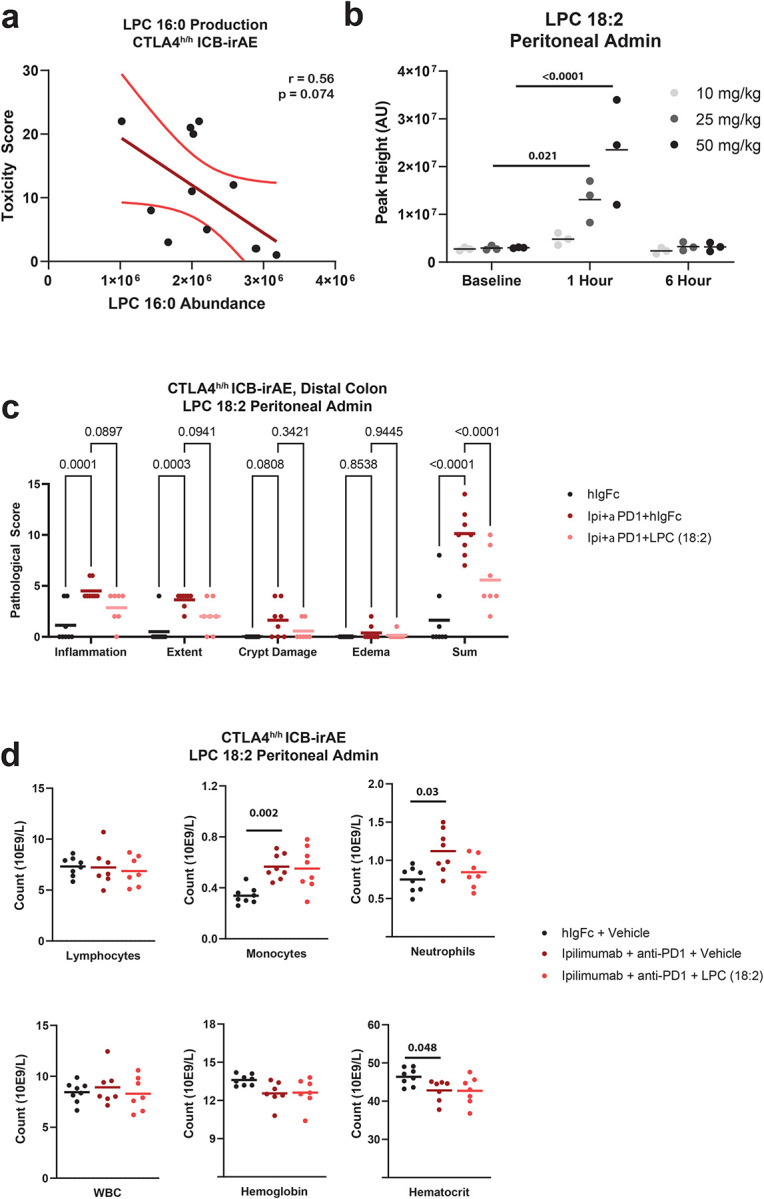
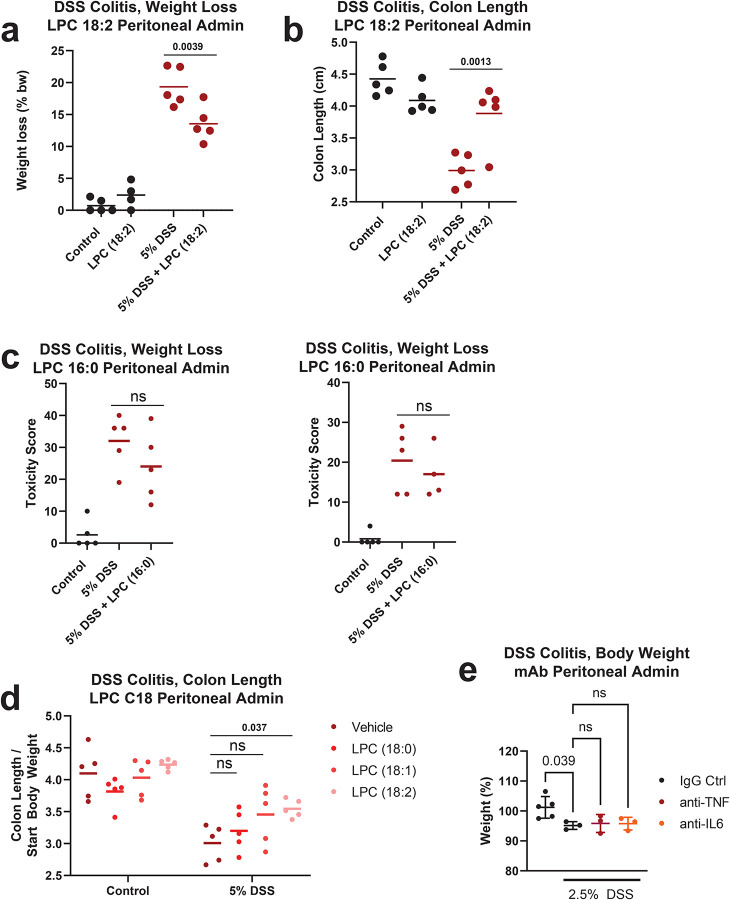
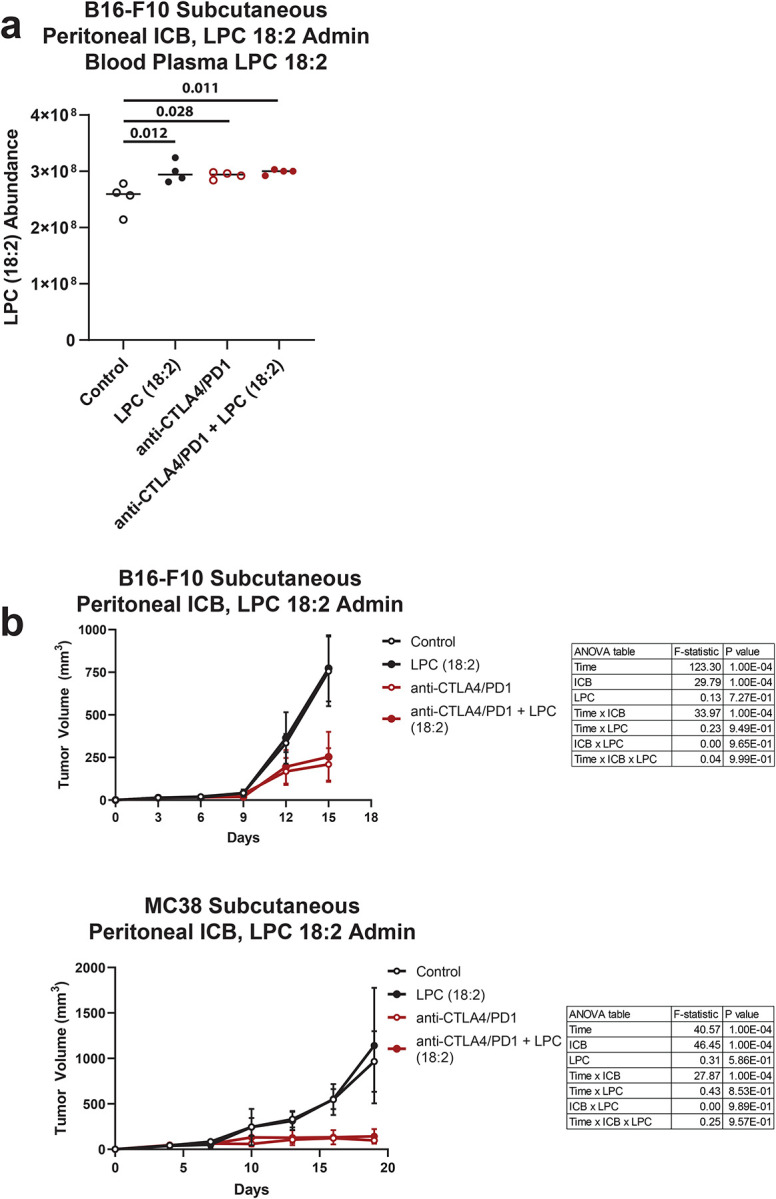
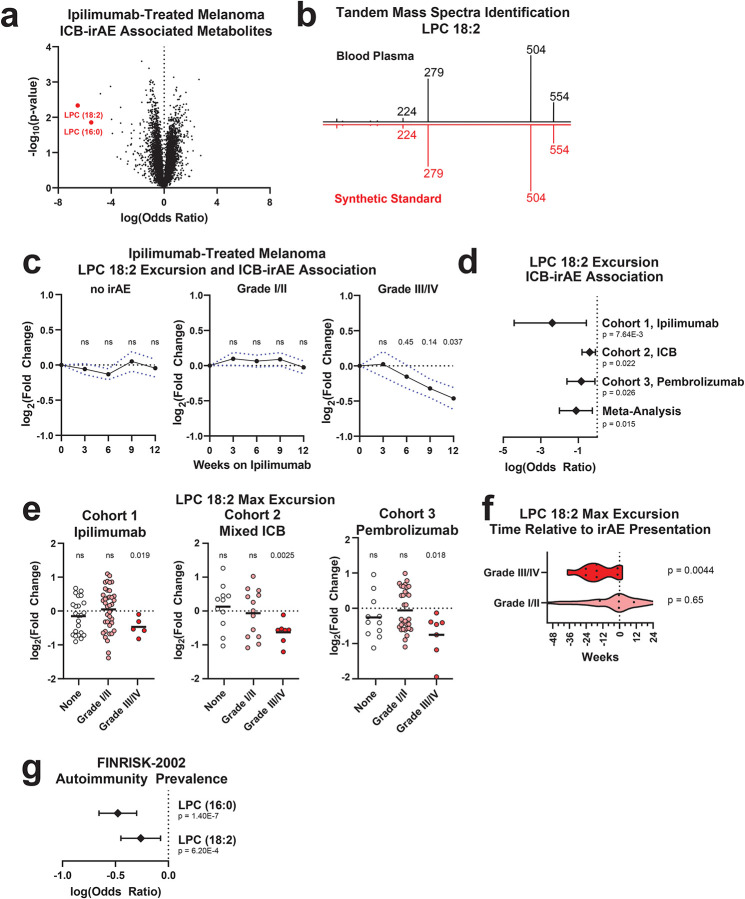
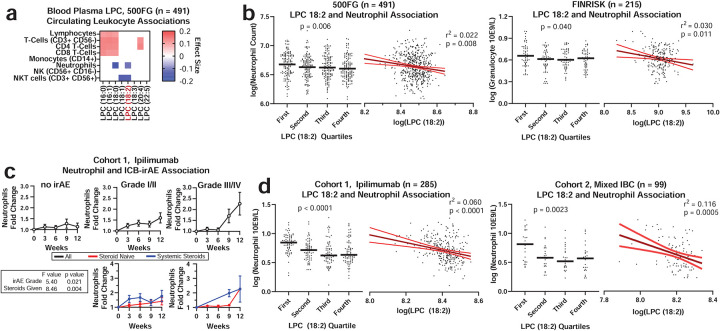
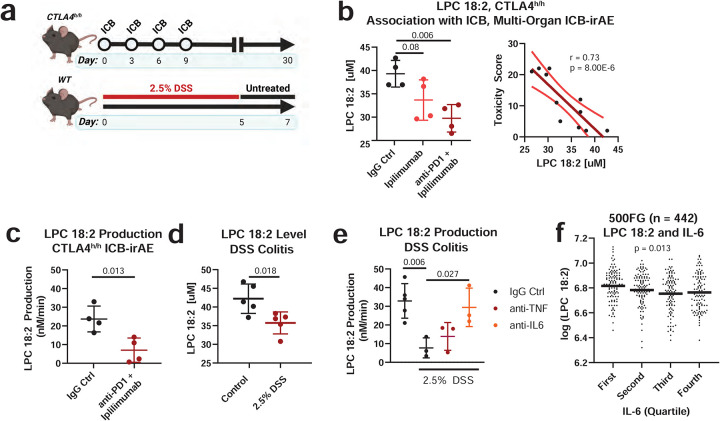
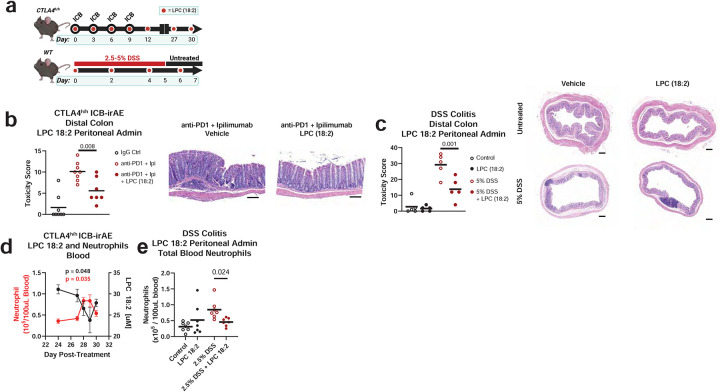
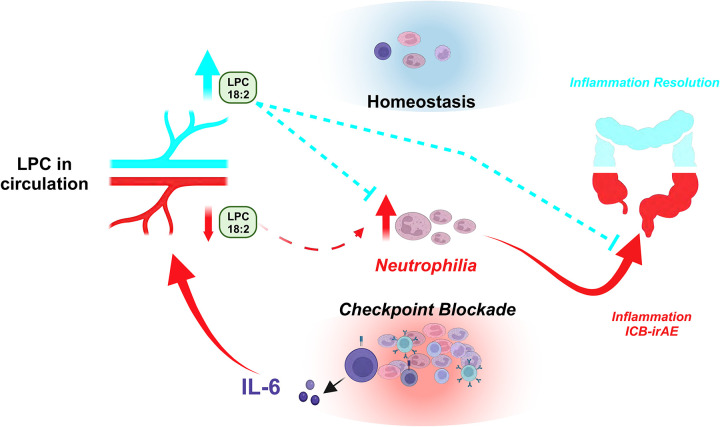
Immune related adverse events (irAEs) after immune checkpoint blockade (ICB) therapy occur in a significant proportion of cancer patients. To date, the circulating mediators of ICB-irAEs remain poorly understood. Using non-targeted mass spectrometry, here we identify the circulating bio-active lipid linoleoyl-lysophosphatidylcholine (LPC 18:2) as a modulator of ICB-irAEs. In three independent human studies of ICB treatment for solid tumor, loss of circulating LPC 18:2 preceded the development of severe irAEs across multiple organ systems. In both healthy humans and severe ICB-irAE patients, low LPC 18:2 was found to correlate with high blood neutrophilia. Reduced LPC 18:2 biosynthesis was confirmed in preclinical ICB-irAE models, and LPC 18:2 supplementation in vivo suppressed neutrophilia and tissue inflammation without impacting ICB anti-tumor response. Results indicate that circulating LPC 18:2 suppresses human ICB-irAEs, and LPC 18:2 supplementation may improve ICB outcomes by preventing severe inflammation while maintaining anti-tumor immunity.


Figures

Extended Data 1.
Extended Data 1.. LPC 18:2 and LPC 16:0 association with ipilimumab-treated melanoma patient outcomes.
(a) Tandem mass spectral chemical network of 5 irAE-associated LC-MS features corresponding to [M+Cl] adducted LPC 18:2 and LPC 16:0. (b) Excursion of LPC (16:0) in cohort 1 ipilimumab treated patient blood plasma (n = 65). Error = SEM. (c) Concentration of LPC 18:2 and LPC (16:0) in baseline sampling from cohort 1.
Extended Data 2.
Extended Data 2.. LPC 18:2 and LPC 16:0 excursion in different ICB regimens.
(a-b) Maximum excursion of LPC 18:2 (a) and LPC 16:0 (b) in cohort 2, broken out by anti-PD-1 monotherapy or anti-PD-1 combination ipilimumab (n=65). (c) Maximum excursion of LPC 18:2 in cohort 3 among patients with ICB-irAE, bars = mean. One-sided Student’s t-test (Extended Data 2c).
Extended Data 3.
Extended Data 3.. LPC associations with immune signatures in 500FG and FINRISK 2002 community-dwelling cohorts.
(a) Heat map of LPC associations with immune cellularity by multi-color flow cytometry in 500FG (n = 488). Color = effect size with p < 0.05. (b) Circulating LPC 18:2 associations by linear regression with serum immunoglobulin titers in 500FG (IgG [7.00–16.00 gram/Liter]; IgA [0.70–4.00 gram/Liter]; IgM [0.40–2.30 gram/Liter]; IgG1 [4.90–11.40 gram/Liter]; IgG2 [1.50–6.40 gram/Liter]; IgG3 [0.20–1.10 gram/Liter]; IgG4 [0.08–1.40 gram/Liter].
Extended Data 4.
Extended Data 4.. Immune cell numbers in the blood of ipilimumab-treated melanoma patients.
(a) Lymphocyte, monocyte, and neutrophil-to-lymphocyte ratio fold changes by blood analyzer in cohort 1 ipilimumab-treated patients. Error = SEM (b) Immune cell counts by blood analyzed in cohort 1 baseline sampling. Bar = mean.
Extended Data 5.
Extended Data 5.. LPC loss and supplementation in CTLA-4h/h mice.
(a) Scatter plot of composite toxicity score in CTLA-4h/h mice with matched LPC (16:0) concentration in terminal blood. Error = 95% CI. n = 12 (b) Blood plasma LPC 18:2 concentration following single dose intraperitoneal supplementation in C57BL/6 mice. Bar = mean. n = 3 per group. (c) Toxicity scoring by four criteria in CTLA-4h/h mice. Bar = mean. n = 7–8 per group. (d) Blood analysis by complete blood count in Day 30 CTLA-4h/h mice. Bar = mean. n = 7–8 per group. One-way ANOVA with Dunnett’s multiple comparisons test (Extended Data 5b, 5d); two-way ANOVA with Tukey’s multiple comparisons test (Extended Data 5c).
Extended Data 6.
Extended Data 6.. Loss and supplementation of LPC in DSS colitis mice.
(a-b) Percent weight loss (a) and colon length relative to starting body weight (b) in 5% DSS treated mice following LPC 18:2 supplementation. n = 5 per group. Bar = mean. (c) Toxicity score in cecum and distal colon of 5% DSS treated mice following LPC (16:0) supplementation. n = 5 per group. Bar = mean. (d) Colon length relative to starting body weight in 5% DSS treated mice following supplementation with saturated and unsaturated C18-LPCs. n = 5 per group. Bar = mean. (e) Percent baseline weight in C57BL/6 mice receiving 2.5% DSS treated with 100ug control IgG, 100ug anti-TNF, or 100ug anti-IL-6 for 6 hours. n = 3–5 per group, Error = SD. Bar = mean. One-way ANOVA with Dunnett’s multiple comparisons test (Extended Data 6a); two-way ANOVA with Sidak’s multiple comparisons test (Extended Data 6d–e).
Extended Data 7.
Extended Data 7.. LPC 18:2 supplementation and ICB response in syngeneic tumor models.
(a) LPC 18:2 abundance in terminal blood plasma from C57BL/6 mice bearing B16-F10 subcutaneous melanoma. n = 4 per group. Bar = mean. (b) B16-F10 or MC38 tumor volume following LPC 18:2 supplementation and anti-mouse CTLA-4 + anti-mouse PD-1 intraperitoneal treatment. n = 5 per group. Bar = mean. One-way ANOVA with Dunnett’s multiple comparisons test (Extended Data 7a); two-way ANOVA with Tukey’s multiple comparisons test (Extended Data 7b).
Extended Data 8.
Extended Data 8.. Flow cytometry gating scheme for neutrophils.
(a) Strategy for gating mouse neutrophils (CD45+, CD11b+, Ly6G+).
Figure 1.
Figure 1.. Identification of circulating lysolipids depleted after development of ICB irAEs and autoimmunity.
(a) Volcano plot of irAE severity logistic regressions in ipilimumab-treated melanoma patients (cohort 1, n = 65), denoting maximum excursion (change) from baseline samples of 5951 ubiquitous, bioactive lipid metabolites. Metabolites corresponding to LPC 18:2 and LPC (16:0) (red) are highlighted. Odds ratio normalized to a natural logarithm. (b) Tandem mass spectra of m/z 554.3019, corresponding to LPC 18:2 [M+Cl]. (c) Mean excursion of LPC 18:2 in cohort 1, error = SEM. (d) Forest plots of natural log odds ratio of irAE severity for LPC 18:2. Error = 95% CI. (e) Maximum excursion of LPC 18:2 in three cohorts of ICB-treated patients, bars = mean. (f) Time of maximum LPC 18:2 excursion from baseline sampling relative to reported irAE date in cohort 3. (g) Natural log odds ratio of prevalent autoimmune pathologies in FINRISK-2002 (case: n = 158, control: n = 1712). Error = 95% CI. Logistic regression with patient age, patient sex as covariates (Fig 1a, 1d, 1g); one-sided Student’s T-test (Fig 1c, 1e–f).
Figure 2.
Figure 2.. LPC 18:2 concentrations inversely correlate with neutrophil cellularity in the blood of healthy humans and ICB irAE patients.
(a) Significant associations by linear regression between LPC 18:2 and lymphoid and myeloid populations in matched blood from healthy individuals (500FG, n = 491, filled color indicates p = 0.05 following Bonferroni multiple hypothesis correction, blue negative correlation, red positive). (b) Quartiles and scatter plots of LPC 18:2 concentration and neutrophil counts as measured by multi-color flow cytometry (500FG, left) or by blood analyzer (FINRISK-2002, right). Bars = mean, black line = linear regression, red lines = standard deviation. (c) Fold change of neutrophil counts relative to baseline sampling in cohort 1 ipilimumab treated melanoma patients, all (top) and stratified by corticosteroid administration (bottom). Error = SEM. (d) Quartiles and scatter plots of LPC 18:2 concentration and neutrophil counts in ICB cohort 1 and cohort 2. Bars = mean. Linear regression with patient age, patient sex as covariates (Fig 2a); One-way ANOVA with test for linear trend (Fig 2b, 2d); two-way ANOVA of linear model with patient age, patient sex as covariates (Fig 2c). Significance derived from linear regression including patient and timepoint as covariates to control for internal correlation.
Figure 3.
Figure 3.. LPC 18:2 biosynthesis is impaired in mouse models of ICB irAEs and colitis.
(a) Diagram of experimental design for CTLA-4h/h model of ICB-irAE and DSS colitis. (b) LPC 18:2 concentration in terminal blood of CTLA-4h/h C57BL/6 mice treated with 100 ug anti-human IgG1 isotype control (hIgFc), 100 ug ipilimumab (Ipi), or 100 ug ipilimumab + 100 ug anti-mouse PD-1 monoclonal antibody (Ipi + anti-PD-1). n = 4 per group. Error = SD. Bar = mean. Right: correlation plot of LPC 18:2 concentration to pathology score. Linear regression in dark red, 95% confidence interval in light red. (c) LPC 18:2 rate of production from blood plasma on Day 28 after ipilimumab + anti-PD-1 therapy CTLA-4h/h mice. n = 4 per group. Error = SD. Bar = mean. (d) LPC 18:2 concentration in terminal blood of 2.5% DSS-treated C57BL/6. n = 5 per group. Error = SD. Bar = mean. (e) De novo LPC 18:2 production in terminal blood of 2.5% DSS mice treated with 100ug control IgG, 100ug anti-TNF, or 100ug anti-IL-6 for 6 hours. n = 3–5 per group, Error = SD. Bar = mean. (f) Quartiles of IL-6 cytokine (pg/mL) and LPC 18:2 concentration in 500FG. Bars = mean. Student’s T-test (Fig. 3c, Fig. 3d), one-way ANOVA with Dunnett’s multiple comparisons test (Fig. 3b, Fig. 3e, Fig 3f).
Figure 4:
Figure 4:. LPC 18:2 supplementation reduces colitis and neutrophilia.
(a) Diagram of experimental design for LPC 18:2 intraperitoneal administration in ICB-treated CTLA-4h/h mice and DSS colitis. (b) Histology score and representative H&E staining in distal colon of CTLA-4h/h mice following intraperitoneal administration of 100 ug anti-human IgG1 isotype control (hIgFc) or 100 ug ipilimumab + 100 ug anti-mouse PD-1 monoclonal antibody (ICB), dosed as above, n = 7–8 per group. Error = SD, Bar = mean, ruler = 100μm (c) Histology score and representative H&E staining in distal colon of DSS-treated mice. LPC 18:2 was administered at 25 mg/kg on Days 0, 2, 4, and 6 of DSS treatment. n = 5 per group. Bar = mean, ruler = 200μm. (d) Mean LPC 18:2 concentration and neutrophil (CD45+, CD11b+, Ly6G+) numbers in CTLA-4h/h mouse blood. n = 5 per group. Error = SEM. (e) Multi-color flow cytometry of blood neutrophils in 2.5% DSS-colitis mice following treatment with 25 mg/kg of LPC 18:2. One-way ANOVA with Dunnett’s multiple comparisons test (Fig. 4b); two-way ANOVA with Sidak multiple comparisons test (Fig. 4c, 4e).
Figure 5.
Figure 5.. LPC 18:2 suppresses irAEs by regulating peripheral neutrophil homeostasis.
Schematic representation of irAEs in ICB patients, which are linked to changes in peripheral LPC 18:2 biosynthesis.

References

    1. Postow M.A., Sidlow R. & Hellmann M.D. Immune-Related Adverse Events Associated with Immune Checkpoint Blockade. N Engl J Med 378, 158–168 (2018). - PubMed
    1. Krieg C., et al. High-dimensional single-cell analysis predicts response to anti-PD-1 immunotherapy. Nat Med 24, 144–153 (2018). - PubMed
    1. Wolchok J.D., et al. Overall Survival with Combined Nivolumab and Ipilimumab in Advanced Melanoma. The New England journal of medicine 377, 1345–1356 (2017). - PMC - PubMed
    1. Hodi F.S., et al. Combined nivolumab and ipilimumab versus ipilimumab alone in patients with advanced melanoma: 2-year overall survival outcomes in a multicentre, randomised, controlled, phase 2 trial. Lancet Oncol 17, 1558–1568 (2016). - PMC - PubMed
    1. Wang D.Y., et al. Fatal Toxic Effects Associated With Immune Checkpoint Inhibitors: A Systematic Review and Meta-analysis. JAMA Oncol 4, 1721–1728 (2018). - PMC - PubMed

Publication types

LinkOut - more resources