[Preprint]. 2024 Sep 25:2024.08.02.24311426.
doi: 10.1101/2024.08.02.24311426.

Transitions in lung microbiota landscape associate with distinct patterns of pneumonia progression

Affiliations

Transitions in lung microbiota landscape associate with distinct patterns of pneumonia progression

Jack T Sumner et al. medRxiv. .

Abstract

The precise microbial determinants driving clinical outcomes in severe pneumonia are unknown. Competing ecological forces produce dynamic microbiota states in health; infection and treatment effects on microbiota state must be defined to improve pneumonia therapy. Here, we leverage our unique clinical setting, which includes systematic and serial bronchoscopic sampling in patients with suspected pneumonia, to determine lung microbial ecosystem dynamics throughout pneumonia therapy. We combine 16S rRNA gene amplicon, metagenomic, and transcriptomic sequencing with bacterial load quantification to reveal clinically-relevant pneumonia progression drivers. Microbiota states are predictive of pneumonia category and exhibit differential stability and pneumonia therapy response. Disruptive forces, like aspiration, associate with cohesive changes in gene expression and microbial community structure. In summary, we show that host and microbiota landscapes change in unison with clinical phenotypes and that microbiota state dynamics reflect pneumonia progression. We suggest that distinct pathways of lung microbial community succession mediate pneumonia progression.


Conflict of interest statement

Competing Interests The authors declare no competing interests.

Figures

Figure 1.
Figure 1.. Multiomics of the lung microbial ecosystem during pneumonia reveals diverse associations with clinical features.
(A) UpSet plot of multiomics sampling at the same time-point. Colors distinguish sample as either a baseline or follow-up BAL. (AMP = 16S rRNA gene amplicon, MGX = metagenomic, MTX = metatranscriptomic [including host-transcriptomics]) (B) Demographics of the SCRIPT cohort. Selected metadata features to provide quantitative overview of patient demographics. (- = negative binned clinical outcome [e.g., patient expires], + = positive binned clinical outcome [e.g., patient discharged and sent home]) (C) Principle coordinate analysis of the weighted UniFrac distance metric derived from amplicon profiles (genus-level). Colors are indicative of pneumonia category. Gray dots in the background are the shadow of all the points as if they were shown in a single plot rather than in small multiples. Percentages on axes are the variance explained by the given principle coordinate. See Figure S3 for remaining profiles. (HAP = hospital acquired pneumonia, VAP = ventilator-associated pneumonia, CAP = community acquired pneumonia, NP = critically-ill non-pneumonia control.) (D) Permutational multivariate analysis of variance analysis (PERMANOVA) quantifies the amount of variance in distance space explained by a given metadata features (e.g., pneumonia category) and tests for significance association. Percentages and color represent variance explained (R2). Columns are the different multiomic profiles. Bracketed numbers on right of y-axis metadata labels represent degrees of freedom. Significant association with high variance explained indicates metadata features as drivers of variation in the gene-expression or microbiota landscape. Features were nominally grouped into 6 categories: cellular biomarkers (CB), patient hallmarks (PH), clinical hallmarks (CH), disease (D), intrinsic biomarkers (IB), and an all (A) category for individuals. (* FDR P < 0.05, ** FDR P < 0.01, *** FDR P < 0.001; MDNP score = mean dissimilarity to non-pneumonia, PEEP = positive-end expiratory pressure, FiO2 = fraction of inspired oxygen, Binned Outcome = positive or negative discharge status as in (B)). (E) Shannon diversity of different multiomics profiles. 16S rRNA gene amplicon sequencing profiles include: Amplicon (genus-level) and Amplicon ASV (ASV-level); shotgun metagenomic profiles include: DNA [KO] (gene-content based on KEGG orthology terms), DNA [Taxonomy] (species-level), and DNA [Viral] (putative bacteriophages); and transcriptomic profiles include: RNA [Host Transcriptomics] (alveolar macrophage gene-transcript-expression), RNA [Taxonomy MPA] (species-level using MetaPhlAn4). (Boxplot configuration: Center line = median, box limits = upper and lower quartiles, whiskers = 1.5x interquartile range, points = outliers.)
Figure 2.
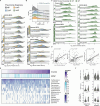
Figure 2.. Pneumonia infection associates with an altered microbiota landscape indicative of aspiration-mediated disruption.
(A) Abundance of the top differentially abundant (FDR P < 0.05) genes, species, and bacterial genera in each pneumonia category (i.e., HAP, VAP, CAP) relative to NP. Bar plots are the proportion of samples with zero-count therefore showcasing feature prevalence; bars are scaled such that touching the correspondingly colored line above indicates the feature was undetected in all samples for that group. Kernel distributions were calculated based on the subset of samples with detectable abundance after centering by the median and log2 transformation; heights are scaled by the proportion of detectable samples. Genes include their KEGG orthology term. (* FDR P < 0.05, ** FDR P < 0.01, *** FDR P < 0.001). (B) Distribution of the mean dissimilarity to non-pneumona (MDNP) score quantifying microbiome disruption relative to non-pneumonia control group. Score is calculated using the weighted UniFrac distance from amplicon profiles. The 90th percentile of MDNP score within NP was used as a threshold to determine microbiota disruption in patients with pneumonia. (C) Abundance of the top differentially abundant (FDR P < 0.05) genes, species, and bacterial genera in disturbed microbial communities (>90th) relative to communities with structure typical of NP (<90th). Microbiome samples were binned into typical and disturbed subsets based on the 90th percentile of MDNP score. Above this threshold, there is a 10% chance of a patient without pneumonia to have that particular arrangement of microbiota. (D) Relationship between bacterial load, amylase activity, and MDNP score. Shaded region represents 95% confidence interval. Statistics show Spearman rank correlation test. (E) Top differentially abundant genera (amplicon); samples ordered by increasing levels of amylase activity. (F) Distribution of bacterial load, amylase activity, and MDNP score binned by culture results and antibiotic usage at time of BAL. Stars represent statistical significance as determined by Wilcoxon test. (* FDR P < 0.05, ** FDR P < 0.01, *** FDR P < 0.001; Boxplot configuration: Center line = median, box limits = upper and lower quartiles, whiskers = 1.5x interquartile range, points = outliers.). Acronyms: HAP = hospital acquired pneumonia, VAP = ventilator-associated pneumonia, CAP = community acquired pneumonia, NP = critically-ill non-pneumonia control.
Figure 3.
Figure 3.. A posteriori identification of pneumotypes suggests stabilizing selective forces canalize community structure.
(A) Ordination of weighted UniFrac distance derived from genus-level amplicon profiles. Colors represent the different microbiota states of the distal lung (i.e., pneumotypes) identified using cluster analysis. Percentages represent variance explained by the given principle coordinate axis. (B) Summary heatmap visualizing the mean cluster consensus score. Consensus clustering implementing the partition around medoids cluster algorithm was performed to determine number of groups evident in the weighted UniFrac distance space. (C) Trade-offs in diversity (Wilcoxon test) and (D) core phyla differentiate pneumotypes. (E) Most abundant taxa distinguish microbiota states. Taxa with a mean normalized abundance greater than 0.05 were selected (n=12). Stars represent the adjusted p-value of differential abundance analysis comparing pneumotypeM, pneumotypeSP, and pneumotypeOL to pneumotypeSL. (F) Bacterial biomass, (G) amylase levels, (H) MDNP score, (I) and neutrophil abundance differ significantly between microbiota states. Pairwise comparisons show results of Wilcoxon test with Benjamini-Hochberg correction. (J) Heatmaps visualizing pneumotype frequency across pneumonia category (limited to baseline BAL) and (K) clinical outcome (includes baseline and follow-up BAL). Numbers in heatmaps are the count of BAL in each section; color of tiles is the proportion for that column. Stars represent the adjusted p-value of two-sided pairwise exact binomial tests used to determine deviations from expected distributions (i.e., evenly distributed across the column). Pneumonia therapy outcome is categorized as successful (+), indeterminate (+/−), and unsuccessful (−) treatment. (L) Frequency of transitions between pneumotypes. Nodes (circles) represent the different pneumotypes and the circle size is scaled to the number of samples. Edges (arrows) represent transitions between pneumotypes. Edge labels are the frequency of transitions between pneumotypes accounting for transition to outcome (i.e., final BAL are counted as transitioning to clinical outcome rather than to any pneumotype). (* FDR P < 0.05, ** FDR P < 0.01, *** FDR P < 0.001; Pneumonia diagnosis: HAP = hospital acquired pneumonia, VAP = ventilator-associated pneumonia, CAP = community acquired pneumonia, NP = critically-ill non-pneumonia control; Pneumotypes: SL = skin-like, M = mixed, SP = Staphylococcus predominant, OL = oral-like; Pneumonia outcome: - = unsuccessful treatment, + = successful treatment, +/− = indeterminate treatment; Boxplot configuration: Center line = median, box limits = upper and lower quartiles, whiskers = 1.5x interquartile range, points = outliers.)
Figure 4.
Figure 4.. The lung microbial ecosystem is complex and rich with interactions across ecosystem components.
Network visualization of associated omics features identified from HAllA. Edges are associations colored by Spearman rank correlation (red for positive and blue for negative); nodes are data features (e.g., genera, genes). Prevalent positive associations are observed between Streptococcus species and other oral microbiota (Rothia spp., Gemella spp.). Other major hubs include Staphylococcus and Cutibacterium. Cutibacterium negatively associates with many features including the expression of several host genes. Multiomics data integration includes feature profiles from four data types: shotgun metagenomic (taxonomic, functional KO profiles), 16S rRNA gene sequencing, and macrophage-sorted bulk RNA-sequencing (host transcriptomics, metatranscriptomic). Top significant associations from each dataset comparison are visualized (FDR P < 0.05). Nodes with at least 10 significant associations are highlighted in the network as hubs with slightly larger sizes. Nodes high in one pneumotype are colored accordingly (see methods for details). Features that were high in multiple groups or no groups were kept as gray. See Figure S7 for a fully labeled network diagram.

References

    1. Dickson R. P., Erb-Downward J. R., and Huffnagle G. B. (2014). Towards an Ecology of the Lung: New Conceptual Models of Pulmonary Microbiology and Pneumonia Pathogenesis. The lancet. Respiratory medicine 2, 238–246. 10.1016/S2213-2600(14)70028-1. - DOI - PMC - PubMed
    1. Carney S. M., Clemente J. C., Cox M. J., Dickson R. P., Huang Y. J., Kitsios G. D., Kloepfer K. M., Leung J. M., LeVan T. D., Molyneaux P. L., et al. (2020). Methods in Lung Microbiome Research. American Journal of Respiratory Cell and Molecular Biology 62. Publisher: American Thoracic Society - AJRCMB, 283–299. 10.1165/rcmb.2019-0273TR. - DOI - PMC - PubMed
    1. Torres A., Cilloniz C., Niederman M. S., Menéndez R., Chalmers J. D., Wunderink R. G., and van der Poll, T. (8, 2021). Pneumonia. Nature Reviews Disease Primers 7. Number: 1 Publisher: Nature Publishing Group, 1–28. 10.1038/s41572-021-00259-0. - DOI - PubMed
    1. Dickson R. P., Erb-Downward J. R., Freeman C. M., McCloskey L., Beck J. M., Huffnagle G. B., and Curtis J. L. (2015). Spatial Variation in the Healthy Human Lung Microbiome and the Adapted Island Model of Lung Biogeography. Annals of the American Thoracic Society 12, 821–830. 10.1513/AnnalsATS.201501-029OC. - DOI - PMC - PubMed
    1. Natalini J. G., Singh S., and Segal L. N. (16, 2022). The dynamic lung microbiome in health and disease. Nature Reviews Microbiology. Publisher: Nature Publishing Group, 1–14. 10.1038/s41579-022-00821-x. - DOI - PMC - PubMed

Publication types

LinkOut - more resources