

doi: 10.12688/wellcomeopenres.18935.1.
eCollection 2023.
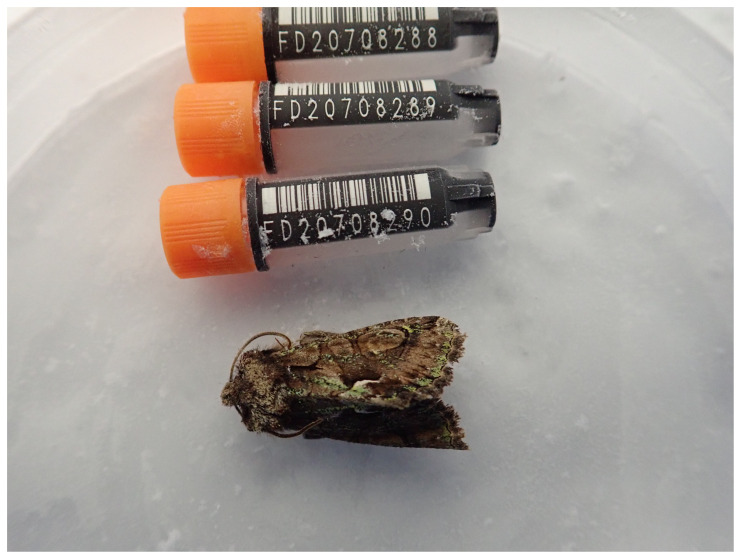
The genome sequence of the Green-brindled Crescent, Allophyes oxyacanthae (Linnaeus, 1758)
Affiliations
- PMID: 39148947
- PMCID: PMC11325130
- DOI: 10.12688/wellcomeopenres.18935.1
Item in Clipboard
The genome sequence of the Green-brindled Crescent, Allophyes oxyacanthae (Linnaeus, 1758)
Wellcome Open Res.
.
Abstract
We present a genome assembly from an individual male Allophyes oxyacanthae (the Green-brindled Crescent; Arthropoda; Insecta; Lepidoptera; Noctuidae). The genome sequence is 458 megabases in span. The whole assembly is scaffolded into 31 chromosomal pseudomolecules, including the assembled Z sex chromosome. The mitochondrial genome has also been assembled and is 15.3 kilobases in length. Gene annotation of this assembly on Ensembl has identified 17,301 protein coding genes.
Keywords: Allophyes oxyacanthae; Green-brindled Crescent; Lepidoptera; chromosomal; genome sequence.
Copyright: © 2023 Boyes D et al.
Conflict of interest statement
No competing interests were disclosed.
Figures
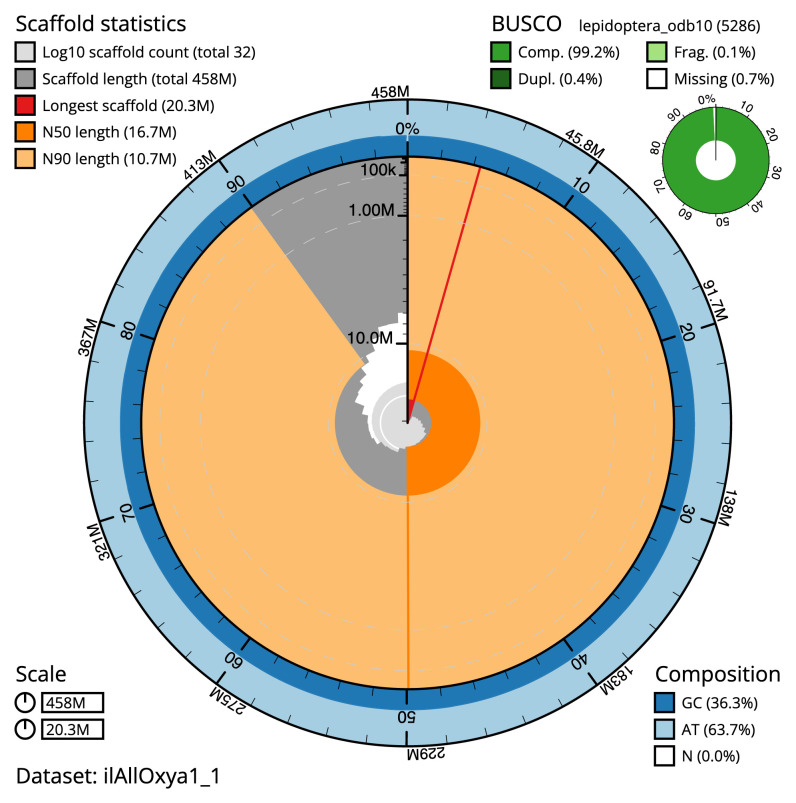
The BlobToolKit Snailplot shows N50 metrics and BUSCO gene completeness. The main plot is divided into 1,000 size-ordered bins around the circumference with each bin representing 0.1% of the 458,479,537 bp assembly. The distribution of scaffold lengths is shown in dark grey with the plot radius scaled to the longest scaffold present in the assembly (20,278,968 bp, shown in red). Orange and pale-orange arcs show the N50 and N90 scaffold lengths (16,683,655 and 10,717,387 bp), respectively. The pale grey spiral shows the cumulative scaffold count on a log scale with white scale lines showing successive orders of magnitude. The blue and pale-blue area around the outside of the plot shows the distribution of GC, AT and N percentages in the same bins as the inner plot. A summary of complete, fragmented, duplicated and missing BUSCO genes in the lepidoptera_odb10 set is shown in the top right. An interactive version of this figure is available at
https://blobtoolkit.genomehubs.org/view/ilAllOxya1_1/dataset/ilAllOxya1_1/snail .
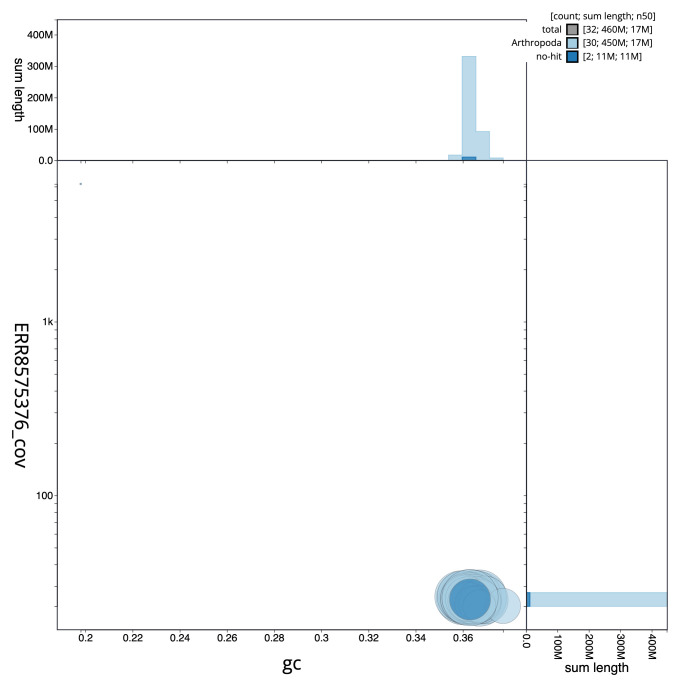
BlobToolKit GC-coverage plot. Scaffolds are coloured by phylum. Circles are sized in proportion to scaffold length. Histograms show the distribution of scaffold length sum along each axis. An interactive version of this figure is available at
https://blobtoolkit.genomehubs.org/view/ilAllOxya1_1/dataset/ilAllOxya1_1/blob .
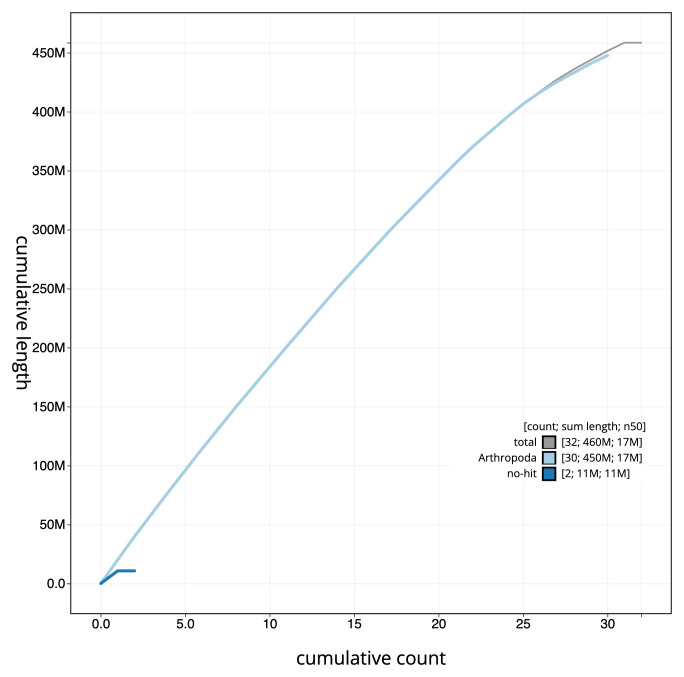
BlobToolKit cumulative sequence plot. The grey line shows cumulative length for all scaffolds. Coloured lines show cumulative lengths of scaffolds assigned to each phylum using the buscogenes taxrule. An interactive version of this figure is available at
https://blobtoolkit.genomehubs.org/view/ilAllOxya1_1/dataset/ilAllOxya1_1/cumulative .
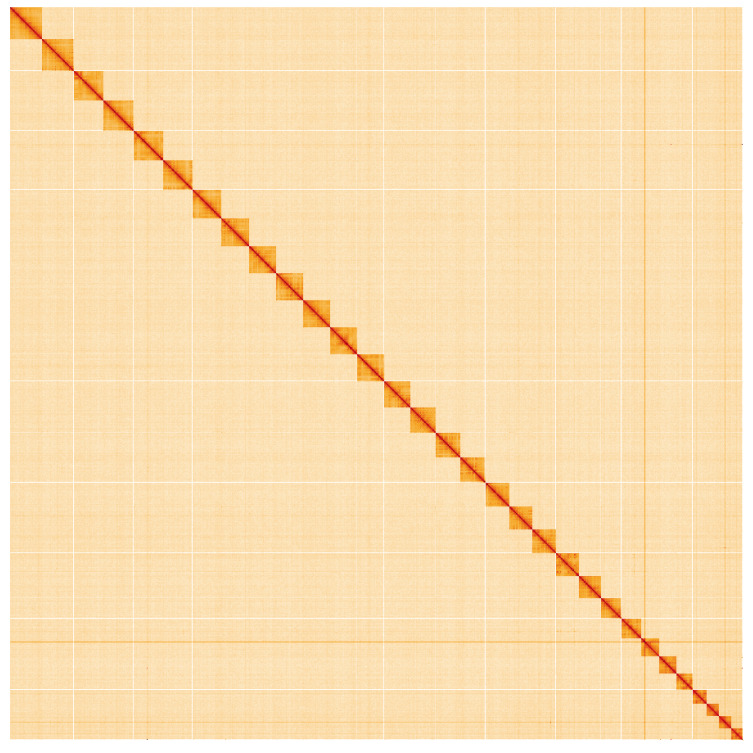
Hi-C contact map of the ilAllOxya1.1 assembly, visualised using HiGlass. Chromosomes are shown in order of size from left to right and top to bottom. An interactive version of this figure may be viewed at
https://genome-note-higlass.tol.sanger.ac.uk/l/?d=OzgdewECSHeyOqN4f7ptEQ .
References
-
- Ford EB: Moths.London: New Naturalist, Collins.1967. Reference Source
LinkOut - more resources
Full Text Sources
