. 2024 Jul 11;10(14):e34501.
doi: 10.1016/j.heliyon.2024.e34501. eCollection 2024 Jul 30.

Calculating toxic pressure for mixtures of endocrine disruptors

Affiliations

Calculating toxic pressure for mixtures of endocrine disruptors

Tom M Nolte. Heliyon. .

Abstract

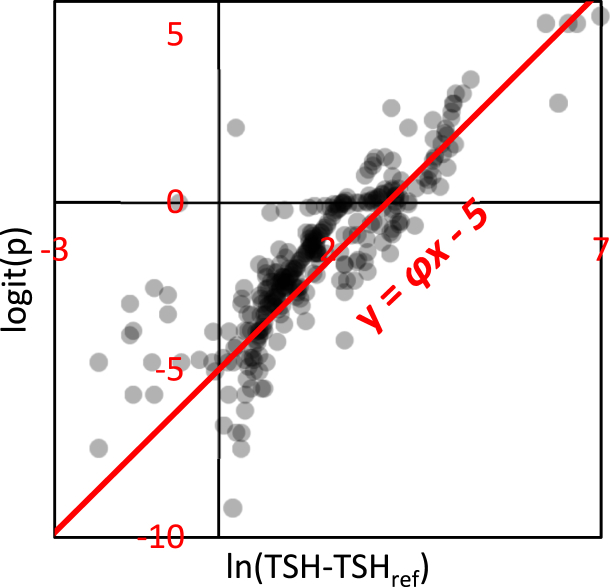
Incidence of autoimmune disorders, birth defects, and neurological diseases rose over the past 50 years due to increasing variety and quantity of pollutants. To date, there appear few methods capable to evaluate and predict mixture effects by endocrine disruptors (EDs). For the first time, we have developed calculus to determine mixture effects by all kinds of EDs. Our method uses the golden ratio ϕ and draws from bifurcation and chaos theory. Using also the concept of molecular mimicry, we developed the equation: e f f e c t = 100 % 1 + e 5 · K i C i - n i ϕ 3 . We successfully tested the equation using a range of cohort studies and biomarkers, and for different pollutants like heavy metals, thyroid hormone mimickants, chromate/chlorate, etc. The equation is simple enough to use with only minor prior knowledge and understanding of basic algebra. The method is universal and calculation is data 'light', requiring only pollutant concentrations [C], potencies K and an integer n for endocrinal involvement. This study offers a comprehensive framework to assess the health effects of pollutant exposure across diverse populations, envisioning far-reaching impact, and presenting practical examples and insights.


Conflict of interest statement

The author declares that he has no known competing financial interests or personal relationships that could have appeared to influence the work reported in this paper.

Figures

Fig. 1
Fig. 1
Schematic representation of changes in thyroid hormone, iodine and calcium (ng/L, not to scale) with increasing severity of illness. Adapted from [17].
Fig. 2
Fig. 2
Depending on levels of endocrine disrupting chemicals (red), the human body needs to allocate hormones and cations/anions (green) to ensure that nutrients remain incorporable via metabolic schemes for growth. (For interpretation of the references to colour in this figure legend, the reader is referred to the Web version of this article.)
Fig. 3
Fig. 3
Calcium, iodine and T3/T4 versus TSH. Dotted grey lines are the 95 % ranges for normal TSH levels: in this range, negative feedback establishes healthy homeostasis (open symbols). Data from Yagi (T4) [38], Karaoglan (iodine) [39], Hamza (urinary iodine) [40], Levine (calcium) [15], and Wang (T3) [13]. Other data corroborates the exponent for T3, 2.6 ± 0.5 [41].
Fig. 4
Fig. 4
Concentrations of metals versus TSH-TSHref. Offset between each relationship (solid lines) indicates potency K. TSHref = 1.2 mIU/L.
Fig. 5
Fig. 5
Fig. 5A. Induction concentration values for the thyroid hormone receptor α versus indicators of electron and proton transfer energies, EHOMO and pKa. Outliers are due to missing info on pKa or bioavailability. Data selection from Ref. [42]. Fig. 5B. Effect on TSH versus concentration dose for dioxins PCBs etc. (TEQ) and T3. Offsets between the compounds are differences in potency K. TSHref = 1.2 mIU/L (dioxin like substances) and TSHref = 0.0 mIU/L for T3.
Fig. 6
Fig. 6
Concentrations of iodine mimickants versus TSH-TSHref. Offset between each relationship (solid lines) indicates potency K. With TSHref = 1.2 mIU/L. Data from Hasan [43] and Ahmed [44] (Cr), Molin [45] (As), Hooth [46] (ClO3), and Banerjee [47,48].
Fig. 7
Fig. 7
Concentration of toxicants versus TSH. Sum of all dioxin TEQ (black), in terms of arsenic (green), and in terms of lead (blue). (For interpretation of the references to colour in this figure legend, the reader is referred to the Web version of this article.)
Fig. 8
Fig. 8
Relationship between logit p and TSH, wherein logit p = ln(p/(1-p)), with p as probability.
Fig. 9
Fig. 9
Relationships between TSH and 20 different health effects (A) and 10 different biomarkers (B), related to Ca2+ metabolism, brain, bone, heart, kidney, etc. The red dashed lines are guides to the eye denoting no effect (0 %) and full effect (100 %) and the baseline TSH of 1.2 mUI/L. Spread is larger in A because we are dealing with humans instead of cells, and humans differ in terms of nutrition, lifestyle, etc. (For interpretation of the references to colour in this figure legend, the reader is referred to the Web version of this article.)

Similar articles

References

    1. Bach J.F. Mechanisms of disease: the effect of infections on susceptibility to autoimmune and allergic diseases. N. Engl. J. Med. 2002;347(12):911–920. - PubMed
    1. Axelsson J., et al. Exposure to polychlorinated compounds and cryptorchidism; A nested case-control study. PLoS One. 2020;15(7) - PMC - PubMed
    1. Vancamp P., Demeneix B.A. Is the observed decrease in body temperature during industrialization due to thyroid hormone-dependent thermoregulation disruption? Front. Endocrinol. 2020;11:470. - PMC - PubMed
    1. EUROCAT. European Surveillance of Congenital Anomalies.https://eu-rd-platform.jrc.ec.europa.eu/eurocat_en.
    1. Skakkebaek N.E., et al. Male reproductive disorders and fertility trends: influences of environment and genetic susceptibility. Physiol. Rev. 2016;96(1):55–97. - PMC - PubMed

LinkOut - more resources