. 2024 May 24;15(8):2729-2744.
doi: 10.1039/d4md00042k. eCollection 2024 Aug 14.

Targeted suppression of oral squamous cell carcinoma by pyrimidine-tethered quinoxaline derivatives

Affiliations

Targeted suppression of oral squamous cell carcinoma by pyrimidine-tethered quinoxaline derivatives

Asmita Choithramani et al. RSC Med Chem. .

Abstract

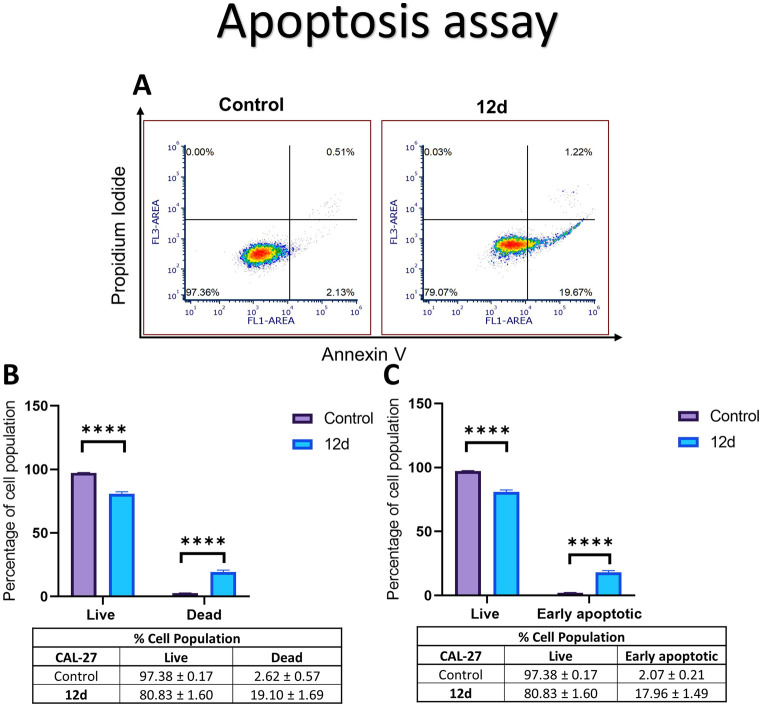
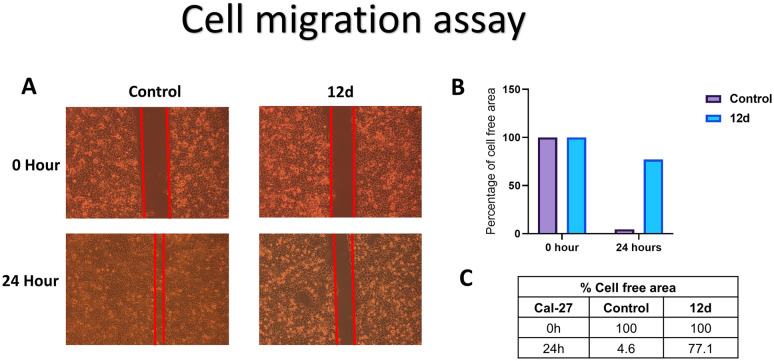
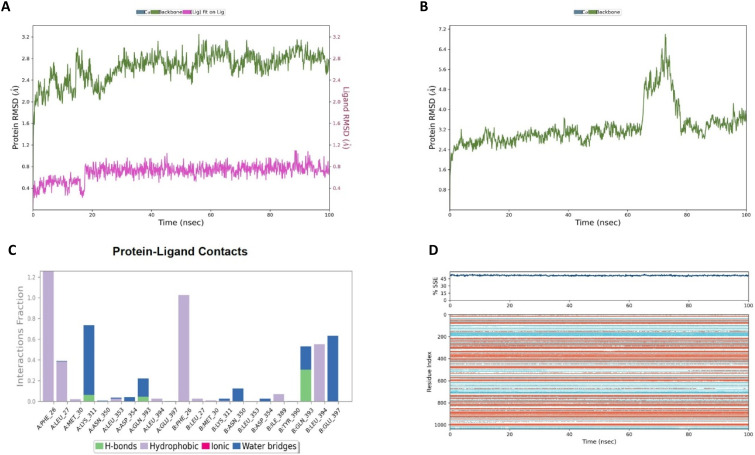
Oral cancer (OC) stands as a prominent cause of global mortality. Despite numerous efforts in recent decades, the efficacy of novel therapies to extend the lifespan of OC patients remains disappointingly low. Consequently, the demand for innovative therapeutic agents has become all the more pressing. In this context, we present our work on the design and synthesis of twenty-five novel quinoxaline-tethered imidazopyri(mi)dine derivatives. This was followed by comprehensive investigations into the impact of these molecules on the OC cell line. The in vitro cytotoxicity studies performed in CAL-27 and normal oral epithelial (NOE) cell lines revealed that some of the synthesized molecules like 12d have potent antiproliferative activity specifically towards OC cells with an IC50 of 0.79 μM and show negligible cytotoxicity over NOE cells. Further, 12d arrested cell growth in the S phase of the cell cycle and induced cell death by early apoptosis. The in silico studies validated that 12d binds to the activator binding site on pyruvate kinase M2 (PKM2) overexpressed in OC while the lactate dehydrogenase (LDH)-coupled enzyme assay established 12d as a potent PKM2 activator with an AC50 of 0.6 nM. Hence, this study provides fruitful evidence for the designed compounds as anticancer agents against OC.


Conflict of interest statement

The authors have no competing financial interests.

Figures

Fig. 1
Fig. 1. Chemical structures of quinoxaline derivatives used for various diseases (I to IX) and chemical structures of kinase inhibitors bearing imidazopyridine and imidazopyrimidine (X to XII).
Fig. 2
Fig. 2. A) 2D interaction diagrams and B) 3D interaction diagrams of compounds 12d, 10j, 10n, and DASA-58 docked in the activator site of PKM2 (PDB: 3GR4).
Scheme 1
Scheme 1. Synthetic strategy for the intermediate compounds. 1A) Synthesis of aryl-2-aminopyrimidine (3a–i) from substituted acetophenones (1a–i). 1B) Synthesis of 2-chloro-1-(imidazo[1,2-a]pyri(mi)din-3-yl)ethan-1-one (6a and b) from 2-aminopyri(mi)dine (2a and b) through azomethine formation. 1C) Synthesis of intermediates 7-aryl-2-chloro-1-(imidazo[1,2-a]pyrimidin-3-yl)ethan-1-one (8a–i) from 4-aryl-2-aminopyrimidines (3a–i) through azomethine formation.
Scheme 2
Scheme 2. Synthetic strategy for the compounds (10a–p and 12a–i). 2A) Synthesis of substituted quinoxaline tethered imidazopyri(mi)dines 10a–p by oxidative cyclization of o-phenylenediamine 9a–p with 6a and b. 2B) Synthesis of quinoxaline-tethered 12a–i by the oxidative cyclization of o-phenylenediamine 11 and 8a–i.
Fig. 3
Fig. 3. Results from the cytotoxicity assay of the synthesized compounds on the oral cancer cell line (CAL-27). A) Cytotoxicity results of series 1 compounds (10f, 10j, 10k, 10n, and 10o) on the CAL-27 cell line and B) cytotoxicity results of series 2 compounds (12a, 12b, and 12d). The data are represented here as the mean standard deviation, carried out in a triplicate manner.
Fig. 4
Fig. 4. The Alamar Blue assay was performed in the normal oral epithelial (NOE) cell line. A) Cytotoxicity of series 1 molecules (10k, 10n, and 10o) against the NOE cell line and B) cytotoxicity of series 2 molecules (12a, 12b, and 12d) against the NOE cell line. The data are represented here as the mean standard deviation, carried out in a triplicate manner.
Fig. 5
Fig. 5. Structure–activity relationship of compounds 10a–p and 12a–i towards the CAL-27 cell line.
Fig. 6
Fig. 6. Cell cycle analysis of 12d treated and control CAL-27 cells. (A) Cell cycle distribution of control cells. Cell cycle distribution of 12d treated cells for 24 h. (B) Bar diagram of the cell cycle distribution data. (C) Tabular representation of the cell cycle distribution data. The experimental data are shown as the mean standard deviation, performed in triplicate. The level of significance was tested using a 2-way ANOVA mixed model with Sidak's multiple comparison test; p < 0.01 was considered to be statistically significant. Tested significance is displayed in the figures as *, p < 0.05; **, p < 0.01; ***, p < 0.001; ****, p < 0.0005.
Fig. 7
Fig. 7. Apoptosis assay of 12d treated and control CAL-27 cells. (A) Evaluation of apoptosis in control cells and 12d treated CAL-27 cells by annexin–propidium iodide staining. The CAL-27 cells treated with 12d resulted in increased apoptotic cells in comparison with the control cells. (B) Bar diagram and tabular representation of the live vs. dead cells. (C) Bar diagram and tabular representation of the live vs. early apoptotic cells. The experimental data are shown as the mean standard deviation, performed in triplicate. The level of significance was tested using a 2-way ANOVA mixed model with Sidak's multiple comparison test; p < 0.0005 for live vs. dead cells and p < 0.0005 for live vs. early apoptotic cells were statistically significant. Tested significance is displayed in the figures as *, p < 0.05; **, p < 0.01; ***, p < 0.001; ****, p < 0.0005.
Fig. 8
Fig. 8. The cell migration assay using 12d was conducted on the CAL-27 cell line. (A) Treatment with 12d inhibited cell migration, resulting in a cell-free area of 77.1% in the 12d-treated group, compared to only 4.6% in the control after 24 hours. (B) Bar diagram representation of the cell migration area. (C) Tabular representation of the cell migration area.
Fig. 9
Fig. 9. The results of the LDH-coupled enzyme assay performed for 12d in comparison with DASA-58 as a standard along with the percentage relative activity of PKM2. The data are represented as the mean standard deviation done in triplicate (n = 3).
Fig. 10
Fig. 10. Representative graphical demonstration of (A) the HOMO and (B) the LUMO of compound 12d.
Fig. 11
Fig. 11. Molecular electrostatic potential (MESP) surfaces of compound 12d. (Red – negative potential, blue – positive potential).
Fig. 12
Fig. 12. A) RMSD (Å) of simulated protein PKM2 (PDB: 3GR4) in complex with compound 12d during 100 ns MD simulation (Cα and backbone atoms), B) RMSD (Å) of simulated protein PKM2 (PDB: 3GR4) in the absence of a ligand during 100 ns MD simulation (Cα and backbone atoms), C) protein–ligand contact diagram, and D) protein SSE value that is the secondary structure content of the protein as a function of residue number and of time.

Similar articles

References

    1. Oral Cancer, https://www.who.int/news-room/fact-sheets/detail/oral-health, (accessed on 12th May 2024)
    1. Tranby E. P. Heaton L. J. Tomar S. L. Kelly A. L. Fager G. L. Backley M. Frantsve-Hawley J. Cancer Epidemiol., Biomarkers Prev. 2022;31:1849–1857. doi: 10.1158/1055-9965.EPI-22-0114. - DOI - PMC - PubMed
    1. Mouth and oral cancer statistics, https://www.wcrf.org/cancer-trends/mouth-and-oral-cancer-statistics, (accessed on 12th May 2024)
    1. Gupta B. Johnson N. W. Kumar N. Oncology. 2016;91:13–23. doi: 10.1159/000446117. - DOI - PubMed
    1. Ledgerwood L. G. Kumar D. Eterovic A. K. Wick J. Chen K. Zhao H. Tazi L. Manna P. Kerley S. Joshi R. Wang L. Chiosea S. I. Garnett J. D. Tsue T. T. Chien J. Mills G. B. Grandis J. R. Thomas S. M. Oncotarget. 2016;7:27185–27198. doi: 10.18632/oncotarget.8448. - DOI - PMC - PubMed

LinkOut - more resources