[Preprint]. 2024 Nov 12:2024.08.07.607009.
doi: 10.1101/2024.08.07.607009.

Outer hair cells stir cochlear fluids

Affiliations

Outer hair cells stir cochlear fluids

Choongheon Lee et al. bioRxiv. .

Update in

  • Outer hair cells stir cochlear fluids.
    Lee C, Shokrian M, Henry KS, Carney LH, Holt JC, Nam JH. Lee C, et al. Elife. 2025 Jan 16;13:RP101943. doi: 10.7554/eLife.101943. Elife. 2025. PMID: 39817719 Free PMC article.

Abstract

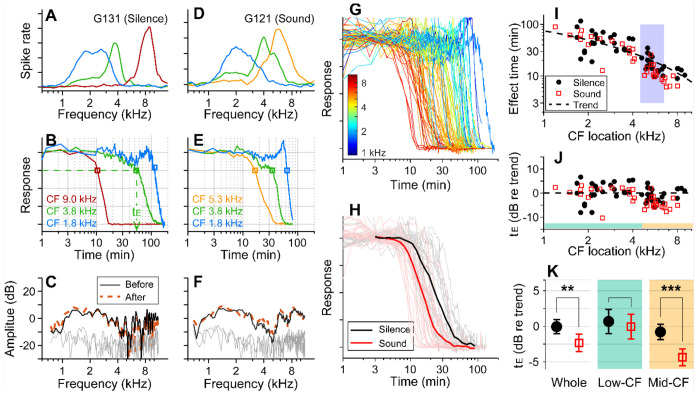
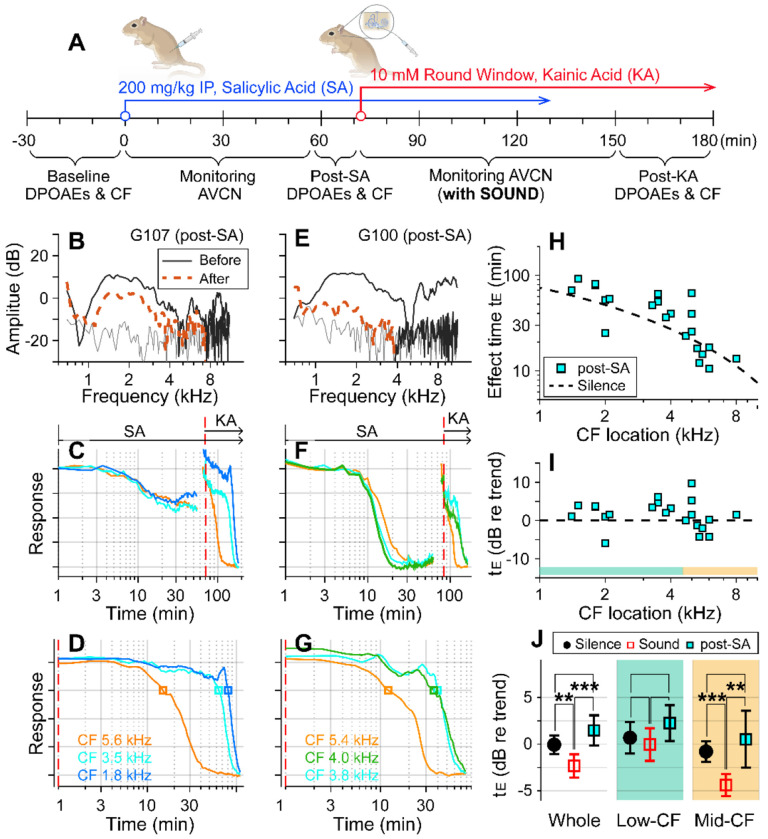
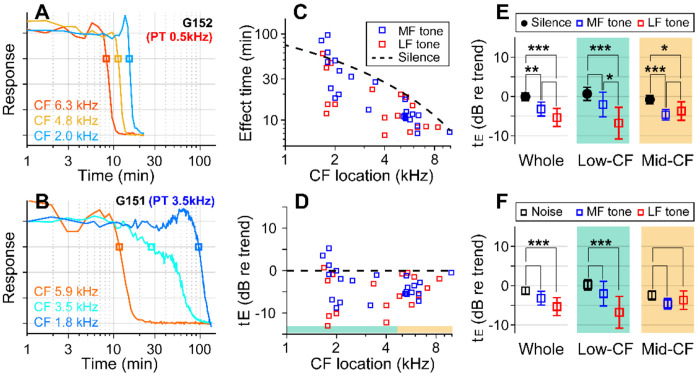
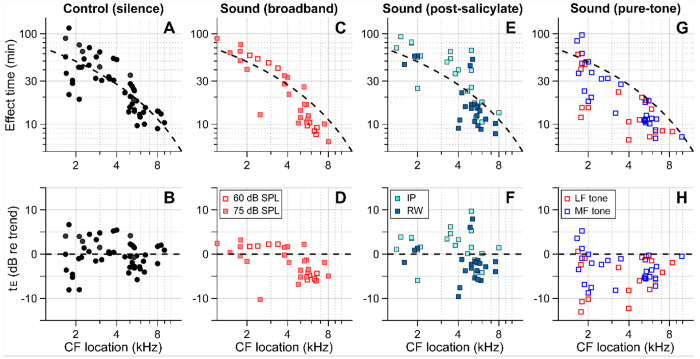
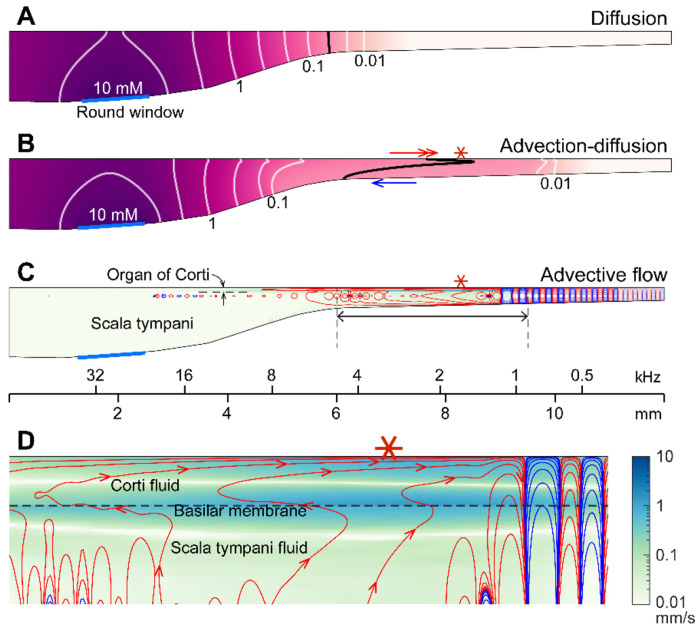
We hypothesized that active outer hair cells drive cochlear fluid circulation. The hypothesis was tested by delivering the neurotoxin, kainic acid, to the intact round window of young gerbil cochleae while monitoring auditory responses in the cochlear nucleus. Sounds presented at a modest level significantly expedited kainic acid delivery. When outer-hair-cell motility was suppressed by salicylate, the facilitation effect was compromised. A low-frequency tone was more effective than broadband noise, especially for drug delivery to apical locations. Computational model simulations provided the physical basis for our observation, which incorporated solute diffusion, fluid advection, fluid-structure interaction, and outer-hair-cell motility. Active outer hair cells deformed the organ of Corti like a peristaltic tube to generate apically streaming flows along the tunnel of Corti and basally streaming flows along the scala tympani. Our measurements and simulations coherently suggest that active outer hair cells in the tail region of cochlear traveling waves drive cochlear fluid circulation.

Keywords: drug delivery; electromotility; kainic acid; organ of Corti; outer hair cell; perilymph.


Figures

Figure 1.
Figure 1.. Sound-facilitated inner ear drug delivery.
Kainic acid was applied to the round window of young gerbils under different acoustic conditions— in silence or with 60-75 dB SPL sounds. (A) Tuning curves at 30 dB SPL. The CFs of the three probing channels are 9.0, 3.8 and 1.8 kHz. (B) Normalized neural responses in the AVCN versus the time of drug application. The drug effect time, tE, was defined at the 75 percentiles of normalized curves. In this measurement, it took 54 minutes to affect the 3.8 kHz CF location (green dashed line and arrow). (C) DPOAEs were measured before and after the kainic acid delivery. Two stimulating tones were at 40 dB SPL, and the frequency ratio was 1.1. The x-axis is the f1 frequency. (A-C) Example of drug delivered in silence (“Silence” case). (D, E, F) Example of drug delivery during the presentation of broadband noise at 75 dB SPL (“Sound” case). (G) Response curves with colors representing CFs. Basal (higher frequency) responses decay earlier. Out of 82 measurements, 48 silence-case curves are from 18 animals and 34 sound-case curves are from 13 animals. (H) Mean responses of sound and silence cases at similar locations (CF = 4.5-6.5 kHz); n=19 for Silence, and n=13 for Sound. (I) Effect time versus CF location. The shaded frequency range corresponds to the data in panel H. The broken curve (“Trend” line) was obtained by fitting a curve to the silence data using 1D diffusion theory. (J) Effect time in dB with respect to the trend line. tE in dB = 20log10(tE/tTrend). (K) Two-tailed t-tests between the effect times of sound and silence cases for the entire CF range (whole, n=48, 34 for silence and sound), low-CF locations (<4.5 kHz, n=24, 16 for silence and sound), and high-CF locations (> 4.5 kHz, n=24, 18 for silence and sound). Throughout this paper, the symbols and range bars indicate the mean and the 95% confidence interval, respectively. When an individual data set was presented as an example, the subject identifies are indicated as G###, where ### is a three-digit number.
Figure 2.
Figure 2.. Suppressing motility of outer hair cells by salicylate.
(A) Under the “post-SA” protocol, salicylic acid (SA, 200 mg/kg) was administered IP before applying kainic acid at the round window. Broadband noise at 75 dB SPL was played during experiments. (B) DPOAEs before and after salicylic acid and kainic acid delivery. (C) Overall response curves. IP salicylic acid was administered at t=0. The red vertical line indicates when kainic acid was applied to the round window. The arrows indicate the application spans of salicylic acid (SA) and kainic acid (KA). (D) Normalized neural responses after kainic-acid application (the curves after the red line in panel B). (E, F, G) Another example of the post-SA protocol. (H) Effect time versus CF location of post-SA measurements (n=22 from 8 animals). The silence-case trend line is the same as Fig. 1. (I) The effect time in dB with respect to the trend line. (J) Two-tailed t-tests between the effect times of sound, silence, and post-SA cases for the entire CF range (whole), low-CF locations (<4.5 kHz, n = 12 for the post-SA case), and high-CF locations (> 4.5 kHz, n=10 for the post-SA case).
Figure 3.
Figure 3.. Pure tones yield shorter effect times than broadband noise.
(A) Drug delivery during presentation of a tone at low-frequency (0.5 kHz 80 dB SPL) or (B) mid-frequency (3.5 kHz 80 dB SPL). (C) Effect time of drug delivery under the low- and mid-frequency tones. The trendline of the silence case is the same as Fig. 1I. n = 18 from 6 animals for LF tone. n = 22 from 8 animals for MF tone. (D) Normalized effect time. (E) Statistical comparison between the three cases (silence, low- and mid-frequency-tone protocols). The two-tailed t-tests were performed on all CF locations, low-CF (< 4.5 kHz, n = 12, 9 for MF- and LF-tone) and high-CF (> 4.5 kHz, n = 10, 8 for MF- and LF-tone) locations. (F) Normalized effect time under three sound-conditions compared: Broadband noise, mid-frequency-tone and low-frequency-tone.
Figure 4.
Figure 4.. Outer-hair-cell motility facilitates inner-ear drug delivery.
Summary of the effects of different acoustic and physiological conditions on inner-ear drug delivery. The y-axes represent absolute effect time in minutes (top) and relative effect time in dB w.r.t the trend line (bottom). The same trend line (broken lines, obtained from the control case) is presented for all panels. (A, B) Effect time in silence. (C, D) Effect time under 60 or 75 dB SPL broadband (0.1-12 kHz) sounds. (E, F) Effect time when outer-hair-cell motility was suppressed by salicylate. Before kainic acid application, the salicylic acid solution was administered systemically (intraperitoneally-IP, 200 mg/kg) or locally (round window-RW, 10 mM). (G, H) Effect time under 80 dB SPL pure tones. A 0.5 kHz (low-frequency-LF) or 3-6 kHz (mid-frequency-MF) tone was presented during drug delivery. The mid-frequency tone was chosen to match one of the probe frequencies.
Figure 5.
Figure 5.. Active outer hair cells drive fluid flow.
Inner-ear drug delivery was simulated using a computational model. (A) Drug delivery due to diffusion. The concentration profile over the cochlear length at 30 minutes after drug application to the round window. (B) Drug delivery with 80 dB SPL, 1-kHz sound. The black contour line demonstrates how advection affects drug delivery. (C) Steady-state drift flow of the cochlear fluids. Red and blue curves represent the clockwise and counterclockwise streamlines. (D) The region with the fastest advection. The drift velocity (green color contour) is as large as a few mm/s.

Similar articles

References

    1. Berg H. C. (1993). Random walks in biology. Princeton, N.J., Princeton University Press.
    1. Borkholder D. A., Zhu X. and Frisina R. D. (2014). “Round window membrane intracochlear drug delivery enhanced by induced advection.” J Control Release 174:171–176. - PMC - PubMed
    1. Cooper N. P., Vavakou A. and van der Heijden M. (2018). “Vibration hotspots reveal longitudinal funneling of sound-evoked motion in the mammalian cochlea.” Nat Commun 9(1): 3054. - PMC - PubMed
    1. Dewey J. B., Applegate B. E. and Oghalai J. S. (2019). “Amplification and Suppression of Traveling Waves along the Mouse Organ of Corti: Evidence for Spatial Variation in the Longitudinal Coupling of Outer Hair Cell-Generated Forces.” J Neurosci 39(10): 1805–1816. - PMC - PubMed
    1. Dong W. and Olson E. S. (2013). “Detection of cochlear amplification and its activation.” Biophys J 105(4): 1067–1078. - PMC - PubMed

Publication types

LinkOut - more resources