[Preprint]. 2024 Aug 9:2024.08.09.607365.
doi: 10.1101/2024.08.09.607365.

Centrocortin potentiates co-translational localization of its mRNA to the centrosome via dynein

Affiliations

Centrocortin potentiates co-translational localization of its mRNA to the centrosome via dynein

Hala Zein-Sabatto et al. bioRxiv. .

Abstract

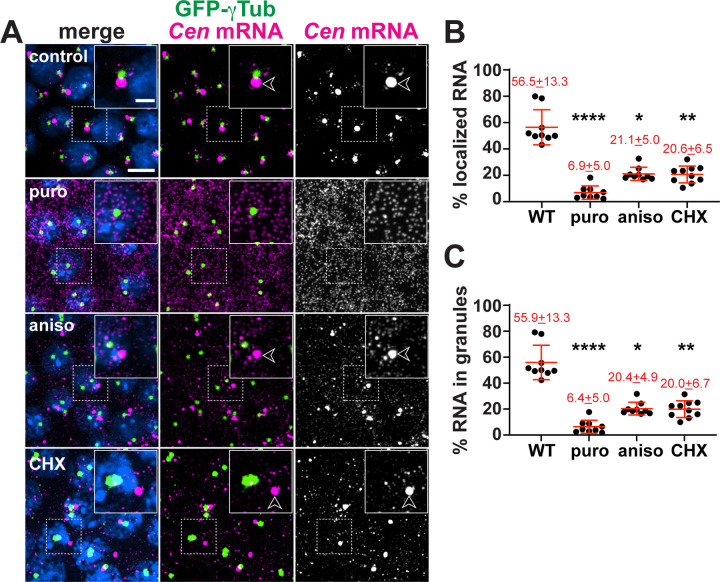
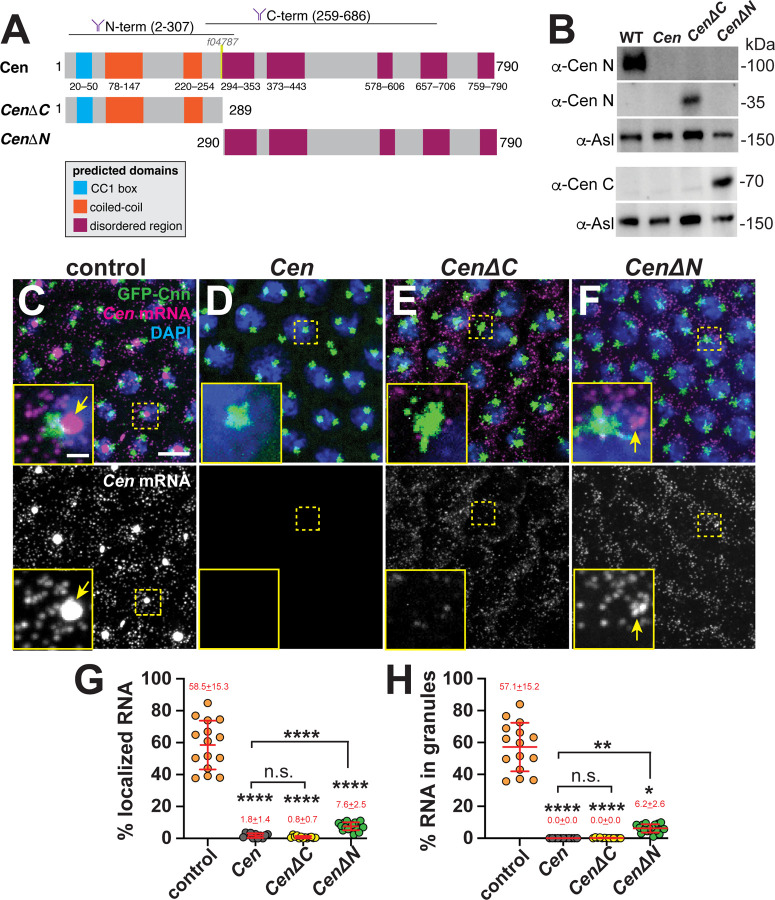
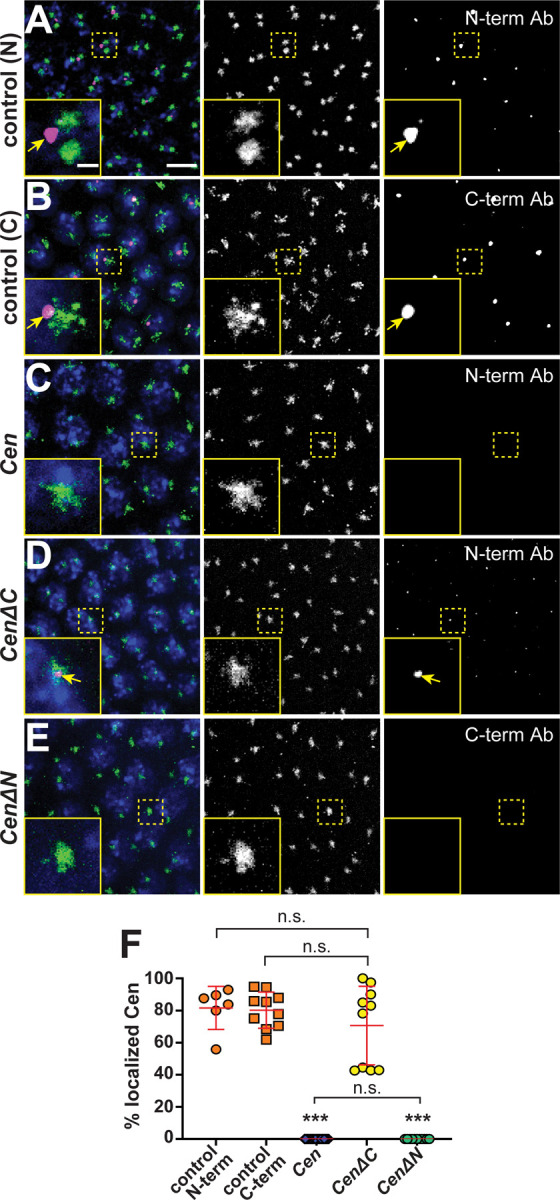
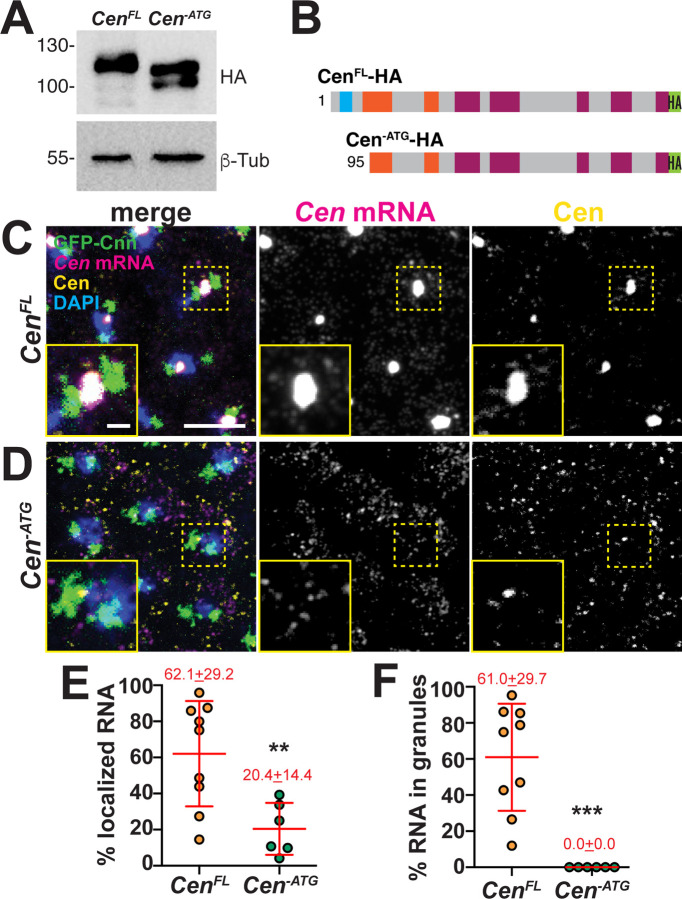
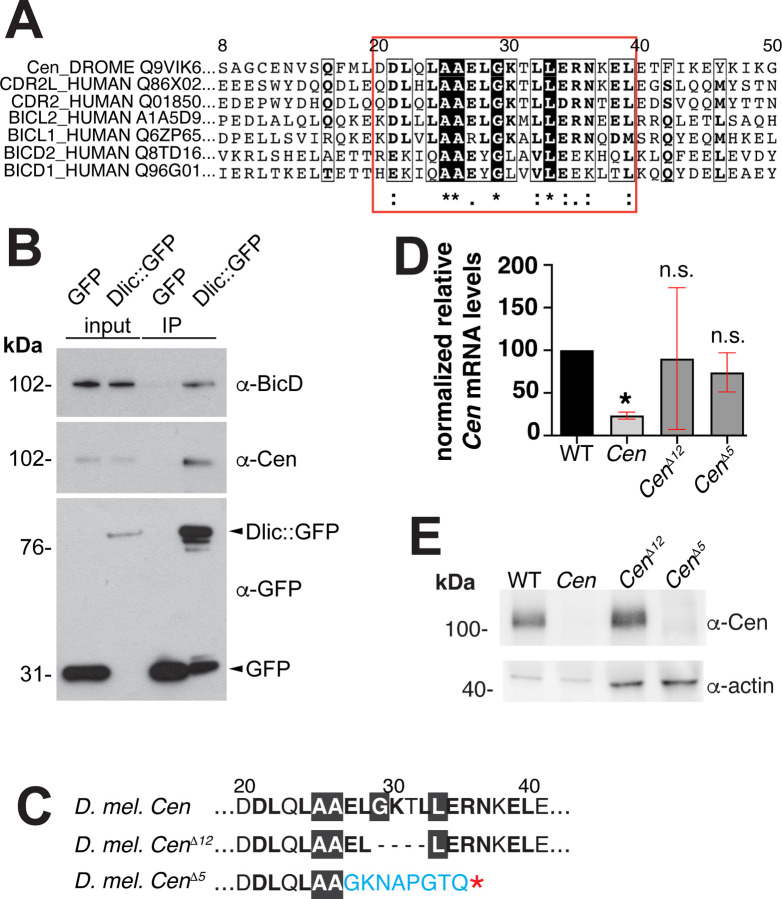
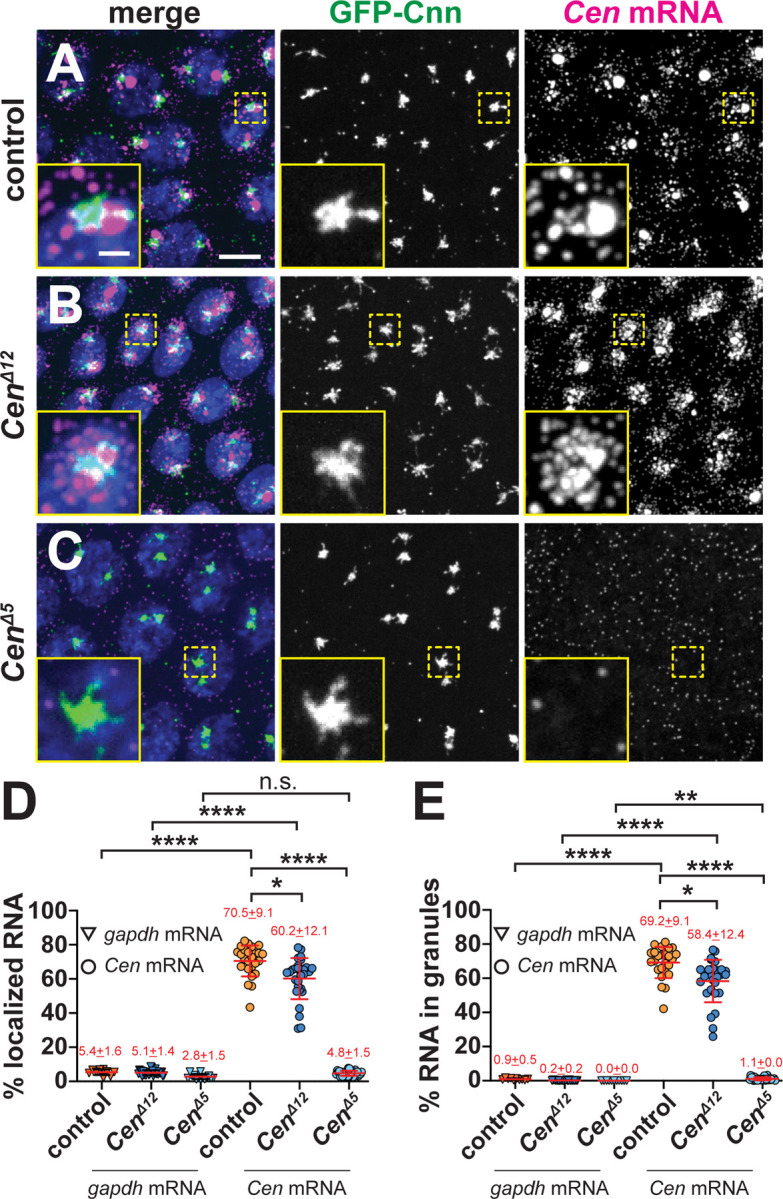
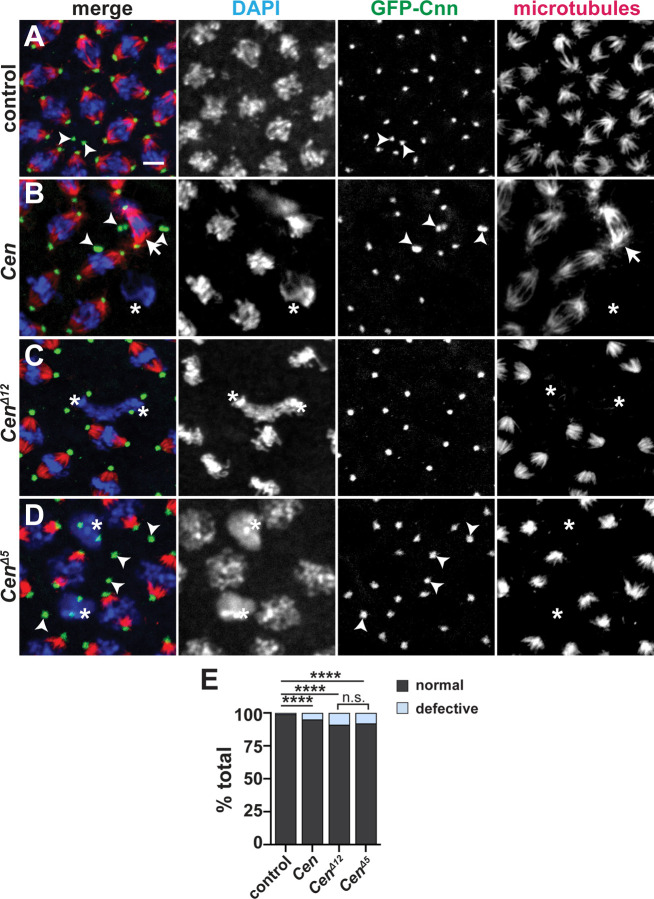
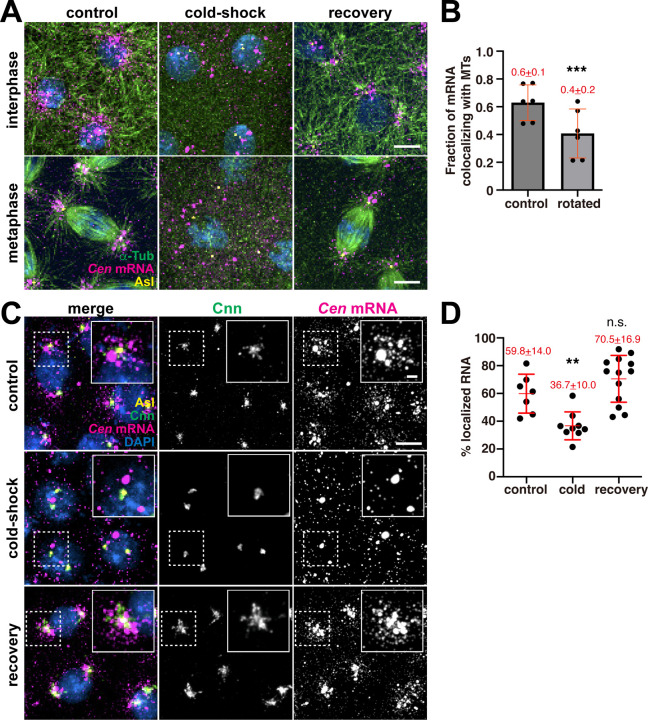
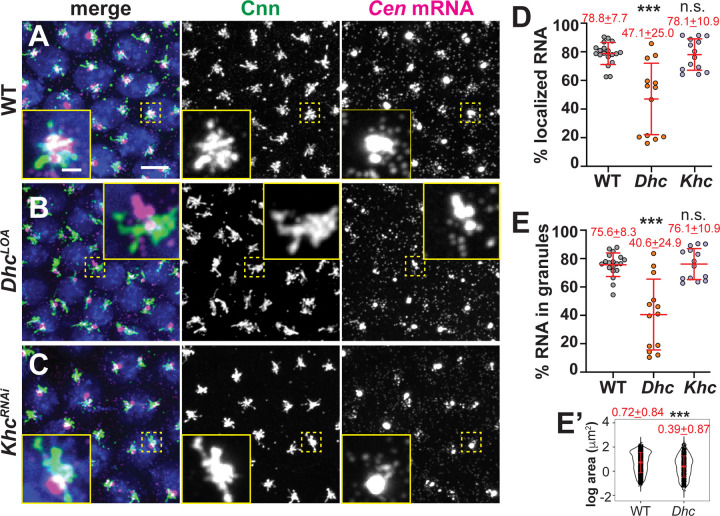
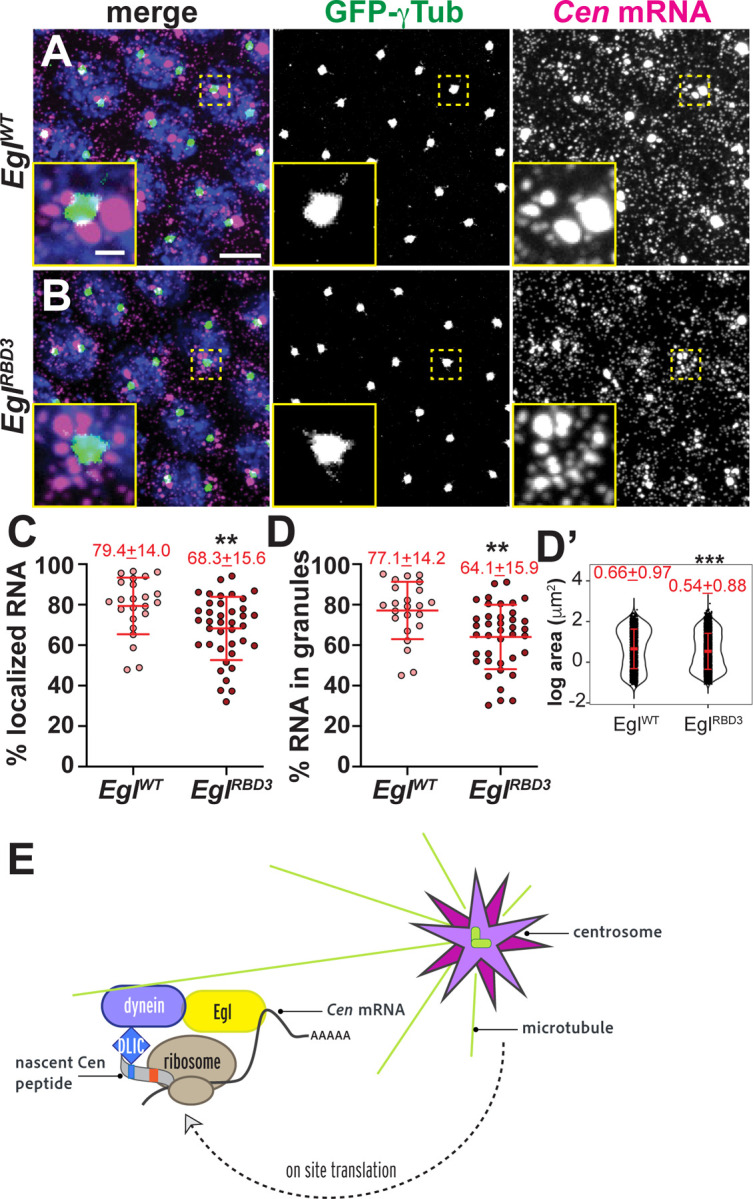
Centrosomes rely upon proteins within the pericentriolar material to nucleate and organize microtubules. Several mRNAs also reside at centrosomes, although less is known about how and why they accumulate there. We previously showed that local Centrocortin (Cen) mRNA supports centrosome separation, microtubule organization, and viability in Drosophila embryos. Here, using Cen mRNA as a model, we examine mechanisms of centrosomal mRNA localization. We find that while the Cen N'-terminus is sufficient for protein enrichment at centrosomes, multiple domains cooperate to concentrate Cen mRNA at this location. We further identify an N'-terminal motif within Cen that is conserved among dynein cargo adaptor proteins and test its contribution to RNA localization. Our results support a model whereby Cen protein enables the accumulation of its own mRNA to centrosomes through a mechanism requiring active translation, microtubules, and the dynein motor complex. Taken together, our data uncover the basis of translation-dependent localization of a centrosomal RNA required for mitotic integrity.

Keywords: RNA localization; cargo adaptor; centrosome; dynein; transport.


Conflict of interest statement

The authors declare no competing financial interests.

Figures

Figure 1.
Figure 1.. Co-translational transport of Cen mRNA to centrosomes.
(A) Maximum-intensity projections of NC 13 embryos expressing GFP-gTub (green) stained with Cen smFISH probes (magenta) and DAPI (blue) to label nuclei following incubation with DMSO (control) or the translation inhibitors puromycin (puro), anisomycin (aniso), or cycloheximide (CHX). Arrowheads mark Cen RNPs. Quantification shows the percentage of Cen mRNA (B) localizing to the centrosome and (C) organized within granules, defined as ≥4 overlapping RNA objects (Ryder et al., 2020). Mean ± SD is displayed (red). Significance by ANOVA with Dunnett’s multiple comparison test with *, P<0.05; **, P<0.01; and ****, P<0.0001. Scale bars: 5 μm; 2 μm (insets).
Figure 2.
Figure 2.. Multiple Cen domains support mRNA localization to the centrosome.
(A) Schematic of the full-length and truncated Cen protein products with positions of predicted domains (Paysan-Lafosse et al., 2023), antibody epitopes (Kao and Megraw, 2009), and the transposon f04787 within null mutants indicated. (B) Immunoblots from 0.5–2.5 hr embryo extracts from the indicated genotypes showing truncated Cen protein products in the CenΔC (~35 kDa) and CenΔN (~70 kDa) samples relative to the Asl loading control. The N-terminal anti-Cen antibody was used for the top two blots (α-Cen N), while the C-terminal anti-Cen antibody was used below (α-Cen C; see also (Kao and Megraw, 2009)). (C–F) Maximum-intensity projections of Cen smFISH (magenta) in NC 13 interphase embryos expressing GFP-Cnn (green) with DAPI-stained nuclei (blue). (C) Control embryo with Cen mRNA localized at centrosomes (arrow). In contrast, (D) Cen mutants and (E) CenΔC embryos fail to localize Cen mRNA to centrosomes. (F) Although CenΔN is partially sufficient to form small RNA granules (arrow) near centrosomes, neither fragment recapitulates WT localization. In all experiments, CenΔC and CenΔN are expressed in the Cen null background. Percentage of Cen mRNA (G) overlapping with centrosomes or (H) in granules 0 μm from the Cnn surface. Each dot represents a measurement from N= 15 control, 11 Cen, 13 CenΔC, and 17 CenΔN embryos. Mean ± SD is displayed (red). Significance was determined by (G) one-way ANOVA followed by Dunnett’s T3 multiple comparison test or (H) Kruskal-Wallis test followed by Dunn’s multiple comparison test with n.s., not significant; *, P<0.05; **, P<0.01; and ****, P<0.0001. Scale bars: 5μm; 1μm (insets).
Figure 3.
Figure 3.. he N-terminal fragment is necessary and sufficient for Cen protein localization to the centrosome.
T Maximum-intensity projections of NC 13 interphase embryos expressing GFP-Cnn (green) labeled with anti-Cen antibodies (magenta) and DAPI (blue nuclei). Control embryos labeled with (A) anti-Cen N-terminal or (B) C-terminal antibodies (Ab) show Cen localized at centrosomes (arrows). (C) Cen protein is not detected in null mutants. (D) The N-terminal fragment (CenΔC) is sufficient to direct Cen to the centrosome (arrows), while the C-terminal fragment (CenΔN; (E)) is not. Both transgenes are expressed in the Cen null background. (F) The percentage of Cen protein signals overlapping with centrosomes (0 μm from Cnn surface). Each dot represents a measurement from N= 6 control (N-terminal Cen Ab), 10 control (C-terminal Cen Ab), 23 Cen null (N-terminal Cen Ab), 10 CenΔC (N-terminal Cen Ab), and 11 CenΔN embryos (C-terminal Cen Ab). Significance was determined by Kruskal-Wallis test followed by Dunn’s multiple comparison test with n.s., not significant and ***, P<0.001. Scale bars: 5μm; 1μm (insets).
Figure 4.
Figure 4.. The first 100 AA of Cen direct RNA localization.
(A) Immunoblots from ovarian extracts from the indicated genotypes showing Cen protein products, as detected with anti-HA antibodies, relative to the β-Tub loading control. Truncated products are detected in the Cen-ATG lysate. (B) Schematic of the CenFL and Cen-ATG HA-tagged protein products showing predicted translation start sites, based on mass spectrometry analysis (see Figure S1). Maximum intensity projections of NC 13 (C) CenFL and (D) Cen-ATG embryos expressing GFP-Cnn and stained with Cen smFISH probes (magenta), C-term anti-Cen antibodies (yellow), and DAPI (blue) to label nuclei. Quantifications show (E) the percentage of RNA overlapping with centrosomes or (F) organized within granules 0 μm from the Cnn surface. Each dot represents a measurement from N= 9 CenFL and 6 Cen-ATG embryos. In all experiments, both transgenes were expressed in the Cen null background. Mean ± SD is displayed (red). Significance was determined by two-tailed Mann-Whitney test with **, p=0.0076 and ***, p=0.0004. Scale bars: 5μm; 1μm (insets).
Figure 5.
Figure 5.. Identification of the conserved Cen DLIC binding site.
(A) Clustal Omega sequence alignment of Drosophila Cen with the human paralogs CDR2 and CDR2L and several dynein activating cargo adaptors. Red box marks the conserved DLIC-binding motif (CC1 box). (B) Dlic-GFP associates with BicD (Dienstbier et al., 2009) and Cen in 0–5-hour embryonic extracts. Input and immunoprecipitated samples (IP) for GFP control and Dlic-GFP are indicated. (C) The Cen CC1 box was mutated, yielding an in-frame deletion of the 12 nucleotides that comprise amino acids (AA) 29–32 (GKTL; CenΔ12), while the CenΔ5 mutant is defined by a frameshift after AA 26 and a premature stop (asterisk). (D) Relative levels of Cen mRNA normalized to RP49 and the WT control in 0–2-hour embryos (up to NC 14) by qPCR. Bars show mean ± SD from three independent experiments. *, P<0.05 by Kruskal-Wallis multiple comparison test relative to WT; n.s., not significant. (E) Blot shows Cen protein detected in 0–2-hour embryos with a C’-terminal anti-Cen antibody relative to the actin loading control. No Cen protein was detected in null or CenΔ5 extracts.
Figure 6.
Figure 6.. The CC1 box supports Cen mRNA localization.
Maximum-intensity projections of NC 13 interphase embryos expressing GFP-Cnn (green) stained with Cen smFISH probes (magenta) and DAPI (blue nuclei). (A) Control embryos show Cen mRNA enriched at centrosomes in RNP granules, which are reduced in (B) CenΔ12 samples. (C) Cen mRNA localization and granule formation are abolished in CenΔ5 embryos. Quantification of the percentage of Cen or gapdh mRNA (D) overlapping with the centrosome surface and (E) residing in granules (0 μm distance from Cnn). Each dot represents a single measurement from control (N= 10 gapdh and 25 Cen mRNA), CenΔ12 (N= 30 gapdh and 30 Cen mRNA), and CenΔ5 (N= 14 gapdh and 27 Cen mRNA) labelled embryos. Mean ± SD displayed (red). Significance was determined by Kruskal-Wallis test followed by Dunn’s multiple comparison test relative to controls with n.s., not significant; *, P<0.05; **, P<0.01; and ****, P<0.0001. Scale bar: 5μm; 1μm (insets).
Figure 7.
Figure 7.. Disruption of the Cen CC1 box impairs spindle morphology.
Maximum-intensity projections of metaphase NC 12 embryos from embryos expressing GFP-Cnn (green, centrosomes) and stained for α-Tub to label microtubules (red) and DAPI (blue nuclei). (A) Control embryo showing bipolar spindles. Various spindle defects are noted in (B) Cen null, (C) CenΔ12, and (D) CenΔ5 embryos, including spindle inactivation (asterisks), detached centrosomes (arrowheads), and bent spindles (arrows). (E) Frequency of spindle defects from N=1622 spindles from n=7 control, N=1473 spindles from n=7 Cen null, n=2138 spindles from n=15 CenΔ12, and N=1842 spindles from n=12 CenΔ5 embryos. ****, P<0.00001 by Chi-square test. Scale bar: 5 μm.
Figure 8.
Figure 8.. Microtubules enrich Cen mRNA at centrosomes.
(A) Microtubule regrowth assay. Representative images of NC 11 embryos labeled with Cen smFISH probes (magenta) and antibodies for α-Tub (green) and Asl (yellow). Nuclei are labeled with DAPI (blue) in control, cold-shock, and recovery conditions. (B) Graph shows the Mander’s coefficient of colocalization for Cen mRNA overlapping with microtubules. Each dot is a measurement from N=6 interphase NC 10–11 control embryos. The RNA channel was rotated 90° to test for specificity of colocalization. (C) Maximum intensity projections of NC 12 interphase embryos from the indicated conditions labeled with Cen smFISH probes (magenta), Cnn (green) and Asl (yellow) antibodies, and DAPI (blue). Insets show Cnn structure and Cen mRNA distribution are affected by microtubule destabilization. (D) Quantification of the percentage of Cen mRNA localizing to centrosomes (<1 μm distance from Asl surface) from N=7 control, 9 cold-shocked, and 13 recovered NC 12 interphase embryos. Mean ± SD is displayed (red). Significance was determined by (B) two-tailed t-test and (D) one-way ANOVA followed by Dunnett’s multiple comparisons test relative to the control with n.s., not significant; **, P<0.01; and ***, P<0.001. Scale bars: 5 μm; 2 μm (insets).
Figure 9.
Figure 9.. Dynein targets Cen mRNA to centrosomes.
Maximum-intensity projections of NC 13 interphase embryos labeled with Cen smFISH (magenta), anti-Cnn antibodies (green; centrosomes), and DAPI (blue nuclei) in (A) WT, (B) DhcLOA hypomorphic, or (C) KhcRNAi embryos. Quantification shows the percentage of total mRNA that (D) overlaps with centrosomes and (E) resides in granules at centrosomes (0 μm distance from Cnn). Each dot represents a measurement from N= 19 WT, 13 DhcLOA and 14 KhcRNAi embryos. (E’) Log transformed RNA granule area from N=4127 granules from n=23 WT embryos and N=1412 granules from n=13 DhcLOA embryos; each dot represents a single granule. Mean ± SD displayed (red). Significance by (D and E) Kruskal-Wallis test followed by Dunn’s multiple comparison test relative to WT and (E’) unpaired t-test with n.s., not significant and ***, P<0.001. Scale bar: 5μm; 1 μm (inset).
Figure 10.
Figure 10.. The Egl RBD supports Cen mRNA localization.
Maximum-intensity projections of NC 13 interphase embryos expressing GFP-γ-Tub (green) labeled with Cen smFISH (magenta) and DAPI (blue) in (A) control EglWT and (B) EglRBD3 embryos. Quantification of the percentage of (C) total Cen mRNA and (D) mRNA in granules within the PCM zone (≤0.5 μm from γ-Tub surface). Each dot represents a measurement from 23 EglWT and 39 EglRBD3 embryos. (D’) Log transformed RNA granule area from N=2304 granules from n=23 EglWT embryos and N=4924 granules from n=39 EglRBD3 embryos; each dot represents a single granule. Mean ± SD displayed (red). Significance by unpaired t-test with **, P<0.01; and *** P<0.001. Scale bar: 5μm; 1μm (insets). (E) Model of the co-translational transport of Cen mRNA to centrosomes. Upon translation, an N’-terminal DLIC-binding CC1 box motif is exposed on the Cen nascent peptide, which associates with the dynein motor complex. We speculate Egl may bind to Cen mRNA. The Cen transport complex transits along microtubules via dynein to the centrosome. Additional on-site translation (Bergalet et al., 2020) may contribute to granule formation and/or stabilization.

References

    1. Apweiler R., Attwood T.K., Bairoch A., Bateman A., Birney E., Biswas M., Bucher P., Cerutti L., Corpet F., Croning M.D., Durbin R., Falquet L., Fleischmann W., Gouzy J., Hermjakob H., Hulo N., Jonassen I., Kahn D., Kanapin A., Karavidopoulou Y., Lopez R., Marx B., Mulder N.J., Oinn T.M., Pagni M., Servant F., Sigrist C.J., Zdobnov E.M., and InterPro C.. 2000. InterPro--an integrated documentation resource for protein families, domains and functional sites. Bioinformatics. 16:1145–1150. - PubMed
    1. Bellen H.J., Levis R.W., Liao G., He Y., Carlson J.W., Tsang G., Evans-Holm M., Hiesinger P.R., Schulze K.L., Rubin G.M., Hoskins R.A., and Spradling A.C.. 2004. The BDGP gene disruption project: single transposon insertions associated with 40% of Drosophila genes. Genetics. 167:761–781. - PMC - PubMed
    1. Bergalet J., Patel D., Legendre F., Lapointe C., Benoit Bouvrette L.P., Chin A., Blanchette M., Kwon E., and Lecuyer E.. 2020. Inter-dependent Centrosomal Co-localization of the cen and ik2 cis-Natural Antisense mRNAs in Drosophila. Cell Rep. 30:3339–3352 e3336. - PubMed
    1. Besse F., and Ephrussi A.. 2008. Translational control of localized mRNAs: restricting protein synthesis in space and time. Nat Rev Mol Cell Biol. 9:971–980. - PubMed
    1. Bolte S., and Cordelieres F.P.. 2006. A guided tour into subcellular colocalization analysis in light microscopy. J Microsc. 224:213–232. - PubMed

Publication types

LinkOut - more resources