[Preprint]. 2024 Aug 10:2024.08.09.607015.
doi: 10.1101/2024.08.09.607015.

Identification of Meibomian gland stem cell populations and mechanisms of aging

Affiliations

Identification of Meibomian gland stem cell populations and mechanisms of aging

Xuming Zhu et al. bioRxiv. .

Update in

Abstract

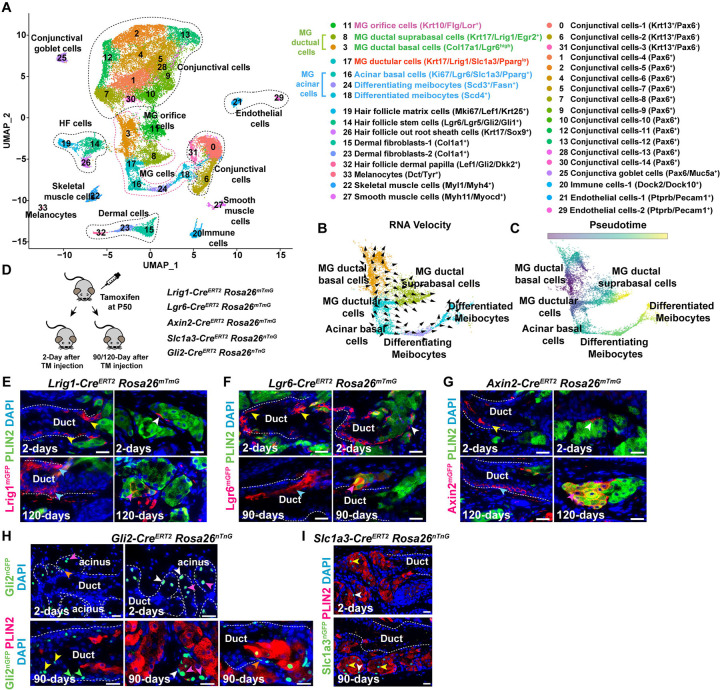
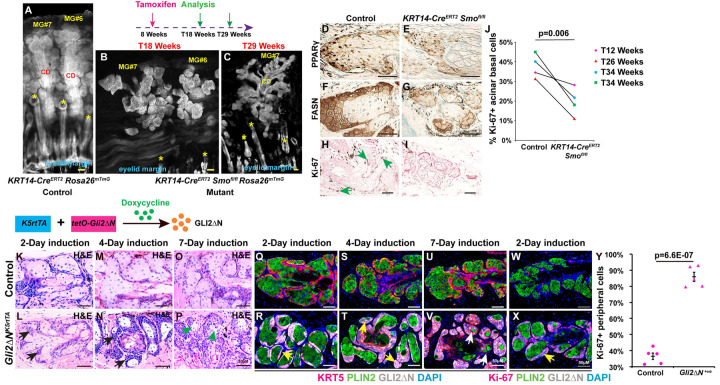
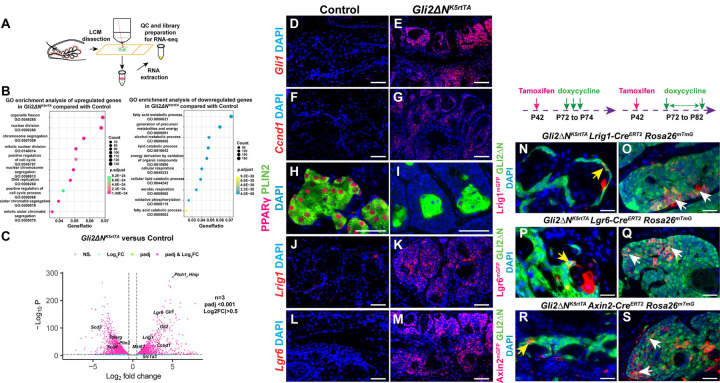
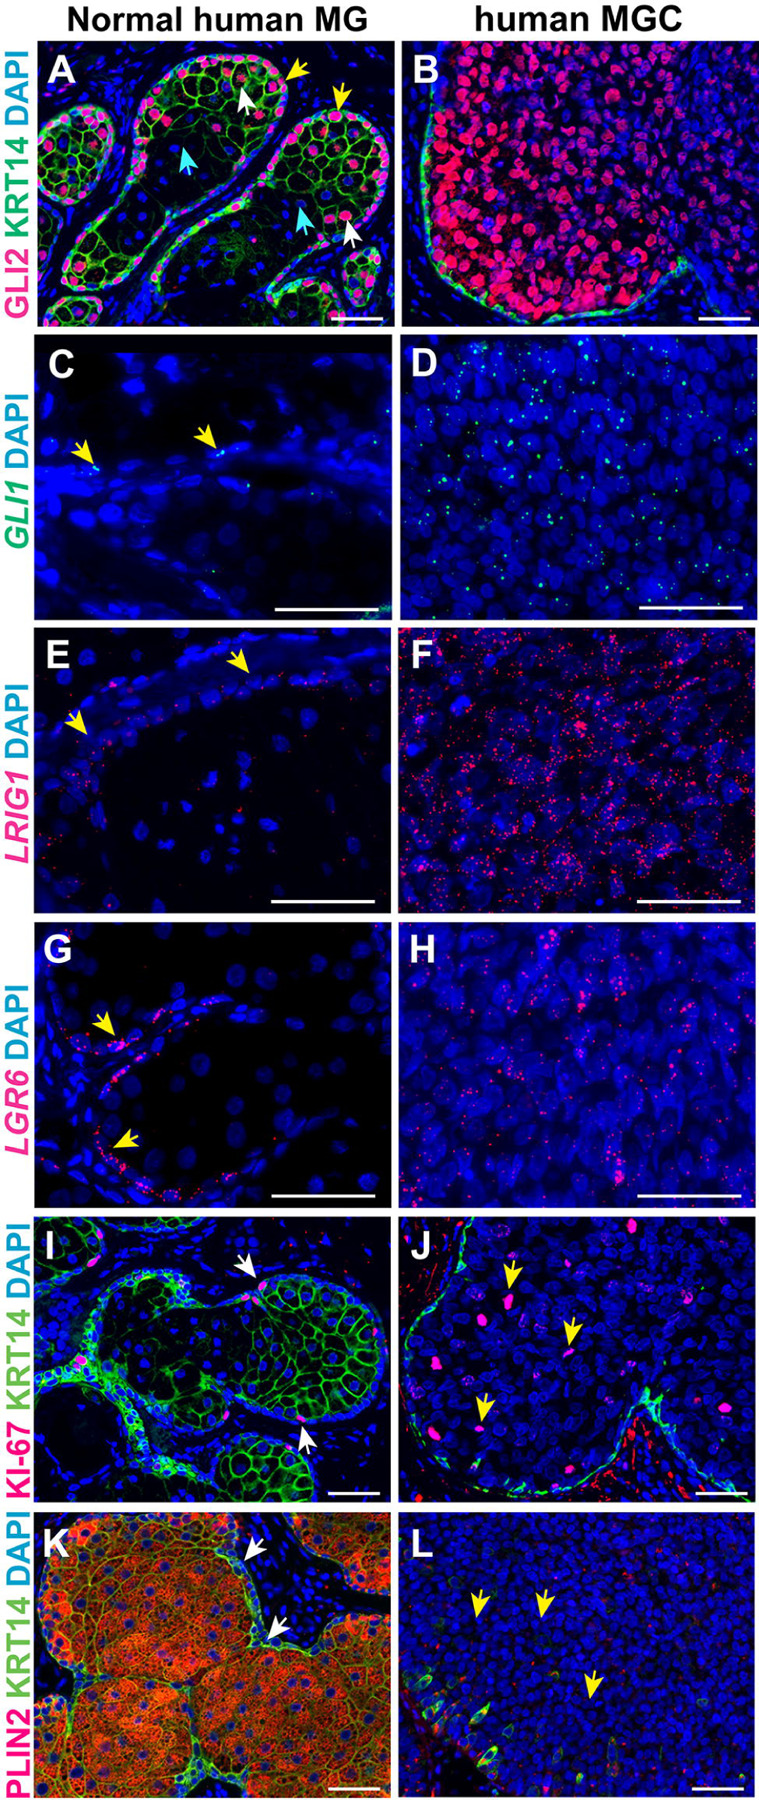
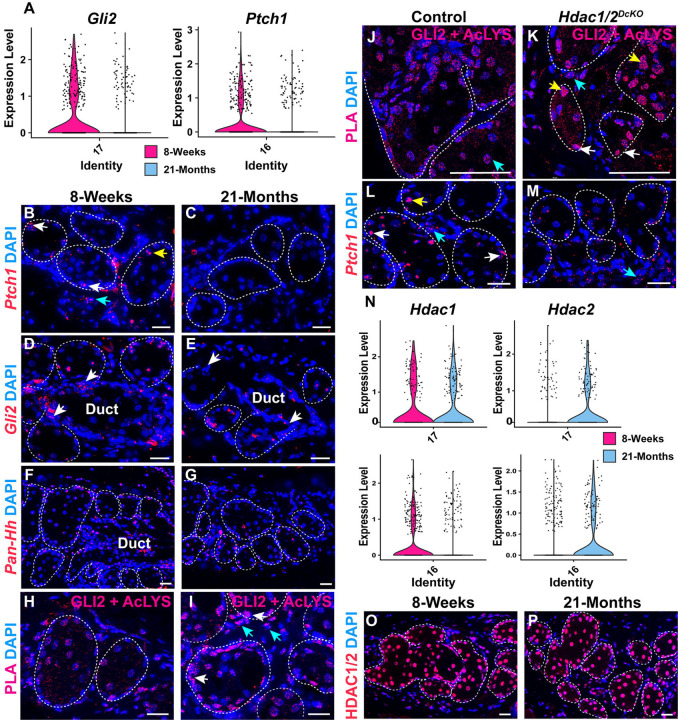
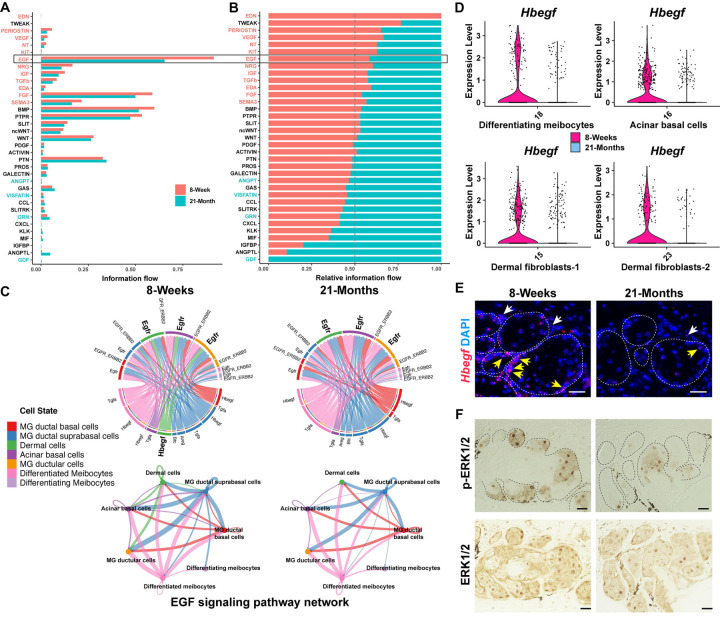
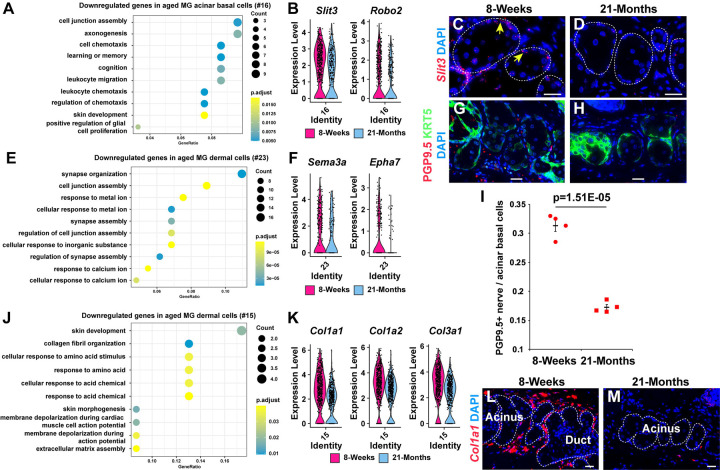
Meibomian glands secrete lipid-rich meibum, which prevents tear evaporation. Aging-related Meibomian gland shrinkage may result in part from stem cell exhaustion and is associated with evaporative dry eye disease, a common condition lacking effective treatment. The identities and niche of Meibomian gland stem cells and the signals controlling their activity are poorly defined. Using snRNA-seq, in vivo lineage tracing, ex vivo live imaging, and genetic studies in mice, we identified markers for stem cell populations that maintain distinct regions of the gland and uncovered Hh signaling as a key regulator of stem cell proliferation. Consistent with this, human Meibomian gland carcinoma exhibited increased Hh signaling. Aged glands displayed decreased Hh and EGF signaling, deficient innervation, and loss of collagen I in niche fibroblasts, indicating that alterations in both glandular epithelial cells and their surrounding microenvironment contribute to age-related degeneration. These findings suggest new approaches to treat aging-associated Meibomian gland loss.

Keywords: EGF; GLI2; Hedgehog signaling; Meibomian gland; Smoothened; lineage tracing; live imaging; snRNA-seq; stem cells.


Conflict of interest statement

Declaration of interests The authors declare no competing interests.

Figures

Figure 1.
Figure 1.. Identification of distinct MG stem cell populations.
(A) UMAP plot of snRNA-seq data from pooled tarsal plate samples from four 8-week-old and four 21-month-old male mice, respectively, with two replicates for each age. (B, C) RNA Velocity (B) and pseudotime analyses (C) predictions of the differentiation trajectories of MG cellular subpopulations. RNA Velocity (B) predicts that ductular cells can differentiate towards either duct or acinus. (D) Scheme for lineage tracing. (E) Lrig1+ cells in MG ductal basal layer (yellow arrows) and acinar basal layer (white arrow) self-renew and generate progeny that contribute to MG duct (light blue arrows) and acinus (pink arrow). (F) Lgr6+ cells in MG duct (yellow arrows) and acinar basal layer (white arrow) self-renew and contribute to MG duct (light blue arrow) and acinus (pink arrow). (G) Axin2+ cells in the MG duct (yellow arrows) and acinar basal layer (white arrow) self-renew and replenish MG duct (light blue arrow) and acinus (pink arrow). (H) At 2 days, Gli2 marks acinar basal cells (white arrowheads), ductules (orange arrowhead), and meibocytes (white arrowheads); at 90 days, lineage-traced cells are present in MG duct (yellow and green blue arrowheads), ductule (orange arrowhead) and acinus (white and pink arrowheads). (I) At 2 days, Slc1a3 marks meibocytes (yellow arrowhead) and acinar basal cells (white arrowhead); at 90 days, lineage tracing labels the acinar basal layer (white arrowhead) and meibocytes (yellow arrowheads). Scale bars: (B-D), 50μm; (E, G-K), 25μm. White dashed lines in (E-I) outline MG acini and ducts. 3 mice of each genotype were analyzed in lineage tracing experiments for each line and stage. See also Figures S1-S4; Video 1; Video 2.
Figure 2.
Figure 2.. Hh signaling promotes and is required for normal levels of acinar basal cell proliferation.
(A-C) Whole-mount fluorescence images of MG #6 and/or MG #7 in (A) KRT14-CreERT2 Rosa26mTmG control mice 29 weeks after tamoxifen treatment (T29Weeks); (B) KRT14-CreERT2 Smofl/fl Rosa26mTmG mice 18 weeks after tamoxifen treatment (T18 Weeks); (C) KRT14-CreERT2 Smofl/fl Rosa26mTmG mice at T29 Weeks. Yellow asterisks indicate hair follicles; CD, MG central duct. (D-G) IHC for PPARγ (D, E) and FASN (F, G) showing similar expression levels in control (D, F) and Smo-deficient (E, G) MGs at 34 weeks after tamoxifen treatment. (H, I) IHC for Ki-67 showing reduced acinar basal cell proliferation in Smo-deficient MGs at 34 weeks after tamoxifen treatment (I) compared with control (H, green arrowheads). (J) Quantitation of the % of Ki-67+ cells in the acinar basal layer of control and Smo-deficient MGs. Littermate pairs were compared. Statistical significance was calculated using a paired two-tailed Student’s t-test. N=4 control and N=4 Smo-deficient mice were analyzed at each stage. At least 70 acinar basal cells were analyzed per mouse. (K-P) Progressive expansion of acinar basal cell clusters (black arrows) in GLI2∆N-expessing MG after 2 (K, L), 4 (M, N) and 7 (O, P) days of doxycycline treatment. Meibocytes were reduced by 7 days (P, green arrows). (Q-V) Progressive expansion of GLI2∆N+/KRT5+ cells (yellow arrows) and reduction of PLIN2+ meibocytes (white arrows) in Gli2∆NK5rtTA MG acini after 2 (Q, R), 4 (S, T) and 7 (U, V) days of doxycycline treatment. (W, X) Hyperproliferation of GLI2∆N+ cells in Gli2∆NK5-rtTA MG acini (yellow arrow). (Y) Quantification of acinar basal cell proliferation. Samples from n=5 control mice lacking K5-rtTA or tetO-GLI2∆N and samples from n=5 Gli2∆NK5-rtTA mice were analyzed. At least 100 acinar cells were analyzed from each animal. Statistical significance was calculated with unpaired two-tailed Student’s t-test. Data are presented as mean +/− SEM. Scale bars: 50 μm. See also Figure S5.
Figure 3.
Figure 3.. Forced GLI2∆N expression expands MG stem cell populations and impedes meibocyte differentiation.
(A) Scheme for bulk RNA-seq of laser-captured MG samples. (B) GO enrichment analysis of bulk RNA-seq data from GLI2∆NK5rtTA and littermate control MGs 4 days after induction showing the top 10 enriched pathways. (C) Volcano plot showing genes upregulated or downregulated at 4 days. N=3 GLI2∆NK5rtTA samples and n=3 littermate controls lacking K5-rtTA or tetO-GLI2∆N; differentially expressed genes were defined as padj<0.001 and Log2FC<−0.5 or Log2FC>0.5. (D-G) RNAscope showing upregulation of Gli1 and Ccnd1 in GLI2∆NK5rtTA MGs. (H-I) IF data showing decreased PPARγ and PLIN2 expression in GLI2∆NK5rtTA acini. (J-M) RNAscope showing expanded Lrig1 and Lgr6 expression in GLI2∆NK5rtTA MGs. Independent samples from 3 Gli2∆NK5-rtTA mice and 3 littermate controls of genotypes tetO-GLI2∆N or K5-rtTA were used for RNAscope and IF; all mice were doxycycline-treated for 4 days. (N-S) GLI2∆NK5-rtTA Rosa26mTmG mice carrying inducible Cre alleles driven by Lrig1 (N, O), Lgr6 (P, Q) or Axin2 (R, S) promoters were tamoxifen induced at P42 to induce Cre activity and placed on oral doxycycline at P72 to induce GLI2∆N expression. mGFP expression (red signal) and GLI2 expression (green signal) were analyzed by IF at P74 (N, P, R) or P82 (O, Q, S). GLI2∆N-expressing cells in the acinar basal layer positive for Lrig1 (N), Lgr6 (P) or Axin2 (R) (yellow arrows) give rise to clones that contribute to MG overgrowth (O, Q, S, white arrows). N=3 samples were analyzed per line per time point. Scale bars: (D-M), 50 μm; (N-S), 25 μm.
Figure 4.
Figure 4.. GLI2-, LRIG1- and LGR6-expressing undifferentiated cells are expanded in human MGC.
(A, B) In normal human MG GLI2 protein localizes to acinar basal cells (A, yellow arrows) and differentiating meibocytes (A, white arrows) but is absent from fully differentiated meibocytes (A, light blue arrows); in MGC samples GLI2 is broadly expressed (B). (C, D) In normal human MG, GLI1 mRNA is weakly expressed in some acinar basal cells (C, yellow arrows); GLI1+ cells are widely present in MGCs (D). (E-H) LRIG1+ and LGR6+ cells are primarily present in the acinar basal layer of normal human MGs (E, G, yellow arrows); MGC displays expansion of LRIG1+ and LGR6+ cells (F, H). (I, J) Ki-67+ cells localize to the normal human acinar basal layer (I, white arrows) and are expanded in MGC (J, yellow arrows). (K, L) PLIN2-/KRT14+ cells are restricted to the acinar basal layer in normal human MG (K, white arrows) but are present throughout MGC tissue (L, yellow arrows). 7 normal human MG and 10 human MGC samples were analyzed; representative data are shown. Scale bars: 50 μm.
Figure 5.
Figure 5.. Aged MGs exhibit fewer cells with Hh activity and elevated association of GLI2 with acetyl-lysine.
(A) Violin plots derived from snRNA-seq data show relatively reduced percentages of cells expressing Gli2 and Ptch1 in the ductule and acinar basal layer, respectively, in aged compared to young MGs. (B, C) Ptch1 is expressed in acinar basal cells (B, white arrow), some meibocytes (B, yellow arrow), and surrounding stromal cells (B, blue arrow) at 8 weeks; fewer Ptch1-expressing cells are present in aged MG (C). (D, E) Fewer Gli2-expressing cells are present in aged MG particularly in the ductule (D, E, white arrows). (F, G) RNAscope using a pan-Hh probe reveals similar expression of mRNA for Hh ligands in the acini of young (F) and aged (G) MGs. (H, I) PLA for GLI2 and acetyl-lysine shows that close association (<40nm) of GLI2 with acetyl-lysine is elevated in subsets of cells within aged (I) compared with young (H) MG acini (I, white arrows) and stroma (I, blue arrows). (J, K) Association of GLI2 and acetyl-lysine is elevated in the acinar basal layer (K, white arrows) and meibocytes (K, yellow arrows) but not stromal cells (J, K, blue arrows) in K5-rtTA tetO-Cre Hdac1fl/fl Hdac2fl/fl (Hdac1/2DcKO) mice doxycycline induced from P48 and analyzed at P58 compared to control mice of genotype Hdac1fl/fl Hdac2fl/fl and lacking K5-rtTA or tetO-Cre. (J). (L, M) Ptch1 expression in control acinar basal cells (L, white arrows) and differentiating acinar cells (L, yellow arrow) is reduced in HDAC1/2-deficient MG acini (M); stromal Ptch1 expression is similar in mutants and controls (L, M, blue arrows). (N) Violin plots of snRNA-seq data indicate that there is a relatively lower percentage of Hdac1-expressing acinar basal cells (cluster #16) but a higher percentage of Hdac2-expressing acinar basal cells and ductular cells (cluster #17) in aged compared to young MG. (O, P) IF for HDAC1/2 shows similar expression in young (O) and aged (P) MGs. White dashed lines in (B-M; O, P) outline MG acini and/or ducts. 3 mice of each age and genotype were used for RNAscope and PLA. Scale bars: 25 μm. See also Figure S6.
Figure 6.
Figure 6.. HBEGF signaling is disrupted in aged MGs.
(A, B) CellChat analysis predicts decreased EGF signaling in aged MGs. (C) CellChat analysis predicts HBEGF signaling between dermal cells and MG ductular cells (green) at 8-weeks and its absence at 21-months. (D) Violin plots of snRNA-seq data show decreased percentages of Hbegf-expressing cells in the indicated cell populations in aged MG. (E) RNAscope shows reduced Hbegf expression levels per cell and fewer acinar basal cells (yellow arrows) and surrounding dermal cells (white arrows) expressing Hbegf in aged MG. (F) IHC shows that p-ERK1/2 levels are decreased but total ERK1/2 levels are similar in the acini of aged compared with young MG. White dashed lines in (E) and black dashed lines in (F) outline MG acini. Three pairs of 8-week and 21-month samples were used for RNAscope and IHC. Scale bars represent 25 μm.
Figure 7.
Figure 7.. Aged MGs exhibit reduced peripheral innervation and collagen I expression.
(A) GO analysis of genes with statistically significantly reduced expression in aged compared with young acinar basal cells (cluster #16). (B) Violin plots for neuronal guidance genes in acinar basal cells. (C, D) Slit3 mRNA expression (yellow arrows) is reduced in aged MG acinar basal cells. (E, F) GO analysis of genes with reduced expression in aged cluster #23 dermal cells (E) and violin plots for neuronal guidance genes (F). (G, H) Reduced numbers of PGP9.5 nerve fibers (red) adjacent to the KRT5+ acinar basal layer (green) in aged mice. (I) Quantification of PGP9.5+ nerve fibers within 5 μM of each KRT5+ acinar basal cell in young and aged MGs. Four pairs of 8-week-old and 21-month-old male mice were used for quantification. At least 185 acinar basal cells were analyzed from each mouse. Significance in (I) was calculated by an unpaired two-tailed Student’s t-test. Data are represented as mean +/− SEM. (J, K) GO analysis of genes with reduced expression in aged cluster #15 dermal fibroblasts (J) and violin plots for type I collagen genes in dermal fibroblasts (K). (L, M) Reduced expression of Col1a1 (red) in aged (M) versus young (L) dermis surrounding MG acini. White dashed lines in (C, D, L, M) outline MG acini and/or ducts. 3 pairs of 8-week and 21-month samples were used for RNAscope, IF and IHC. Scale bars represent 25 μm. See also Figure S7.

Similar articles

References

    1. Sun M., Moreno I.Y., Dang M., and Coulson-Thomas V.J. (2020). Meibomian Gland Dysfunction: What Have Animal Models Taught Us? Int J Mol Sci 21. 10.3390/ijms21228822. - DOI - PMC - PubMed
    1. Jester J.V., Parfitt G.J., and Brown D.J. (2015). Meibomian gland dysfunction: hyperkeratinization or atrophy? BMC Ophthalmol 15 Suppl 1, 156. 10.1186/s12886-015-0132-x. - DOI - PMC - PubMed
    1. Obata H. (2002). Anatomy and histopathology of human meibomian gland. Cornea 21, S70–74. 10.1097/01.ico.0000263122.45898.09. - DOI - PubMed
    1. Knop E., Knop N., Millar T., Obata H., and Sullivan D.A. (2011). The international workshop on meibomian gland dysfunction: report of the subcommittee on anatomy, physiology, and pathophysiology of the meibomian gland. Invest Ophthalmol Vis Sci 52, 1938–1978. 10.1167/iovs.10-6997c. - DOI - PMC - PubMed
    1. Wolff E., Bron A.J., Tripathi R.C., and Tripathi B.J. (1997). Anatomy of the eye and orbit, 8th Edition (Chapman & Hall Medical; ).

Publication types

LinkOut - more resources