[Preprint]. 2024 Aug 9:2024.08.09.606346.
doi: 10.1101/2024.08.09.606346.

Adaptive immunity to retroelements promotes barrier integrity

Affiliations

Adaptive immunity to retroelements promotes barrier integrity

Alexandria C Wells et al. bioRxiv. .

Abstract

Maintenance of tissue integrity is a requirement of host survival. This mandate is of prime importance at barrier sites that are constitutively exposed to the environment. Here, we show that exposure of the skin to non-inflammatory xenobiotics promotes tissue repair; more specifically, mild detergent exposure promotes the reactivation of defined retroelements leading to the induction of retroelement-specific CD8+ T cells. These T cell responses are Langerhans cell dependent and establish tissue residency within the skin. Upon injury, retroelement-specific CD8+ T cells significantly accelerate wound repair via IL-17A. Collectively, this work demonstrates that tonic environmental exposures and associated adaptive responses to retroelements can be coopted to preemptively set the tissue for maximal resilience to injury.


Figures

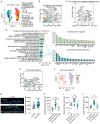
Fig. 1.
Fig. 1.. Environmental exposures recruit CD8+ T cells to the skin.
(A) Left, experimental design of detergent exposure. Middle, representative FACS plots showing frequencies of CD8β+ T cells in ear pinnae skin of unexposed (control), or detergent exposed (BHI-tween, BHI-SDS) animals. Right, quantification of CD8β+ T cells in (left) absolute numbers or (right) as fold change in absolute numbers in detergent exposed mice compared to control animals. (B) Absolute numbers of IL-17A- and IFN-γ-producing lymphocytes in ear pinnae skin at the indicated time after BHI-tween exposure. Lymphocytes shown are CD8β+ T cells, Mucosal-associated Invariant T cells (MAIT), CD4+FoxP3 helper T cells (Th), TCRγδ-mid T cells. (C) Representative FACS plots showing the frequencies of IL-17A- and IFN-γ-producing lymphocytes in ear pinnae skin 14 days after BHI-tween exposure. (D) Representative histograms showing expression of RORγt, CCR6, ICOS, T-bet, KLRG1, and CD127 by Tc17 cells in ear pinnae skin of mice 14 days after BHI-tween exposure, or total CD8β+ T cells in ear pinnae skin of control animals. Dashed gray line represents fluorescence minus one (FMO) controls. (E) Representative whole mount confocal microscopy images of CD8β+ T cells in the ear pinnae skin of control animals or mice 14 days after BHI-tween application. Scale bars are 50 μm. HF, hair follicle (F) (Left) frequencies or (right) representative FACS plots showing frequencies of CD69+ CD103+ CD8β+ T cells in ear pinnae skin at the indicated time after BHI-tween exposure. (G) (Left) frequencies or (right) representative FACS plots of host-derived CD8β+ T cells in the spleen or flank skin of parabiotic mice, as indicated by either CD45.1+ or CD45.2+ cells within the CD8β+ T cell compartment. (A-G) Data are representative of at least two independent experiments. (A, G) Each dot represents an individual mouse. (B, F) Each dot represents the mean of five individual mice. Numbers in representative flow plots indicate mean ± SEM. * p < 0.05; ** p < 0.01; *** p < 0.001; **** p < 0.0001; ns, not significant (One-way ANOVA with Dunnett’s multiple comparison test (compared to control or day 0) for A, B, F; two-tailed unpaired Student’s t test for G).
Fig. 2.
Fig. 2.. Detergent exposure reactivates expression of endogenous retroelements.
(A) (Top) representative FACS plots showing frequencies, or (bottom left) absolute numbers of CD8β+ T cells in ear pinnae skin of specific pathogen-free (SPF) or germ-free (GF) mice 14 days after BHI-tween exposure or of control animals. Bottom right, fold change in absolute numbers of CD8β+ T cells in ear pinnae skin of SPF or GF mice 14 days after detergent exposure compared to control SPF or GF mice, respectively. (B) (Top) representative FACS plots showing frequencies or (bottom) absolute numbers of CD8β+ T cells in ear pinnae skin of control or detergent exposed Foxp3YFP-CreGata3fl/wt (wild type) or Foxp3YFP-CreGata3fl/fl animals. (C) Heatmap displaying fold change of significantly differentially expressed retroelement elements (FC > 2, FDR < 0.05) by RNA-sequencing of whole homogenized ear pinnae skin from control mice or animals exposed to BHI-tween daily for 7 days. Retroelement elements are listed on the left, and retroelement classes on the right. (D-E) Protein abundance displayed as Integrated MFI (iMFI) of the (D) MLV envelope or (E) LINE-1 ORF1p by flow cytometry in keratinocytes, conventional dendritic cells type 1 (cDC1), long-term Langerhans cells (LCLT, EpCAMhi), or short-term Langerhans cells (LCST, EpCAMlo) in control animals. (F) Heatmap displaying row Z-score of retroelement elements from RNA-sequencing of detergent-exposed Langerhans cells (LC), keratinocytes (KC; Sca-1+, CD49f+), and conventional dendritic cells (cDC1/2) sort-purified from ear pinnae skin exposed daily to BHI-tween for 7 days. (Left) Short-Interspersed Nuclear Elements (SINE), (middle) Long-Interspersed Nuclear Elements (LINE), (right) Long Terminal Repeats (LTR). Retroelement families are listed on the right. Deu, deuterostome; ID, identifier; MIR, mammalian-wide interspersed repeat; RTE, retrotransposable element clade; ERV, endogenous retrovirus; MaLR, mammalian apparent LTR retrotransposon. (G) Volcano plot displaying differentially expressed retroelement loci identified by RNA-sequencing in bulk Langerhans cells sort-purified from ear pinnae skin of mice exposed to BHI-tween daily for 7 days as compared to control mice. (A, B, D, E) Data are representative of at least two independent experiments. Each dot represents an individual mouse. Numbers in representative flow plots indicate mean ± SEM. * p < 0.05; ** p < 0.01; *** p < 0.001 (two-way ANOVA with Tukey’s multiple comparisons test for A; two-tailed unpaired Student’s t test for B, D, E).
Fig. 3.
Fig. 3.. Langerhans cells are required for CD8+ T cell responses to mild detergent.
(A) (Left) representative FACS plots showing the frequencies or (right) absolute numbers of CD8β+ T cells in ear pinnae skin of wild type or Ccr7−/− animals either as a control or exposed to BHI-tween 14 days prior. (B) (Left) absolute numbers of migratory dDC1 or Langerhans cells, or (right) frequencies of dDC1 and Langerhans cells among all migratory DCs in the ear pinnae-regional lymph node at the indicated time after BHI-tween exposure. Peak accumulation of CD8β+ T cells in the skin is highlighted. (C) (Left) top 18 GO terms enriched in Langerhans cells from mice exposed to BHI-tween daily for 7 days. (Right) top 35 genes enriched in detergent-exposed Langerhans cells related to Langerhans cell (top) activation/ migration or (bottom) immune stress response. (D) Experimental design of diphtheria toxin treatment to deplete Langerhans cells throughout the response to BHI-tween exposure. DTX, diphtheria toxin. (E) (Left) representative FACS plots showing the frequencies or (right) absolute numbers of CD8β+ T cells in ear pinnae skin 14 days after BHI-tween treatment of huLangerin-DTR mice treated either with PBS (Langerhans cells sufficient) or diphtheria toxin (DTX, Langerhans cells depleted). (A, B, D) Data are representative of at least two independent experiments. Each dot represents an individual mouse. Numbers in representative flow plots indicate mean ± SEM. *** p < 0.001; **** p < 0.0001; ns, not significant (two-way ANOVA with Tukey’s multiple comparisons test for A; one-way ANOVA with Dunnett’s multiple comparison test (compared to day 0) for B; two-tailed unpaired Student’s t test for D).
Fig. 4.
Fig. 4.. LINE-1-specific CD8+ T cells clonally expand in response to detergent exposure.
(A) Pipeline used to generate tetramers to identify ERE-specific CD8β+ T cells. (B) Heatmap displaying expression of retroelement loci from RNA-sequencing of bulk Langerhans cells, keratinocytes (Sca-1+, CD49f+), and conventional dendritic cells (cDC1/2) sort-purified from ear pinnae skin exposed daily to BHI-tween for 7 days. Medullary Thymic Epithelial Cells (mTECs) were sort-purified from unexposed wild type mice, data was extracted from (Cowan 2019 NC). LINE-1: Long-Interspersed Nuclear Element-1, ERVK: Endogenous Retrovirus-K, ERV-1: Endogenous Retrovirus-1. (C) Absolute numbers of CD8β+ T cells producing either (left) IL-17A or (right) TNF-α in response to ex vivo stimulation with dendritic cells from unexposed control mice pulsed with ERE-derived peptides. Peptides in bold were selected to generate tetramers. (D) FACS plots showing the frequencies of KSINVIHYI:H2-Db+ or ISLMNINAKIL:H2-Db+ CD8β+ T cells in the ear pinnae skin of control animals or mice exposed to BHI-tween 14 days prior. Plots are concatenated from three mice. (E) Number of CD44+ KSINVIHYI:H2-Db+ CD8β+ T cells relative to total CD8β+ T cells in ear pinnae skin, ear pinnae-regional lymph node (rLN), and spleen at the indicated time after BHI-tween exposure. (F) Representative histograms showing expression of RORγt, CCR6, and T-bet by KSINVIHYI:H2-Db+ CD8β+ T in ear pinnae skin, ear pinnae-regional lymph node, and spleen of mice 14 days after BHI-tween exposure, or the rLN of control animals. (G) (Left) frequencies or (right) representative FACS plots showing frequencies of host- or donor-derived KSINVIHYI:H2-Db+ CD8β+ T cells, as indicated by either CD45.1+ or CD45.2+, in the spleen or ear pinnae skin of parabiotic mice. (H) UMAP projection plot showing CD8β+ T cells sort-purified from ear pinnae skin exposed to BHI-tween 14 days prior or 7 days post-HSV-1 infection by scRNA-seq. (I) Circos plot showing clonal sharing between treatment groups. (J) UMAP projection plot or (K) bar plot showing the relative abundance of CD8β+ T cell clonotype expansion (determined by TCR amino acid sequence via scRNA-seq). (C-G) Data are representative of at least two independent experiments. Numbers in representative flow plots indicate mean ± SEM. (C) Each dot represents a technical replicate. (E) Each dot represents the average of 5 mice. (G) Spleen, each dot represents an individual mouse. Skin, each dot represents 4 concatenated mice. * p < 0.05; ** p < 0.01; *** p < 0.001; **** p < 0.0001; ns, not significant (two-tailed unpaired Student’s t test for C, G).
Fig. 5.
Fig. 5.. Detergent-induced CD8+ T cells are enriched for a repair signature and accelerate wound repair
(A) UMAP projection plot showing ear pinnae skin CD8β+ T cells sort-purified from animals 14 days post-BHI-tween exposure or 7 days post-HSV-1 infection by scRNA-seq. (B-E) CCR6 CD8β+ T cells (Tc1) or CCR6+ CD8β+ T cells (Tc17) were sort-purified from ear pinnae skin of HSV-1-infected or BHI-tween-exposed animals, respectively, for bulk RNA-sequencing analysis. (B) Scatterplot showing genes related to type 1 and type 17 signatures in Tc1 and Tc17 cells. (C) Volcano plot showing differentially expressed genes comparing Tc1 and Tc17 cells. (D) (Right) top 20 GO terms enriched in Tc17 compared to Tc1 cells, or (left) top 25 genes enriched in detergent-exposed Tc17 cells related to (top) activation/ type 17 signature and (bottom) tissue repair/ epithelial regeneration. (E) Scatterplot showing genes related to tissue repair in Tc1 and Tc17 cells. (F) UMAP projection plot showing the wound repair signature by scRNA-seq in CD8β+ T cells sort-purified from ear pinnae skin of animals 14 days post-BHI-tween exposure or 7 days post-HSV-1 infection. (G-J) Mice were untreated or exposed to BHI-tween 12 days prior to back skin punch biopsy, and epithelial tongue length measured 5 days after wounding. (G) (Left) representative immunofluorescence images or (right) quantification of epidermal tongue length. Tissue sections are stained for basal keratinocytes (keratin 14, green) and DAPI (blue). White dashed lines represent the epidermal tongue length during re-epithelialization of the wound. Scale bars are 500 μm. (H) Quantification of the epidermal tongue length in control mice or BHI-tween exposed mice treated with either an isotype control antibody (IgG) or an anti-CD8α depleting antibody (α-CD8), or (I) an isotype control antibody (IgG) or an anti-IL-17A blocking antibody (α-IL-17A). (J) Quantification of the epidermal tongue length at 5 days after wounding wild type or Il17a−/− mice exposed to BHI-tween or control mice. (G-J) Data are representative of two independent experiments. Each dot represents the measured length of an individual epidermal tongue. * p < 0.05; ** p < 0.01; *** p < 0.001; **** p < 0.0001; ns, not significant (two-tailed unpaired Student’s t test, G-J).

References

    1. Kobayashi T, Naik S, Nagao K. Choreographing Immunity in the Skin Epithelial Barrier. Immunity. 2019;50(3):552–65. - PMC - PubMed
    1. Belkaid Y, Artis D. Immunity at the barriers. Eur J Immunol. 2013;43(12):3096–7. - PMC - PubMed
    1. Konieczny P, Xing Y, Sidhu I, Subudhi I, Mansfield KP, Hsieh B, et al. Interleukin-17 governs hypoxic adaptation of injured epithelium. Science. 2022;377(6602):eabg9302. - PMC - PubMed
    1. Di Domizio J, Belkhodja C, Chenuet P, Fries A, Murray T, Mondejar PM, et al. The commensal skin microbiota triggers type I IFN-dependent innate repair responses in injured skin. Nat Immunol. 2020;21(9):1034–45. - PubMed
    1. Linehan JL, Harrison OJ, Han SJ, Byrd AL, Vujkovic-Cvijin I, Villarino AV, et al. Non-classical Immunity Controls Microbiota Impact on Skin Immunity and Tissue Repair. Cell. 2018;172(4):784–96 e18. - PMC - PubMed

Publication types