[Preprint]. 2025 Apr 19:2024.08.05.606694.
doi: 10.1101/2024.08.05.606694.

Inhibitory basal ganglia nuclei differentially innervate pedunculopontine nucleus subpopulations and evoke differential motor and valence behaviors

Affiliations

Inhibitory basal ganglia nuclei differentially innervate pedunculopontine nucleus subpopulations and evoke differential motor and valence behaviors

Michel Fallah et al. bioRxiv. .

Update in

Abstract

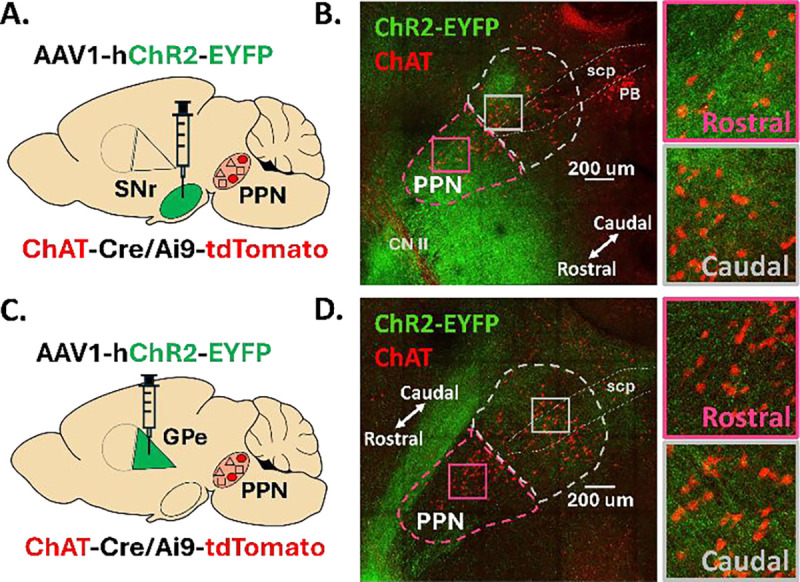
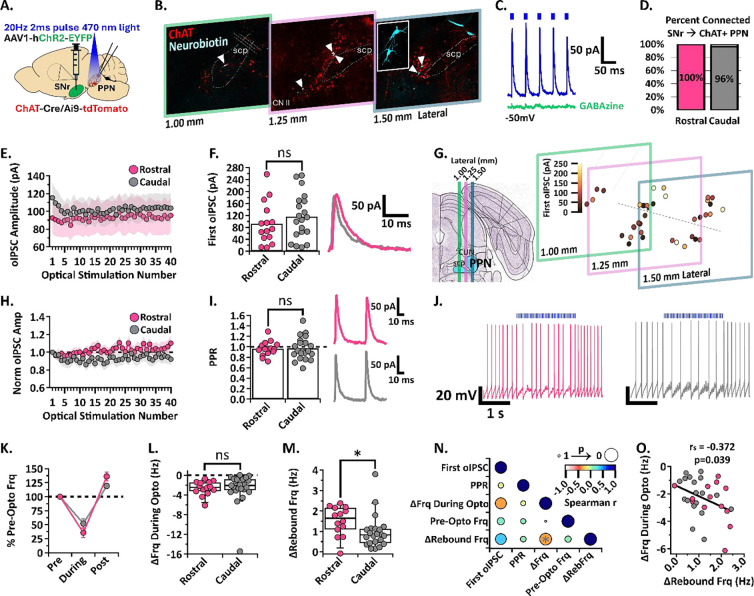
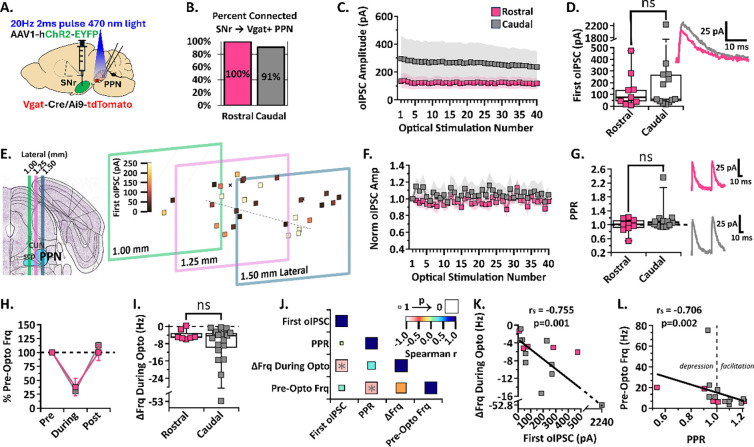
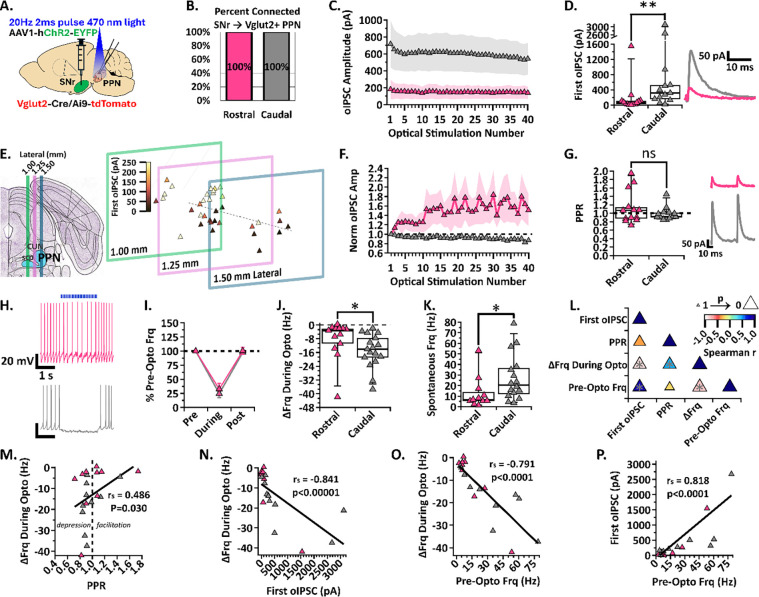
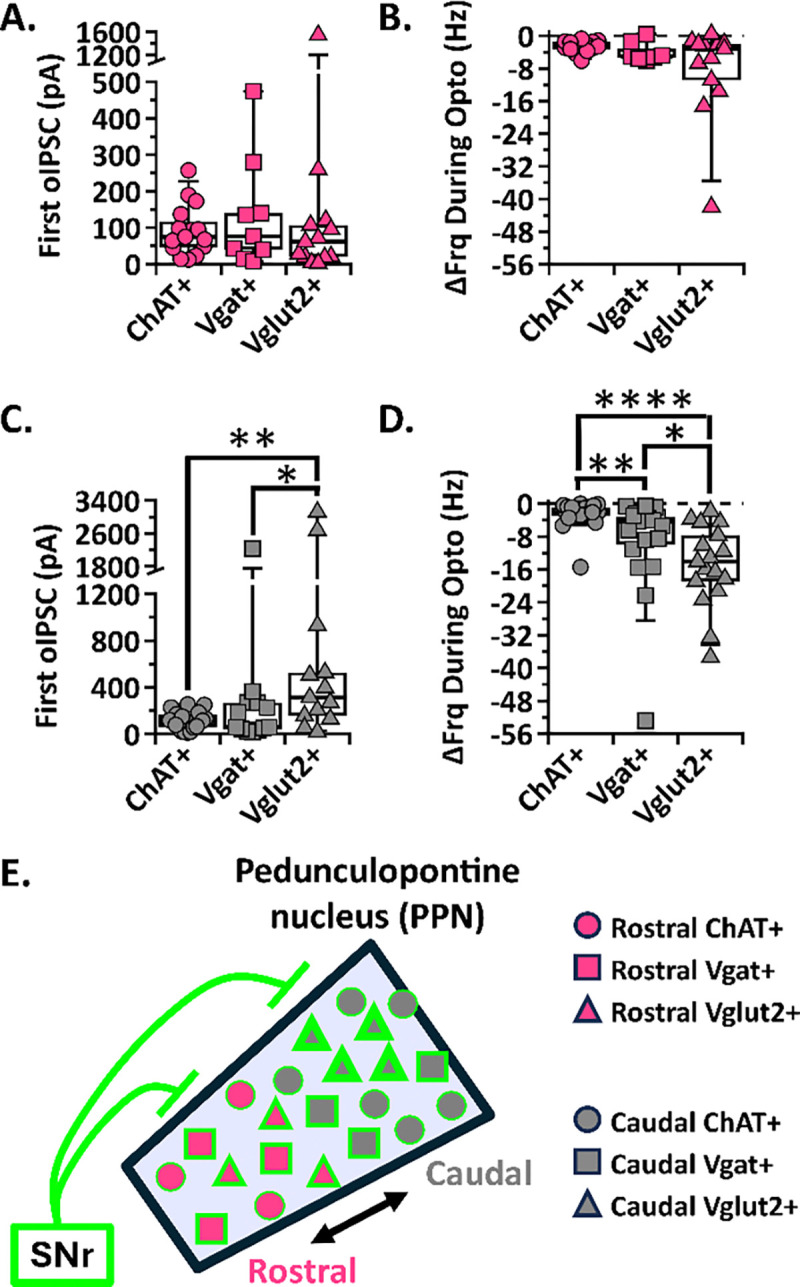
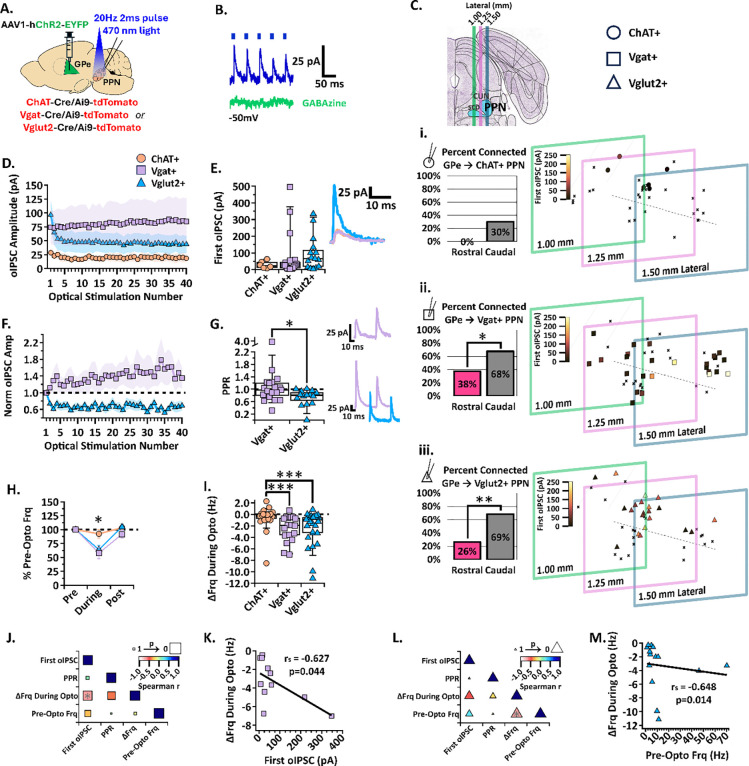
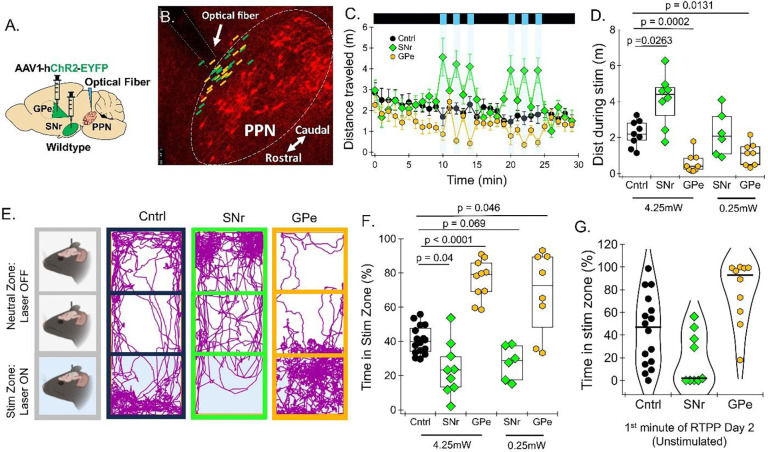
The canonical basal ganglia model predicts that the substantia nigra pars reticulata (SNr) and the globus pallidus externa (GPe) will have specific effects on locomotion: the SNr inhibiting locomotion and the GPe enhancing it. In this study, we use in vivo optogenetics to show that the GPe exerts non-canonical effects on locomotion while the SNr has no gross motor impact through inhibition of the PPN. We also show that these structures mediate opposing effects on reward. To understand how these structures differentially modulate the PPN, we use ex vivo whole-cell recording with optogenetics to comprehensively dissect the SNr and GPe synaptic connections to regionally- and molecularly-defined populations of PPN neurons. The SNr inhibits all PPN subtypes, but most strongly inhibits caudal glutamatergic neurons. The GPe selectively inhibits caudal glutamatergic and GABAergic neurons, avoiding both cholinergic and rostral cells. This circuit characterization reveals non-canonical basal ganglia pathways for locomotion and valence.

Keywords: basal ganglia; brainstem; electrophysiology; inhibition; locomotion; mesencephalic locomotor region; optogenetics; pedunculopontine nucleus; reward; substantia nigra.


Conflict of interest statement

Declaration of Interests The authors declare no competing interests.

Figures

Figure 1.
Figure 1.. SNr and GPe axons display distinct distribution patterns across the rostral and caudal PPN.
(A,C) Stereotaxic injection of AAV1 delivering hSyn-ChR2-eYFP to the SNr or GPe of ChAT-Cre/Ai9-tdTomato mice, respectively. (B, D) Confocal images of EYFP-filled SNr or GPe axons across the PPN, respectively. CNII: cranial nerve II, scp: superior cerebellar peduncle; PB: parabrachial nucleus
Figure 2.
Figure 2.. SNr inhibition of rostral and caudal ChAT+ PPN neurons.
(A) Experimental set up to identify red ChAT+ PPN neurons for whole-cell patch clamp while stimulating ChR2-filled SNr axons [N=6]. (B) White arrowheads pointing to neurobiotin-filled patched neurons within the PPN across three 200μm slices. (C) Example trace of the first five oIPSCs [blue] in the 2-second 20 Hz train inhibited by GABA-a receptor blocker, GABAzine [green], while holding the cell at −50mV. (D) Percent connected among patched neurons in the rostral and caudal regions. (E) Average oIPSC amplitude at each of 40 optogenetic light pulses in n=15 rostral neurons and n=20 caudal neurons. (F) Left, Individual cell data for the first oIPSC amplitude and, right, example current traces. (G) Cell mapping of patched neuron locations with the first oIPSC amplitude represented by the color scale. (H) Normalized current amplitudes in E. (I) Left, Individual cell data for the PPR between the first two oIPSC amplitudes in the train and, right, example current traces. (J) Example voltage traces of action potential firing during a 2-second 20 Hz train stimulation in rostral (left) and caudal (right) neurons. (K) Percent of pre-optical stimulation firing frequency during stimulation and rebound in n=14 rostral vs n=2–3 caudal neurons. (L) Individual cell data for the absolute change in frequency during optical stimulation [ΔFrq During Opto]. (M) Individual cell data for the absolute change in rebound frequency post-stimulation [ΔRebFrq]; rostral vs. caudal p=0.0142. (N) Correlation analysis, color scale representing Spearman r [−1,1] and size representing p-value [1,0]. (O) Negative correlation between the absolute change in frequency during stimulation and post-stimulation rebound; r=−0.372, p=0.039. * p<0.05; bar graph data represent mean ± SEM; box plots show median line with boxes showing IQR and whiskers showing 9th and 91st percentiles.
Figure 3.
Figure 3.. SNr inhibition of rostral and caudal Vgat+ PPN neurons.
(A) Experimental set up to identify red Vgat+ PPN neurons for whole-cell patch clamp while stimulating ChR2-filled SNr axons [N=6]. (B) Percent connected among patched neurons in the rostral and caudal regions. (C) Average oIPSC amplitude at each of 40 optogenetic light pulses in n=9 rostral neurons and n=13 caudal neurons. (D) Left, Individual cell data for the first oIPSC amplitude and, right, example current traces. (E) Cell mapping of patched neuron locations with the first oIPSC amplitude represented by the color scale. (F) Normalized current amplitudes in C. (G) Left, Individual cell data for the PPR between the first two oIPSC amplitudes in the train and, right, example current traces. (H) Percent of pre-optical stimulation firing frequency [% Pre-Opto Frq] during stimulation and and rebound in n=7 rostral and n=19 caudal neurons. (I) Individual cell data for the absolute change in frequency during optical stimulation [ΔFrq During Opto]. (J) Correlation analysis, color scale representing Spearman r [−1,1] and size representing p-value [1,0]. (K) Negative correlation between the absolute change in frequency during stimulation and first oIPSC amplitude; r=−0.755, p=0.001. (L) Negative correlation between the pre-optical stimulation firing frequency and the PPR; r =−0.706, p=0.002. Box plots show median line with boxes showing IQR and whiskers showing 9th and 91st percentiles.
Figure 4.
Figure 4.. SNr inhibition of rostral and caudal Vglut2+ PPN neurons.
(A) Experimental set up to identify red Vglut2+ PPN neurons for whole-cell patch clamp while stimulating ChR2-filled SNr axons [N=6]. (B) Percent connected among patched neurons in the rostral and caudal regions. (C) Average oIPSC amplitude at each of 40 optogenetic light pulses in n=13 rostral neurons and n=13 caudal neurons. (D) Left, Individual cell data for the first oIPSC amplitude and, right, example current traces; p=0.0035. (E) Cell mapping of patched locations with the first oIPSC amplitude represented by the color scale. (F) Normalized current amplitudes in C. (G) Left, Individual cell data for the PPR between the first two oIPSC amplitudes in the train and, right, example current traces. (H) Example voltage traces of action potential firing during a 2-second 20 Hz train stimulation in rostral and caudal neurons, top to bottom. (I) Percent of pre-optical stimulation firing frequency [% Pre-Opto Frq] during stimulation and rebound in n=13 rostral and n=17 caudal neurons. (J) Individual cell data for the absolute change in frequency during optical stimulation [ΔFrq During Opto]; p=0.0197. (K) Spontaneous frequency in n=11 rostral and n=16 caudal neurons; p=0.0343. (L) Correlation analysis, color scale representing Spearman r [−1,1] and size representing p-value [1,0]. (M) Positive correlation between the absolute change in frequency during stimulation and PPR, r=0.486, p=0.030. (N) Negative correlation between the absolute change in frequency during stimulation and first oIPSC amplitude; r=−0.841, p<0.00001. (O) Negative correlation between the absolute change in frequency during stimulation and pre-optical stimulation frequency; r=−0.791, p<0.0001. (P) Positive correlation between the first oIPSC amplitude and pre-optical stimulation frequency; r=0.818, p<0.0001. * p<0.05, ** p<0.01; box plots show median line with boxes showing IQR and whiskers showing 9th and 91st percentiles.
Figure 5.
Figure 5.. The SNr most strongly inhibits caudal glutamatergic PPN neurons.
(A,C) Individual cell data for the first oIPSC amplitude recorded in each cell type for rostral and caudal PPN neurons, respectively. (B,D) Individual cell data for the absolute change in frequency during stimulation in each cell type for rostral and caudal PPN neurons, respectively. (E) Graphical depiction of SNr stimulation results. * p<0.05, ** p<0.01, **** p<0.0001; box plots show median line with boxes showing IQR and whiskers showing 9th and 91st percentiles.
Figure 6.
Figure 6.. GPe inhibition of the three PPN cell types.
(A) Experimental set up to identify red ChAT+, Vgat+, and Vglut2+ PPN neurons for whole-cell patch clamp while stimulating ChR2-filled GPe axons [N=6]. (B) Example trace of the first five oIPSCs in the 2-second 20 Hz train [blue] inhibited by GABA-a receptor blocker, GABAzine [green], while holding the cell at −50mV. (C) Left, Percent connected among patched neurons in the rostral and caudal regions and, right, cell mapping of patched locations with the first oIPSC amplitude represented by the color scale. Top to bottom, i. ChAT+, ii. Vgat+, and iii. Vglut2+ datasets. (D) Average oIPSC amplitude at each of 40 optogenetic light pulses in n=6 ChAT+, n=19 Vgat+, and n=15 Vglut2+ caudal PPN neurons. (E) Left, Individual cell data for the first oIPSC amplitude and, right, example current traces. (F) Normalized current amplitudes in C. (G) Left, Individual cell data for the PPR between the first two oIPSC amplitudes in the train; p=0.0206. Right, top, example current trace of short-term synaptic facilitation in VgAT+ neurons. Right, bottom, example current traces of short-term synaptic depression in Vgat+ and Vglut2+ neurons. (H) Percent of pre-optical stimulation firing frequency [%Pre-Opto Frq] during and post-stimulation in n=25 ChAT+, n=18 Vgat+, and n=29 Vglut2+ caudal PPN neurons. (I) Individual cell data for the absolute change in frequency during stimulation [ΔFrq During Opto]. (J) Correlation analysis for Vgat+ neurons, color scale representing Spearman r [−1,1] and size representing p-value [1,0]. (K) Negative correlation between the absolute change in frequency during stimulation and first oIPSC amplitude; r=−0.627, p=0.044. (L) Correlation analysis for Vglut2+ neurons. (M) Negative correlation between the absolute change in frequency during stimulation and the pre-stimulation firing frequency; r=−0.648, p=0.014. *p<0.05, **p<0.01; box plots show median line with boxes showing IQR and whiskers showing 9th and 91st percentiles.
Figure 7.
Figure 7.. In vivo activation of GPe and SNr axons in the PPN show differential effects on ocomotion and opposite effects on valence.
(A) Experimental set up to stimulate ChR2-filled SNr or GPe axons over the PPN in vivo. (B) Representative image of optical fiber tract overlaid with the approximate optical fiber placement for SNr- [green] and GPe- [orange] injected mice. (C) Distance raveled over time in an open field with 1 minute 20 Hz 4.25 mW optical stimulations over the PPN in N=9 control (Ctrl) mice (black circles), N=8 mice injected with ChR2 in the SNr (green diamonds), and N=9 mice injected with ChR2 in the GPe (orange hexagons); vertical blue lines represent periods of optical stimulation. (D) Average distance traveled for each mouse across the six 1-minute optical stimulations in he high (4.25 mW) and low laser power (0.25 mW) conditions (E) Representative mouse track tracings during real time place preference task in a three-chamber box and continuously stimulating EGFP- or ChR2-filled axons over the PPN at 20 Hz in SNr- and GPe-injected mice when the mice are in the stimulation zone. (F) Percent time spent in the stimulation zone in N=16 control mice, N=9 mice injected with ChR2 in the SNr, and N=10 mice injected with ChR2 in the GPe with 4.25 or 0.25 mW laser power. G) Percent time spent in the stimulation zone during the first minute reintroduced to the RTPP box on day 2 of RTPP with the laser off (no chamber is stimulated) Black line = median. * p<0.05, ** p<0.01, *** p<0.001, **** p<0.0001; box plots show median line with boxes showing IQR and whiskers showing 9th and 91st percentiles. See related supplemental Figures S2–S4 and Videos S1-S4.

Similar articles

References

    1. Ryczko D. (2022). The Mesencephalic Locomotor Region: Multiple Cell Types, Multiple Behavioral Roles, and Multiple Implications for Disease. Neuroscientist, 10738584221139136. 10.1177/10738584221139136. - DOI - PMC - PubMed
    1. Bastos-Gonçalves R., Coimbra B., and Rodrigues A.J. (2024). The mesopontine tegmentum in reward and aversion: from cellular heterogeneity to behaviour. Neuroscience & Biobehavioral Reviews, 105702. 10.1016/j.neubiorev.2024.105702. - DOI - PubMed
    1. Mena-Segovia J., and Bolam J.P. (2017). Rethinking the Pedunculopontine Nucleus: From Cellular Organization to Function. Neuron 94, 7–18. 10.1016/j.neuron.2017.02.027. - DOI - PubMed
    1. French I.T., and Muthusamy K.A. (2018). A Review of the Pedunculopontine Nucleus in Parkinson’s Disease. Frontiers in Aging Neuroscience 10, 99. 10.3389/fnagi.2018.00099. - DOI - PMC - PubMed
    1. Wang H.-L., and Morales M. (2009). Pedunculopontine and laterodorsal tegmental nuclei contain distinct populations of cholinergic, glutamatergic and GABAergic neurons in the rat. Eur J Neurosci 29, 10.1111/j.1460-9568.2008.06576.x. 10.1111/j.1460-9568.2008.06576.x. - DOI - DOI - PMC - PubMed

Publication types

LinkOut - more resources