[Preprint]. 2024 Aug 8:2024.08.07.606891.
doi: 10.1101/2024.08.07.606891.

Persistent changes in nociceptor translatomes govern hyperalgesic priming in mouse models

Affiliations

Persistent changes in nociceptor translatomes govern hyperalgesic priming in mouse models

Ishwarya Sankaranarayanan et al. bioRxiv. .

Update in

Abstract

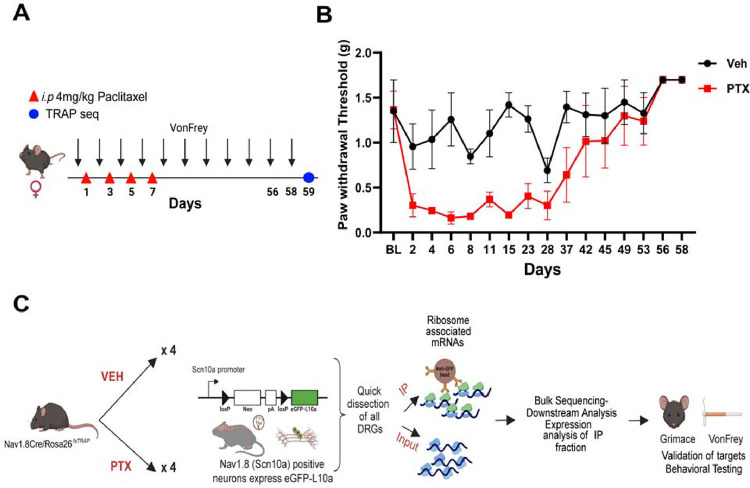
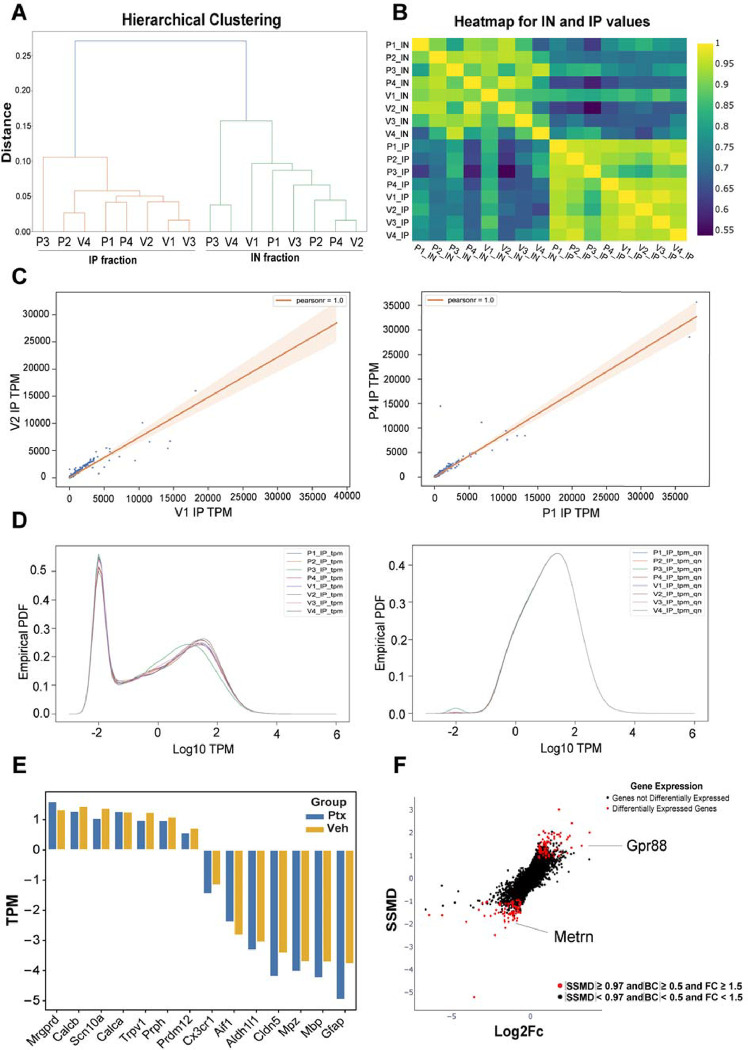
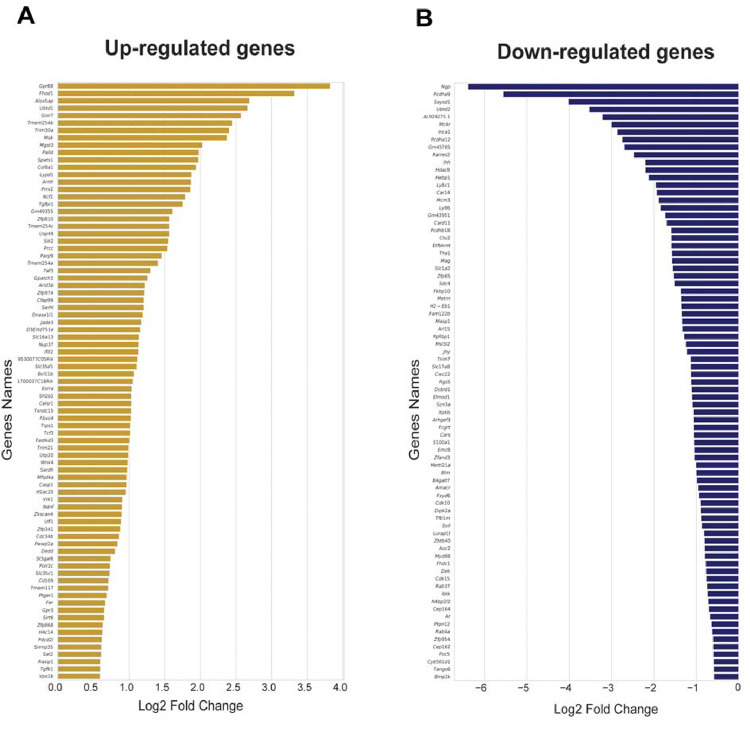
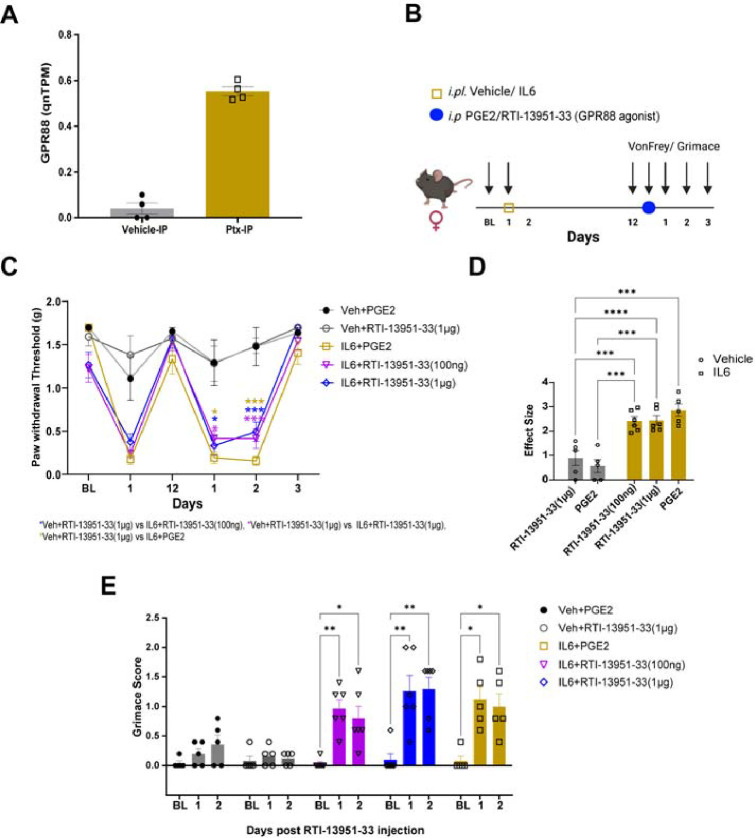
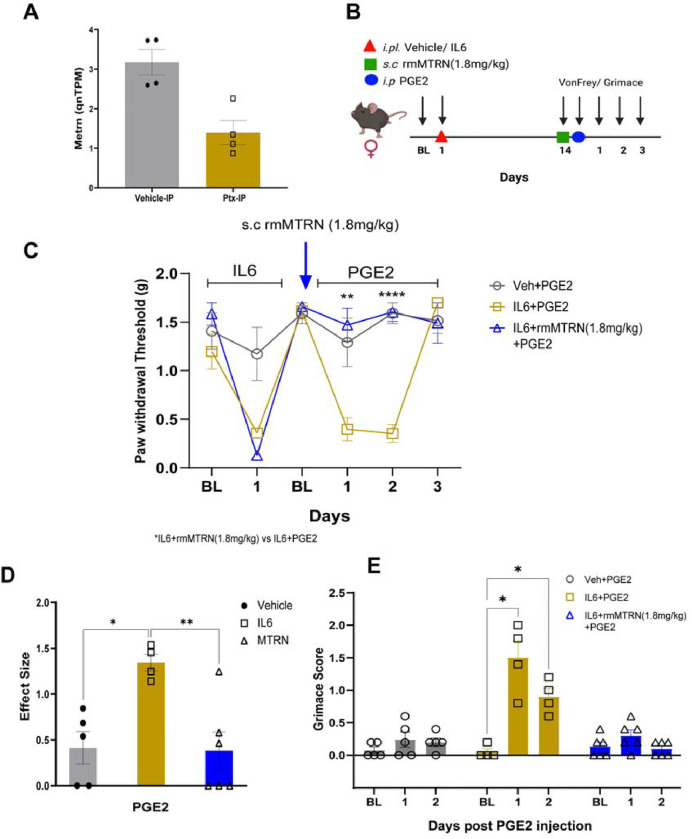
Hyperalgesic priming is a model system that has been widely used to understand plasticity in painful stimulus-detecting sensory neurons, called nociceptors. A key feature of this model system is that following priming, stimuli that do not normally cause hyperalgesia now readily provoke this state. We hypothesized that hyperalgesic priming occurs due to reorganization of translation of mRNA in nociceptors. To test this hypothesis, we used paclitaxel treatment as the priming stimulus and translating ribosome affinity purification (TRAP) to measure persistent changes in mRNA translation in Nav1.8+ nociceptors. TRAP sequencing revealed 161 genes with persistently altered mRNA translation in the primed state. We identified Gpr88 as upregulated and Metrn as downregulated. We confirmed a functional role for these genes, wherein a GPR88 agonist causes pain only in primed mice and established hyperalgesic priming is reversed by Meteorin. Our work demonstrates that altered nociceptor translatomes are causative in producing hyperalgesic priming.

Keywords: GPR88; IL6-mediated hyperalgesic priming; Meteorin; chemotherapy-induced peripheral neuropathy; hyperalgesic priming; translating ribosome affinity purification.


Conflict of interest statement

Conflict of Interest Statement: G Munro and KA Petersen are employees of Hoba Therapeutics. The authors declare no other conflicts of interest.

Figures

Figure 1:
Figure 1:
Cell type-specific gene expression during the resolution phase of paclitaxel-induced mechanical hypersensitivity. A) Schematic representation of the dosing paradigm for paclitaxel treatment and behavioral testing using von Frey filaments. B) Paw withdrawal thresholds were reduced with the administration of paclitaxel in a cohort of female Nav1.8cre/Rosa26fsTRAP mice. C) Outline of the workflow for TRAP sequencing. Nav1.8cre/Rosa26fsTRAP mice were administered vehicle or paclitaxel, and we euthanized on day 59 day upon returning to baseline mechanical thresholds. Whole DRGs were dissected and homogenized, and total RNA (INPUT) was extracted from the lysate. mRNAs bound to ribosomes (IP) were further isolated using eGFP-coated beads. Samples were sequenced and potential genes were validated using behavioral testing.
Figure 2:
Figure 2:
Nociceptor-specific translating ribosome affinity purification (TRAP) sequencing after resolution of paclitaxel-induced mechanical hypersensitivity: A) Hierarchical clustering using the correlation coefficients showing separation between the IN and the IP samples. B) Heatmap plot revealing a clear distinction between the biological replicates between the TRAP-seq and the INPUT samples. C) Linear correlation plots show a higher correlation between the IP samples. D) Empirically probability distribution of all coding genes using the raw TPMs and quantile normalized TPMs of all IP samples. E) Higher expression is observed of neuronal genes (Mrgprd, Calcb, Scn10a, Calca, Trpv1, Prph) compared to non-neuronal genes (Prpdm12, Cx3cr1, Aif1, Mpz, Mbp, Gfap) showing neuron-specific enrichment using TRAP. F) Differentially translated mRNAs in the IP sample are shown by a dual-lightened plot against SSMD and log2-fold change.
Figure 3:
Figure 3:
Differentially translated nociceptor-specific mRNAs after paclitaxel treatment. A) Bar plot showing a log2-fold change of all upregulated differentially translated mRNAs in the IP sample. B) Bar plot showing log 2-fold change of all downregulated genes in the IP samples.
Figure 4:
Figure 4:
GPR88 causes mechanical hypersensitivity in primed animals after IL-6 treatment. A) Expression of Grp88 mRNA is higher in paclitaxel-treated animals after the resolution of paclitaxel-induced pain behaviors. B) Schematic representation of dosing paradigm for intraplantar injection of IL-6, PGE2, or RTI-13951–33 (GPR88 agonist) and von Frey assessment. C) 100 ng and 1 μg RTI-13951–33 induce mechanical hypersensitivity only in primed mice that were previously treated with IL-6 (Two-way ANOVA, F= 5.173, p <0.0001, Tukey’s multiple comparison test, (Vehicle+PGE2, N=5, IL-6+1 μg RTI-13951–33, N=6, IL-6+100 ng RTI-13951–33, N=6, Vehicle+1 μg RTI-13951–33, N=5), Day 1 post PGE2 or RTI-13951–33, IL-6+PGE2 vs. Veh+1 μg RTI-13951–33, p-value = 0.0205, IL-6+1 μg RTI-13951–33 vs. Veh+1 μg RTI-13951–33, p-value = 0.0311, IL-6+100 ng RTI-13951–33 vs. Veh+1 μg RTI-13951–33, p-value = 0.0471, Day 2 post PGE2 or RTI-13951–33 administration IL-6+PGE2 vs. Veh+1 μg RTI-13951–33, p-value = < 0.0001, IL-6+1 μg RTI-13951–33 vs. Veh+1 μg RTI-13951–33, p-value = 0.0005, IL-6+100 ng RTI-13951–33 vs. Veh+1 μg RTI-13951–33, p-value = 0.0003, Veh+PGE2 vs. IL-6+PGE2, p-value = 0.0153, Veh+PGE2 vs. IL-6+1 μg RTI-13951–33, p-value = 0.0403, Veh+PGE2 vs. IL-6+100 ng RTI-13951–33, p-value = 0.0287. Data represents mean ± SEM. Significance represented as IL-6+1 μg RTI-13951–33 vs. Veh+1 μg RTI-13951–33 (pink*), IL-6+100 ng RTI-13951–33 vs. Veh+1 μg RTI-13951–33 (blue*), Veh+RTI-13951–33 vs. IL-6+PGE2 (yellow*). D) Effect size was determined by calculating the sum of the cumulative difference between the value for each time point post-GPR88 agonist administration and the day 12 baseline value. We observed a significant difference for both 100 ng and 1 μg RTI-13951–33 treatment between the Vehicle group and IL-6 primed animals. (Two-way ANOVA, p-value = <0.0001, Tukey’s multiple comparison test, 100 ng RTI-13951–33:IL-6 vs. 1 μg RTI-13951–33: Vehicle, p-value = 0.0002, 100 ng RTI-13951–33:IL-6 vs. PGE2:Vehicle, p-value = 0.0003, 1 μg RTI-13951–33:Vehicle vs. 1 μg RTI-13951–33:IL-6, p-value = <0.0001, 1 μg RTI-13951–33:Vehicle vs. PGE2:IL-6, p-value = 0.0002, 1 μg RTI-13951–33:IL-6 vs. PGE2:Vehicle, p-value = 0.0002, PGE2:Vehicle vs. PGE2:IL-6, p-value = <0.0001. E) Grimacing behavior was observed to be significantly different in animals treated with RTI-13951–33 compared to its baseline measurement. (Two-way ANOVA, F=4.834, p-value = 0.0003, Dunnett’s multiple comparison test, Day1 IL-6+PGE2 vs Baseline, p-value = 0.0261, IL-6+1 μg RTI-13951–33 vs Baseline, p-value = 0.0051, IL-6+100 ng RTI-13951–33 vs Baseline, p-value = 0.0022, Day2, IL-6+PGE2 vs Baseline, p-value = 0.0358, IL-6+1 μg RTI-13951–33 vs Baseline, p-value = 0.0024, IL-6+ 100 ng RTI-13951–33 vs Baseline, p-value = 0.0282). Data represents mean +/− SEM.
Figure 5:
Figure 5:
Meteorin reverses hyperalgesic priming in animals primed with IL-6. A) Quantile normalized expression of Metrn is observed to be decreased in paclitaxel-treated Nav1.8cre/Rosa26fsTRAP mice after the resolution of paclitaxel-induced pain behaviors. B) Diagram showing the dosing paradigm of IL-6, rmMTRN, and PGE2 and behavioral testing schedule. C) 1.8mg/kg rmMTRN administration an hour prior to PGE2 injection attenuated the development of mechanical hypersensitivity in IL-6-primed animals. (Two-way ANOVA, F = 24.77, p-value = <0.0001, Tukey’s multiple comparison test, Day1 post PGE2 injection, IL-6+PGE2 vs. IL-6+rmMTRN (1.8 mg/kg)+PGE2, p-value = <0.0023, Day2 post PGE2 injection, IL-6+PGE2 vs. IL-6+rmMTRN (1.8 mg/kg)+PGE2, p-value = < 0.0001, IL-6+PGE2, N=4, Veh+PGE2, N=5, IL-6+rmMTRN (1.8 mg/kg)+PGE2, N=6). D) Effect size was calculated from the first administration of rmMTRN and was observed to be significant between primed animals treated with PGE2 and primed animals administered with rmMTRN and PGE2. (One-way ANOVA, IL-6+PGE2 : IL-6+rmMTRN (1.8 mg/kg)+ PGE2, p-value = <0.0079, IL-6+PGE2 : Vehicle+PGE2, p-value = <0.0124) E) Grimacing behavior was observed to be similar to its baseline measurements in mice administered with rmMTRN (Two-way ANOVA, F = 10.35, p-value = <0.0001, Day1 post PGE2 injection, IL-6+PGE2 vs. Baseline measurement, p-value = 0.0302, Day2, IL-6+PGE2 vs. Baseline measurement, p-value = 0.0256, Day1 post PGE2 injection, IL-6+rmMTRN (1.8 mg/kg)+PGE2 vs. Baseline measurement of IL-6+ rmMTRN (1.8 mg/kg), p-value = 0.4465, Day2, IL-6+rmMTRN (1.8 mg/kg)+PGE2 vs. Baseline measurement of IL-6+rmMTRN (1.8 mg/kg), p-value = 0.9167).

Similar articles

References

    1. Dubin A. E., Patapoutian A., Nociceptors: the sensors of the pain pathway. J Clin Invest 120, 3760–3772 (2010); published online EpubNov (10.1172/JCI42843). - DOI - PMC - PubMed
    1. Woolf C. J., Ma Q., Nociceptors--noxious stimulus detectors. Neuron 55, 353–364 (2007); published online EpubAug 2 (10.1016/j.neuron.2007.07.016). - DOI - PubMed
    1. Koltzenburg M., The changing sensitivity in the life of the nociceptor. Pain Suppl 6, S93–102 (1999); published online EpubAug ( - PubMed
    1. Walters E. T., Crook R. J., Neely G. G., Price T. J., Smith E. S. J., Persistent nociceptor hyperactivity as a painful evolutionary adaptation. Trends Neurosci 46, 211–227 (2023); published online EpubMar (10.1016/j.tins.2022.12.007). - DOI - PMC - PubMed
    1. North R. Y., Li Y., Ray P., Rhines L. D., Tatsui C. E., Rao G., Johansson C. A., Zhang H., Kim Y. H., Zhang B., Dussor G., Kim T. H., Price T. J., Dougherty P. M., Electrophysiological and transcriptomic correlates of neuropathic pain in human dorsal root ganglion neurons. Brain 142, 1215–1226 (2019); published online EpubMay 1 (10.1093/brain/awz063). - DOI - PMC - PubMed

Publication types