[Preprint]. 2024 Sep 27:2024.08.07.607092.
doi: 10.1101/2024.08.07.607092.

The synaptonemal complex aligns meiotic chromosomes by wetting

Affiliations

The synaptonemal complex aligns meiotic chromosomes by wetting

Spencer G Gordon et al. bioRxiv. .

Update in

Abstract

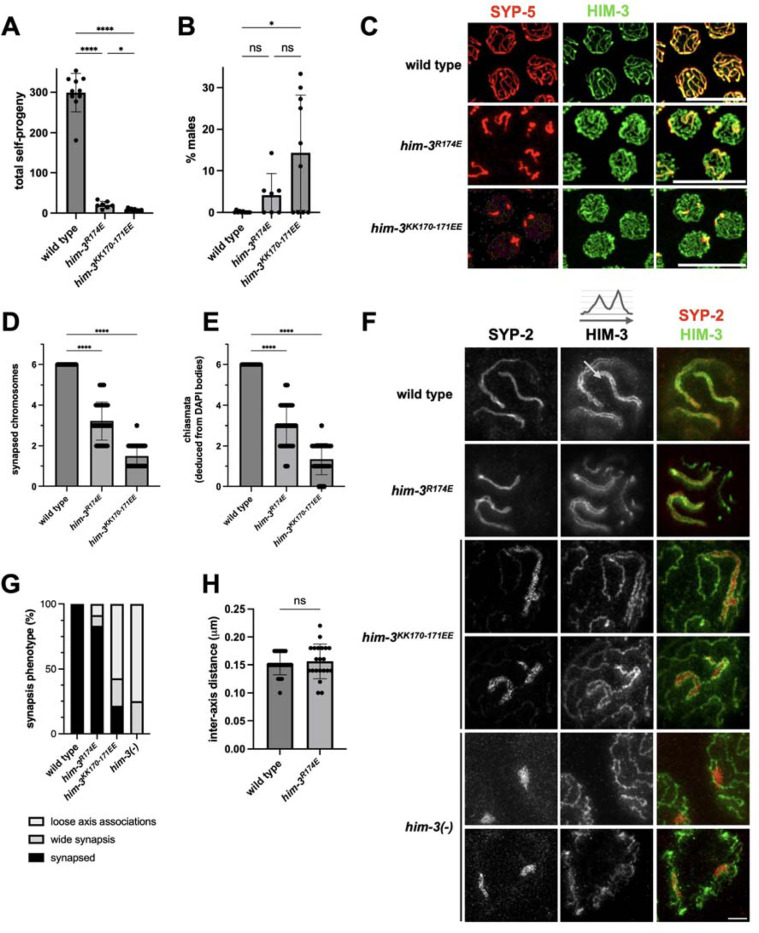
During meiosis, the parental chromosomes are drawn together to enable exchange of genetic information. Chromosomes are aligned through the assembly of a conserved interface, the synaptonemal complex, composed of a central region that forms between two parallel chromosomal backbones called axes. Here we identify the axis-central region interface in C. elegans, containing a conserved positive patch on the axis component HIM-3 and the C-terminus of the central region protein SYP-5. Crucially, the canonical ultrastructure of the synaptonemal complex is altered upon weakening this interface. We developed a thermodynamic model that recapitulates our experimental observations, indicating that the liquid-like central region can assemble by wetting the axes without active energy consumption. More broadly, our data show that condensation drives tightly regulated nuclear reorganization during sexual reproduction.

Keywords: C. elegans; HORMA; condensation; meiosis; synaptonemal complex; wetting.


Conflict of interest statement

Declaration of interests The authors declare no competing interests.

Figures

Figure 1:
Figure 1:. The HORMA domain of HIM-3 is required for axis interactions with the SC-CR
(A) Top left, assembled synaptonemal complex with the darkly-stained parental chromosomes to its side (left) and of the polycomplexes that form in cohesin(−) worms (right) as seen in negative negative-stain electron-micrographs (adapted from (Rog et al. 2017)). Bottom left, interpretive diagrams colored magenta for the SC-CR, green for the axes (also called lateral or axial elements) and blue for chromatin. (B) Models depicting the worm components of the axis (top) and the SC-CR (bottom). The position of each of these components within the synaptonemal complex is based on (Köhler et al. 2017, 2020; Hurlock et al. 2020; Zhang et al. 2020; Blundon et al. 2024). The pairs HTP-1/2, SYP-5/6 and SKR-1/2 are each partially redundant with each other. (C) Pachytene nuclei from worms of the indicated genotypes stained for the SC-CR component SYP-5 (red) and the axis components HIM-3 (green) and HTP-3 (magenta). The merged images on the right also show DNA (DAPI, blue). The HTP-3 antibody weakly cross-reacts with the nucleolus. Scale bar = 1 μm. Gene models of HIM-3, with the HORMA domain and the closure motif highlighted, are shown to the right. Regions deleted are denoted by red brackets. See Figure S1A for images of the gonads. (D) Quantification of the images in panel A. The enrichment at polycomplexes relative to the nucleoplasm was done using line scans. Normalized HTP-3 enrichment was calculated by dividing HTP-3 enrichment by SYP-5 enrichment.
Figure 2:
Figure 2:. Axis interactions with the SC-CR are mediated by a positive patch on the HORMA domain of HIM-3
(A) Structural models of the meiotic HORMA proteins, with surface charge plotted in a red-blue scale. The structures of HTP-1 and HIM-3 are from (Kim et al. 2014). The models of HTP-3 and the three HIM-3 mutants were generated in AlphaFold (Senior et al. 2020). Bottom, secondary structural models, with amino acids constituting the positive patch on HIM-3 (positions 170,171,174,177 and 178), and the analogous positions in HTP-1 and HTP-3 are shown as surfaces colored according to charge. (B) Pachytene nuclei from worms of the indicated genotypes stained for the SC-CR component SYP-5 (red) and the axis components HIM-3 (green) and HTP-3 (magenta). The merged images on the right also show DNA (DAPI, blue). The HTP-3 antibody weakly cross-reacts with the nucleolus. Scale bars = 1 μm. See Figure S2D for images of the gonads and Figure S3 for similar analysis in live gonads. (C-E) Quantification of the images in panel B. The enrichment at polycomplexes relative to the nucleoplasm was done using line scans. Normalized enrichment (panel E) was calculated by dividing HIM-3 enrichment by SYP-5 enrichment.
Figure 3:
Figure 3:. Lowering SC-CR affinity for the axes perturbs synapsis
(A) Total self-progeny from hermaphrodites of the indicated genotypes. (B) Percentage of males among self-progeny of hermaphrodites of the indicated genotypes, indicative of meiotic X chromosome non-disjunction. (C) Pachytene nuclei stained for the SC-CR component SYP-5 (red) and the axis component HIM-3 (green), with merged images shown on the right. Note the extensive asynapsis in the him-3 mutants (i.e., axes lacking SC-CR staining) despite loading of the mutated HIM-3 proteins onto the axis. Scale bars = 10 μm. See Figure S4A for images of the gonads. (D) Quantification of the images in panel C, indicating a smaller number of synapsed chromosomes in him-3 mutants. (E) Chiasmata number deduced from the number of DAPI bodies at diakinesis. Wild-type animals undergo one chiasma per chromosome, for a total of six chiasmata per nucleus. (F) STED microscopy images of pachytene nuclei stained for the SC-CR component SYP-2 (red in the merged image) and the axis component HIM-3 (green in the merged image). An example of a line scan through a synapsed chromosome is shown above the HIM-3 staining in wild-type animals. Scale bar = 1 μm. (G) Quantification of different synapsis phenotypes in STED images, as shown in panel (F). ‘Wide synapsis’ indicates parallel axes separated by more than isonm, as shown in the top nucleus from him-3KK170-171EE animals. ‘Loose axis associations’ indicate axes wrapped around SC-CR structures, as shown in the bottom nucleus from him-3KK170-171EE animals. (H) Inter-axes distance in the indicated genotypes, measured from nuclei stained as in panel F. Distance was measured only between parallel axes that had unilamellar SYP-2 staining.
Figure 4:
Figure 4:. The C-terminus of SYP-5 contributes to SC-CR interactions with the axis
(A) The C-terminus of SYP-5 (amino acids 515–547), with positively- and negatively-charged residues colored in blue and red, respectively. Below, syp-5 mutations flipping charges in the C-terminus. (B) Pachytene nuclei of the indicated genotypes stained for the SC-CR component SYP-2 (red) and the axis component HIM-3 (green). The merged images on the right also show DNA (DAPI, blue). Note that the syp-56K mutant fails to form polycomplexes, likely due to perturbed self-interactions of the SC-CR. Scale bars = 10 μm. See Figure S6A for images of the gonads. (C-E) Quantification of the enrichment of SYP-2 and HIM-3 to polycomplexes. While the SC-CR is less enriched at polycomplexes in syp-55k animals, these polycomplexes recruit more HIM-3. In panel E, HIM-3 enrichment is normalized to the level of SYP-2 enrichment. (F) STED microscopy images of pachytene nuclei stained forthe SC-CR component SYP-2 (red in the merged image) and the axis component HIM-3 (green in the merged image). Scale bar = 1 μm. (G) The number of SC-CR structures per pachytene nuclei in the indicated genotypes. (H) Inter-axes distance in the indicated genotypes, measured from nuclei stained as in panel F. Distance was measured only for him-3KK170−171EE syp-56K mutants, where the parallel axes exhibited unilamellar SC-CR staining, and is compared to the data from Figure 3H. (I) Quantification of different synapsis phenotypes in STED images, as shown in panel F. See Figure 3G for more details. (J) Anti-HIM-3 western blot showing the interaction of purified HTP-3-HIM-3 complexes containing wild type (WT) or indicated mutants of HIM-3 with biotinylated peptides spanning residues 528–547 of SYP-5, either unmodified or phosphorylated at S541 (SYP-5 Phos). See Figure S8 for complete blots and additional controls.
Figure 5:
Figure 5:. Parameters forthe thermodynamic model of synaptonemal complex assembly
(A) Parameters used to model synaptonemal complex assembly. Sources: (Goldstein and Slaton 1982; Köhler et al. 2017, 2020; Woglar et al. 2020). (B) Distance between the ‘ladder rungs’ in negative stain electron microscopy images from (Rog et al. 2017). Each point represents an individual measurement between adjacent ‘rungs’. (C) Total nuclear fluorescence of GFP-HIM-3 and GFP-SYP-3 in pachytene nuclei, yielding a ratio of 1:1.2 GFP-SYP-3 to GFP-HIM-3. (D) The fraction of GFP-SYP-3 on chromosomes in animals of the indicated genotypes is significantly lower in him-3R174E and him-3KK170-171EE mutants. (E) Polycomplex volume calculated based on the dimensions of polycomplexes in negative stain electron microscopy images from (Rog et al. 2017). Given the mostly spherical appearance of polycomplexes, the z-dimension is assumed to be the average of the widths and height. Each point indicates a single polycomplex.
Figure 6:
Figure 6:. Results of the thermodynamic model of synaptonemal complex assembly
(A) Predicted number of synapsed chromosomes as a function of α=eSHeSS. The condensate volume is held constant Vc=0.1μm3. Dashed arrows indicate how the number of synapsed chromosomes in wild-type and him-3R174E allows to deduce the values of α. (For simplicity, we ignore here the slight reduction [8%] in Vc in him-3R174E worms.) (B) Contour plot of the predicted number of synapsed chromosomes (black lines) as a function of Vc and α. The orange and yellow lines indicate threshold SC-CR thickness of 90 and loonm, respectively. The green, blue and red asterisks denote the position of wild-type, him-3KK170-171EE and him-3R174E worms, respectively. The black arrow and asterisk indicate the effect of combining the syp-5 mutations with him-3KK170-171EE. Top right, example images of the mutations shown on the contour plot, with the axis stained in green and the SC-CR in red. See Supplementary Note 1 for more details.

References

    1. Almanzar D. E., Gordon S. G., Bristow C., Hamrick A., von Diezmann L., et al. , 2023. Meiotic DNA exchanges in C. elegans are promoted by proximity to the synaptonemal complex. Life Sci Alliance 6. 10.26508/lsa.202301906 - DOI - PMC - PubMed
    1. Blundon J. M., Cesar B. I., Bae J. W., Čavka I., Haversat J., et al. , 2024. Skpi proteins are structural components of the synaptonemal complex in C. elegans. Sci Adv 10: eadl4876. - PMC - PubMed
    1. Brangwynne C. P., Eckmann C. R., Courson D. S., Rybarska A., Hoege C., et al. , 2009. Germline P granules are liquid droplets that localize by controlled dissolution/condensation. Science 324:1729–1732. - PubMed
    1. Brenner S., 1974. The genetics of Caenorhabditis elegans. Genetics 77:71–94. - PMC - PubMed
    1. Chung Y.-C., and Tu L.-C., 2023. Interplay of dynamic genome organization and biomolecular condensates. Curr. Opin. Cell Biol. 85:102252. - PubMed

Publication types

LinkOut - more resources