[Preprint]. 2024 Aug 7:2024.08.05.606375.
doi: 10.1101/2024.08.05.606375.

Arsenic impairs Drosophila neural stem cell mitotic progression and sleep behavior in a tauopathy model

Affiliations

Arsenic impairs Drosophila neural stem cell mitotic progression and sleep behavior in a tauopathy model

Temitope H Adebambo et al. bioRxiv. .

Update in

Abstract

Despite established exposure limits, arsenic remains the most significant environmental risk factor detrimental to human health and is associated with carcinogenesis and neurotoxicity. Arsenic compromises neurodevelopment, and it is associated with peripheral neuropathy in adults. Exposure to heavy metals, such as arsenic, may also increase the risk of neurodegenerative disorders. Nevertheless, the molecular mechanisms underlying arsenic-induced neurotoxicity remain poorly understood. Elucidating how arsenic contributes to neurotoxicity may mitigate some of the risks associated with chronic sublethal exposure and inform future interventions. In this study, we examine the effects of arsenic exposure on Drosophila larval neurodevelopment and adult neurologic function. Consistent with prior work, we identify significant developmental delays and heightened mortality in response to arsenic. Within the developing larval brain, we identify a dose-dependent increase in brain volume. This aberrant brain growth is coupled with impaired mitotic progression of the neural stem cells (NSCs), progenitors of the neurons and glia of the central nervous system. Live imaging of cycling NSCs reveals significant delays in cell cycle progression upon arsenic treatment, leading to genomic instability. In adults, chronic arsenic exposure reduces neurologic function, such as locomotion. Finally, we show arsenic selectively impairs circadian rhythms in a humanized tauopathy model. These findings inform mechanisms of arsenic neurotoxicity and reveal sex-specific and genetic vulnerabilities to sublethal exposure.

Keywords: arsenic; genome instability; neural stem cells; neurodevelopment; neurotoxicity.


Conflict of interest statement

Competing interests The authors have no competing interests to declare.

Figures

Figure 1:
Figure 1:. As-exposure impairs viability.
(A) Dose response of chronic As exposure on pupariation shows concentrations ≥ 5 μM elicit a delay in the developmental transition from larval to pupal stages, as compared to controls. (B) Similar delays in adult eclosion were noted. Kaplan-Meier survival curves of WT (C) male or (D) virgin females following chronic As exposure. LD50 calculations indicate females (21.6 μM) exhibit a higher tolerance than males (15.2 μM). Mean mortality computed from 2 trials of As exposure for (E) male and (F) virgin females; N=10 per condition for each trial. Statistical significance by one-way ANOVA. ****p ≤ 0.0001, ***p ≤ 0.001, **p ≤ 0.01; ns, not significant.
Figure 2:
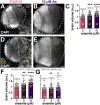
Figure 2:. Chronic As-exposure causes larval brain hypergrowth.
Representative maximum intensity projections of (A) control and (B) As-exposed third larval instar brains stained with DAPI (grey). (C) Volumetric analysis of larval brains, where each dot represents a single measurement from one optic lobe from N=38 untreated, 31 0.5 μM As, and 33 10 μM As-treated samples. Volume scales as a dose-dependent effect. (D and E) The optic lobe was divided into two regions, the outer optic lobe (OL; blue line) is the lateral region comprising the neuroepithelium, medulla, outer proliferation center, etc. versus the medial central brain (CB; orange line). (F) OL and (G) CB volumes trend upwards following As-exposure. The experiment was repeated in triplicate. Mean ± SD indicated. Significance determined by one-way ANOVA; ****p ≤ 0.0001, ***p ≤ 0.001, **p ≤ 0.01, *p ≤ 0.05, and ns, not significant. Scale bars = 30 μm.
Figure 3:
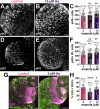
Figure 3:. Chronic As-exposure alters cell cycle dynamics.
Maximum intensity projections of (A) control and (B) As-exposed third larval instar brains marked with pH3 to label mitotic cells. (C) Quantification of pH3+ cells; each dot represents a single measurement from one brain from N=38 untreated, 31 0.5 μM As, and 33 10 μM As-treated samples from two replicates. Mitotic activity was assessed within the OL of (D) control versus (E) As-exposed brains. (F) Quantification of pH3+ cells in the OL. (G) Control or 5 μM As-exposed brains stained with Mira (green) to label NSC and EdU (magenta) to monitor DNA synthesis. Boxed regions indicate insets. (H) Quantitation of EdU+ central brain NSCs reveals reduced DNA synthesis in treated versus control groups. N=19 untreated, 24 0.5 μM As, and 23 10 μM As-treated samples from two replicates. Mean ± SD indicated. Significance by one-way ANOVA; ****p ≤ 0.0001, **p ≤ 0.01, *p ≤ 0.05, and ns, not significant. Scale bars=30 μm; insets, 10 μm.
Figure 4:
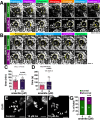
Figure 4:. Errant cell cycle progression in As-exposed NSCs.
(A and B) Stills from live imaging of control or As-exposed larval brains expressing H2AV-RFP. Cycling NSCs are highlighted (dashed circle) and anaphase-onset is marked by the double-headed arrows. Time 0:00 is relative to the first metaphase-onset. (A) Two successive NSC divisions are shown with time displayed as min:s. Video 1 shows a control cycling NSC. Video 2 shows a cycling As-exposed NSC. (B) A single NSC division is shown with time displayed in s. Video 3 shows a control NSC. Video 4 shows an As-exposed NSC. (C) Quantification of total cell cycle duration (min) from N=17 control and 11 As-treated (10 μM) samples. (D) Time spent in metaphase (s) from N=17 control and 13 As-treated (10 μM) samples. Chromosome spreads show the karyotype of (E) control versus (F and F’) 10 μM As-treated NSCs. The four chromosomes are labeled; arrow marks whole chromosome loss, while arrowheads denote chromosomal gains. (G) Quantification of aneuploidy from N=34 control and 35 As-exposed NSCs. For each experiment, N=5 brains were imaged across 5 replicates. Mean ± SD indicated. Significance determined by (C and D) unpaired t-test and (G) Fisher’s exact test; ****p ≤ 0.0001 and ***p ≤ 0.001. Scale bars= (A and B) 10 μm; (E–F’) 5 μm.
Figure 5:
Figure 5:. As-exposure impairs locomotor activity.
Quantification of the negative geotaxis assay (NGA) to measure climbing behavior. The y-axis displays the percentage of animals that cross a 10 cm mark within 10 s, and each dot represents the average response of 10 individuals. WT or elav>TauR406W males or virgin females were exposed to the indicated LD50 As concentrations. (A) Climbing activity in WT males was significantly reduced upon As-exposure. Although TauR406W males showed reduced climbing relative to WT, this only reached significance with 1/10th LD50 As. (B) Climbing activity in WT virgin females showed a dose-dependent decline with As-exposure. Conversely, TauR406W females exhibited similar impairments to climbing activity in the presence or absence of As-exposure. Mean ± SD indicated. Significance determined by ANOVA; *** for p ≤ 0.001, ** for p ≤ 0.01, * for p ≤ 0.05, and ns, not significant.
Figure 6:
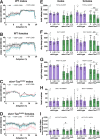
Figure 6:. Diminished sleep behaviors in As-exposed Tau mutants.
Traces of sleep/wake activity from 0–7-day old (A) WT males, (B) WT virgin females, (C) TauR406W males, or (D) TauR406W virgin females. Adults were either mock-treated (black) or exposed to 1/50th (blue) or 1/10th the sex-specific LD50. Flies were reared in a 12-hr LD cycle in a light-controlled DAM (see Methods). (E–I) Quantification of sleep parameters from males and virgin females of the indicated genotypes and treatment groups. Each dot represents the response of a single individual. Only As-treated TauR406W mutants showed a significant difference in sleep behaviors: (E) total sleep, (F) day sleep, and (G) night sleep was reduced in TauR406W females exposed to 1/10th the LD50. (I) TauR406W males exposed to 1/50th LD50 had a lower activity index, while the 1/10th LD50 group did not. No significant changes in circadian rhythms were detected in the As-treated control (WT) samples. Data were analyzed from N= 12 individuals per genotype/treatment group pooled from 2 independent experiments. Data plotted as mean ± SD. Significance determined by two-way ANOVA followed by Tukey’s multiple comparisons test with **, p≤0.01 and *, p≤0.05. All other values were not significantly different from the respective untreated control.

References

    1. Abdul KS, Jayasinghe SS, Chandana EP, Jayasumana C, De Silva PM. Arsenic and human health effects: A review. Environ Toxicol Pharmacol. 2015;40(3):828–46. Epub 20150930. doi: 10.1016/j.etap.2015.09.016. - DOI - PubMed
    1. Chen CJ, Kuo TL, Wu MM. Arsenic and cancers. Lancet. 1988;1(8582):414–5. doi: 10.1016/s0140-6736(88)91207-x. - DOI - PubMed
    1. ATSDR. Arsenic Toxicity 2009. [updated May 19, 2023]. Available from: https://www.atsdr.cdc.gov/csem/arsenic/what_routes.html.
    1. WHO. Arsenic 2022. [cited 2024]. Available from: https://www.who.int/en/news-room/fact-sheets/detail/arsenic.
    1. Rodriguez-Barranco M, Lacasana M, Aguilar-Garduno C, Alguacil J, Gil F, Gonzalez-Alzaga B, Rojas-Garcia A. Association of arsenic, cadmium and manganese exposure with neurodevelopment and behavioural disorders in children: a systematic review and meta-analysis. Sci Total Environ. 2013;454–455:562–77. Epub 20130409. doi: 10.1016/j.scitotenv.2013.03.047. - DOI - PubMed

Publication types

LinkOut - more resources