[Preprint]. 2024 Aug 6:2024.08.02.606427.
doi: 10.1101/2024.08.02.606427.

A dorsal hippocampus-prodynorphinergic dorsolateral septum-to-lateral hypothalamus circuit mediates contextual gating of feeding

Affiliations

A dorsal hippocampus-prodynorphinergic dorsolateral septum-to-lateral hypothalamus circuit mediates contextual gating of feeding

Travis D Goode et al. bioRxiv. .

Abstract

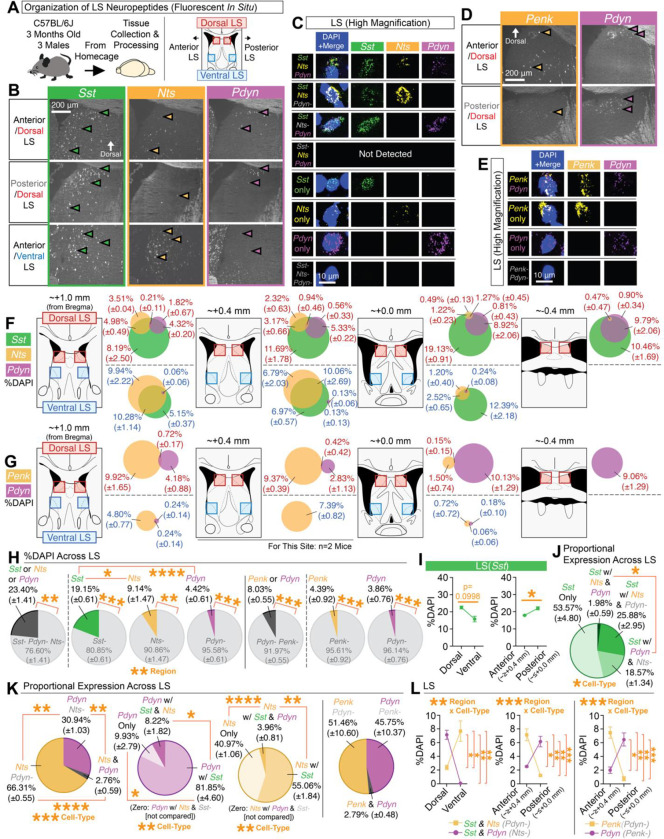
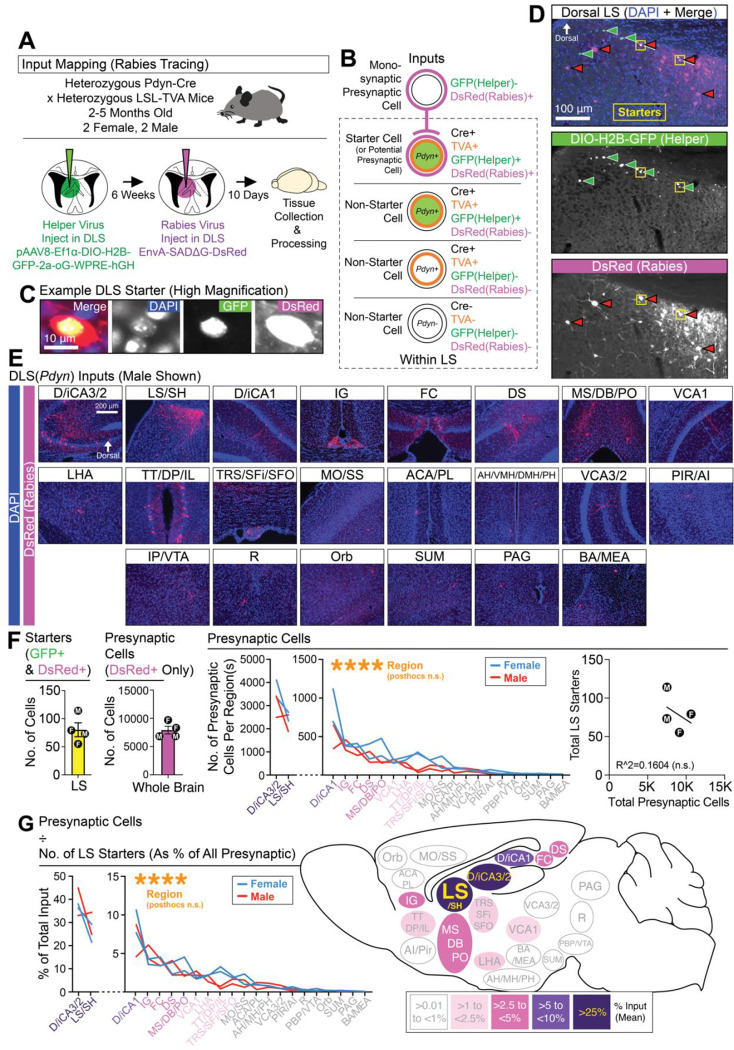
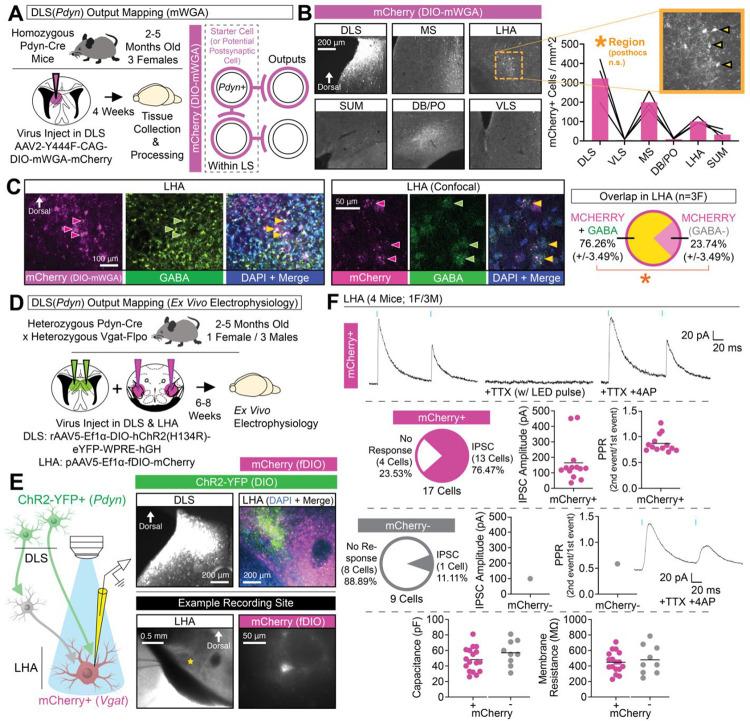
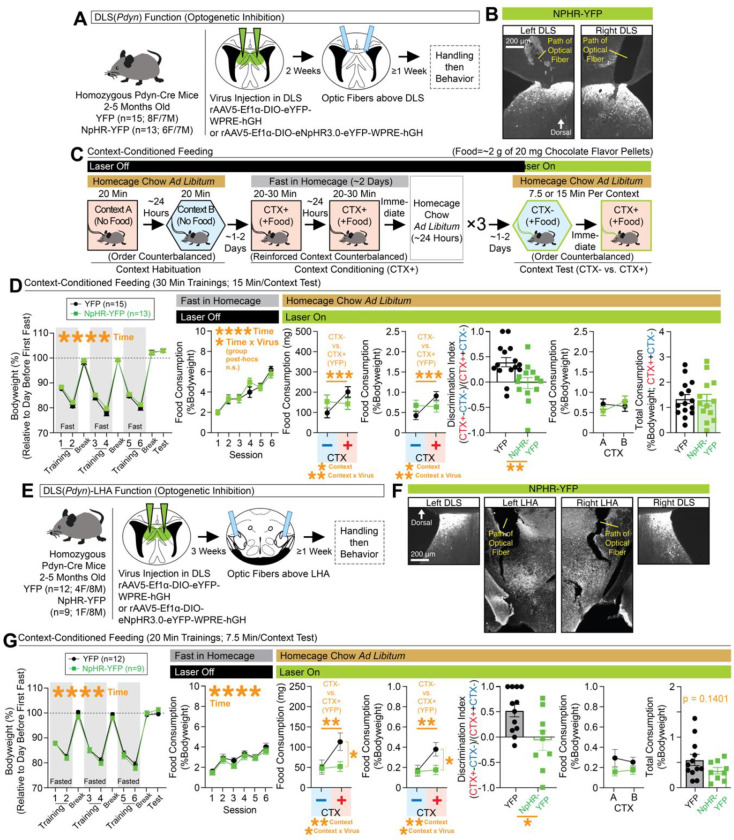
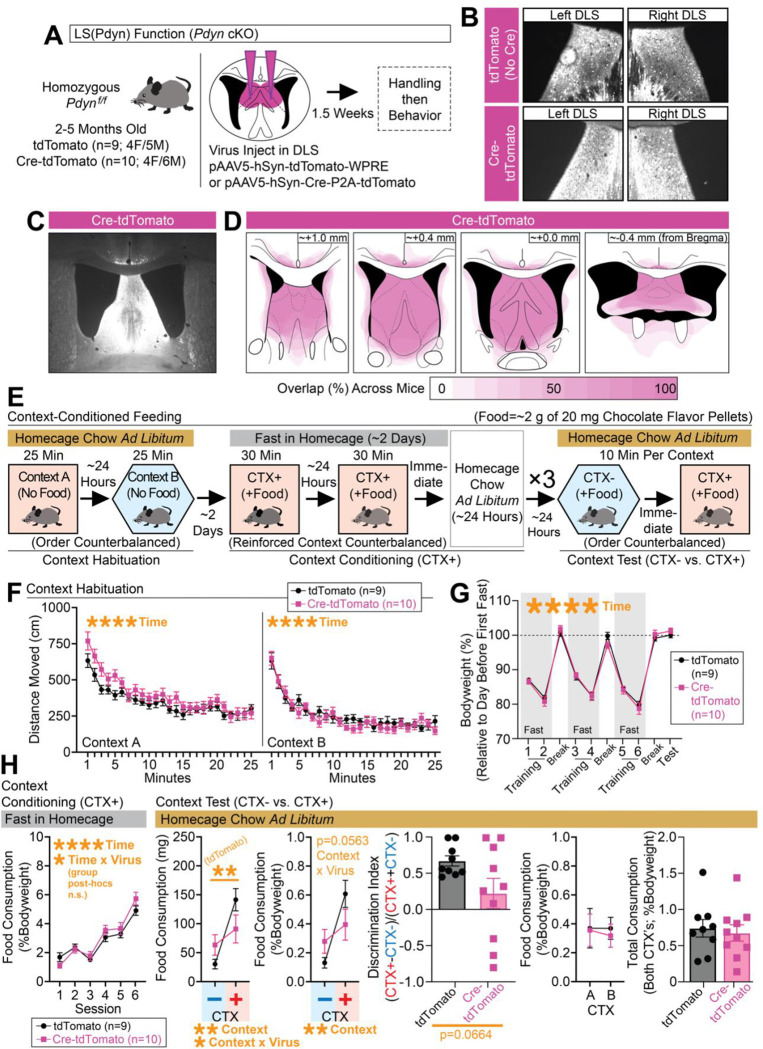
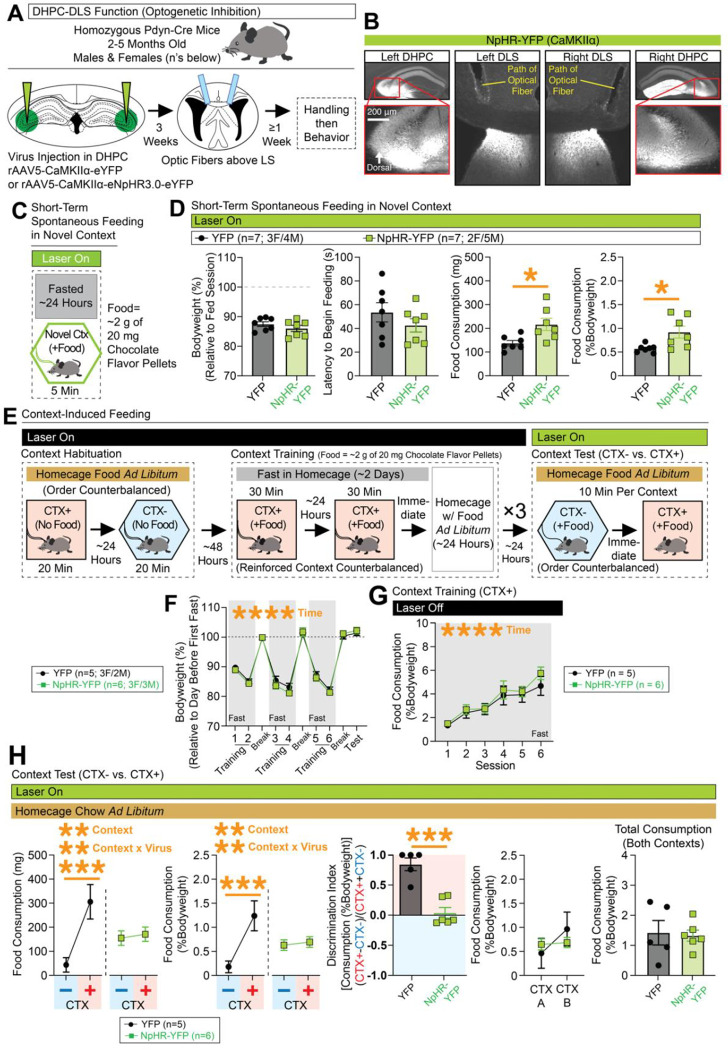
Adaptive regulation of feeding depends on linkage of internal states and food outcomes with contextual cues. Human brain imaging has identified dysregulation of a hippocampal-lateral hypothalamic area (LHA) network in binge eating, but mechanistic instantiation of underlying cell-types and circuitry is lacking. Here, we identify an evolutionary conserved and discrete Prodynorphin (Pdyn)-expressing subpopulation of Somatostatin (Sst)-expressing inhibitory neurons in the dorsolateral septum (DLS) that receives primarily dorsal, but not ventral, hippocampal inputs. DLS(Pdyn) neurons inhibit LHA GABAergic neurons and confer context- and internal state-dependent calibration of feeding. Viral deletion of Pdyn in the DLS mimicked effects seen with optogenetic silencing of DLS Pdyn INs, suggesting a potential role for DYNORPHIN-KAPPA OPIOID RECEPTOR signaling in contextual regulation of food-seeking. Together, our findings illustrate how the dorsal hippocampus has evolved to recruit an ancient LHA feeding circuit module through Pdyn DLS inhibitory neurons to link contextual information with regulation of food consumption.

Keywords: GABA; context; dorsal hippocampus; dorsolateral septum; eating disorder; feeding; kappa opioid receptors; lateral hypothalamus; prodynorphin; somatostatin.


Conflict of interest statement

COMPETING INTERESTS None. DECLARATION OF INTERESTS The authors have no conflicts of interest to report

Figures

Figure 1.
Figure 1.. Topographic mapping of neuropeptides reveals Pdyn as a distinct dorsal subset of Sst cells
(A) Multiplex fluorescent in situ hybridization was used to map the neuropeptides Sst, Nts, Penk, and Pdyn in the LS across its dorsal-ventral and anterior-posterior regions. (B) Representative coronal images of in situs for Sst, Nts, and Pdyn at different regions of the LS. (C) High magnification representative images of individual cells for each of the different cell-types detected for Sst, Nts, and/or Pdyn. (D) Representative coronal images of in situs for Penk and Pdyn at different regions of the LS. (E) High magnification representative images of individual cells for each of the different cell-types detected for Penk and/or Pdyn. (F) Mouse atlas images and venn diagrams [%DAPI (±SEM)] depicting the extent of overlap of Sst, Nts, and/or Pdyn at each quantified region in the LS. (G) Mouse atlas images and venn diagrams [%DAPI (±SEM)] depicting the extent of overlap of Penk and/or Pdyn at each quantified region in the LS. (H) Average expression (%DAPI) of Sst, Nts, Pdyn, and/or Penk across all quantified regions of the LS. Main effect of cell-type (ANOVA; significant Tukey’s post-hocs) for comparisons of Sst-positive, Nts-positive, and Pdyn-positive cells. Significant paired t-tests denote comparisons of positive vs. negative expression for each cell-type. (I) Average expression (%DAPI) of Sst in the dorsal vs. ventral LS and anterior vs. posterior LS (significant paired t-test). (J) The average proportion (derived from %DAPI) of each subtype for all Sst cells across all quantified regions of the LS (ANOVA: main effect of cell-type; significant Bonferroni post-hoc). (K) The average proportion (derived from %DAPI) of each subtype across all quantified LS regions for all Nts and/or Pdyn cells (ANOVA: main effect of cell-type; significant Tukey’s post-hocs), all Pdyn cell-types (ANOVA: main effect of cell-type; significant Tukey’s post-hocs), all Sst, Nts, and/or Pdyn cells (ANOVA: main effect of cell-type; significant Tukey’s post-hocs), and all Penk and/or Pdyn cells. (L) Comparisons of the average expression (%DAPI) of Sst-Nts and Sst-Pdyn cells in the dorsal vs. ventral and anterior vs. posterior regions of the LS, and Penk or Pdyn cells in the anterior vs. posterior regions of the LS (ANOVAs: significant interactions of region x cell-type; significant Bonferroni post-hocs). For the entire figure, all data are shown as mean (±SEM), and for all statistics: *=p<0.05; **p<0.005, ***p<0.0005; ****p<0.00005.
Figure 2.
Figure 2.. DLS(Pdyn) neurons receive dense DHPC input
(A) Monosynaptic rabies tracing was used to identify afferents to DLS(Pdyn) cells from across the brain. (B) A schematic shows the logic used for identifying starter and presynaptic cells. (C) High magnification image of a starter cell in the DLS. (D) Representative coronal images showing starter cells and monosynaptic labeling in the DLS. (E) Representative coronal images of brain-wide inputs to DLS(Pdyn) cells. (F) The number of starter cells detected in the DLS, the total number and per region of presynaptic inputs (ANOVA; main effect of region), and a plot correlating the number of starters with the total number of presynaptic cells. (G) A percentage of total input for each region(s) is calculated and summarized in a sagittal schematic (ANOVA; main effect of region). Outside of the individual data points plotted for each brain region(s), all data in the figure are shown as mean (±SEM); no significant comparisons noted in figure. Abbreviations (see methods for additional details): “D/iCA3/2” (dorsal/intermediate CA3/2 of the dorsal hippocampus), “LS/SH” (lateral septum and/or septohippocampal area within the LS), “D/iCA1” (dorsal/intermediate CA1 of the dorsal hippocampus), “IG” (indusium griseum), “FC” (fasciola cinerea), “DS” (dorsal subiculum), “MS/DB/PO” (medial septum, diagonal band, and/or preoptic area), “VCA1” (ventral CA1), “LHA” (lateral hypothalamic area, which could also include the tuberal area), “TT/DP/IL” (tenia tecta, dorsal peduncular, and/or infralimbic areas), “MO/SS” (motor and/or somatosensory cortices), “ACA/PL” (anterior cingulate and/or prelimbic areas), “AH/VMH/DMH/PH” (anterior hypothalamus, ventromedial hypothalamus, dorsomedial hypothalamus, and/or posterior hypothalamus), “VCA3/2” (ventral CA3/2), “PIR/AI” (piriform area and/or agranular insular area), “IP/VTA” (interpeduncular nucleus and/or ventral tegmental area), “R” (raphe), “ORB” (orbital area), “SUM” (supramammillary nucleus), “PAG” (periaqueductal gray), “BA/MEA” (basal regions of the amygdala and/or medial amygdala).
Figure 3.
Figure 3.. DLS(Pdyn) cells project to and inhibit GABAergic cells in the LHA
(A) Cell-type-specific and virally mediated anterograde mapping (DIO-mWGA-mCherry) was used to identify outputs of DLS(Pdyn) cells in Pdyn-Cre mice. (B) Representative coronal images showing DIO-mWGA-mCherry expression in the DLS and output regions, with the quantification of the number of cells per imaged region (ANOVA; main effect of region). (C) Representative coronal images (including confocal cross-section images) showing mCherry-expressing cells and immunolabeling for GABA in the LHA, as well as quantification of the percent of overlap across mice in the LHA for mCherry and GABA (significant paired t-test). (D) Pdyn-Cre::Vgat-Flpo mice were injected in the DLS with Cre-dependent ChR2-YFP-expressing virus and Flp-dependent mCherry-expressing virus was injecting in the LHA and ex vivo electrophysiology was performed. (E) Schematic for strategy for ex vivo electrophysiology, with right images showing representative coronal images of ChR2-YFP in the DLS (top left), ChR2-YFP and mCherry in the LHA (top right), and an example recording site (star) and mCherry-positive cell used for patching (bottom right). (F) Top: Example traces in a mCherry-positive LHA cell showing inhibitory post-synaptic current (IPSC) following paired pulses of blue light, their loss with TTX, and isolation of monosynaptic responses (+4AP). Top-middle: Quantifications of the number mCherry-positive cells exhibiting light-evoked IPSCs, their amplitude (pA), and PPR. Bottom-middle: Quantifications of the number mCherry-negative cells exhibiting light-evoked IPSCs, their amplitude (pA), and PPR. Bottom: Capacitance and membrane resistance of each recorded cell (w/ and w/o mCherry). No statistical tests were used in (F). For (C), the data are shown as mean (±SEM); all other data in the figure are shown as individual datapoints with the mean noted. For all statistics (if applicable): *=p<0.05; **p<0.005, ***p<0.0005; ****p<0.00005.
Figure 4.
Figure 4.. Disrupted expression of context-conditioned food consumption with optogenetic inhibition of DLS(Pdyn) cells or their terminals in the LHA
(A) Pdyn-Cre mice were injected with Cre-dependent NpHR-expressing or control virus in the DLS and optic fibers were placed above the DLS. (B) Representative coronal images with optic fiber tracts and NpHR-YFP-expression in the left/right DLS. (C) Behavioral design for context-conditioned feeding. Optogenetic inhibition occurred during the context test phase. (D) Leftmost graph depicts bodyweight (%) across training and testing (ANOVA: main effect of time). The next graph depicts food consumption (%Bodyweight) at each training session (ANOVA: main effect of time). At test, food consumption (mg and %Bodyweight) is plotted for the nonreinforced (CTX−) and reinforced (CTX+) contexts (for both mg and %Bodyweight, ANOVAs: main effects of context and context x virus interactions, significant Bonferroni post-hocs for comparing CTX− vs. CTX+ in controls). A discrimination index was generated based on consumption at test (%Bodyweight; significant unpaired t-test). Final two graphs plot consumption (%Bodyweight) across contexts A and B at test (whether CTX+ or CTX−) and total consumption (%Bodyweight) for both contexts at test. (E) Pdyn-Cre mice were injected with NpHR-expressing or control virus in the DLS and optic fibers were placed above the LHA. (F) Representative coronal images with NpHR-YFP expression in the left/right DLS and LHA and optic fiber tracts above the LHA. (G) Leftmost graph depicts changes in bodyweight (%) across training and testing (ANOVA: main effect of time). The next graph depicts food consumption (%Bodyweight) at each training session (ANOVA: main effect of time). At test, food consumption (mg and %Bodyweight) is plotted for the nonreinforced (CTX−) and reinforced (CTX+) contexts (for both mg and %Bodyweight, ANOVAs: main effects of context and context x virus interactions, significant Bonferroni post-hocs for comparing CTX− vs. CTX+ in controls). A discrimination index was generated based on consumption at test (from %Bodyweight; significant unpaired t-test). Final two graphs plot consumption (%Bodyweight) across contexts A and B at test (whether CTX+ or CTX−) and total consumption (%Bodyweight; unpaired t-test shown) for both contexts at test. For the entire figure, all data are shown as mean (±SEM), and for all statistics: *=p<0.05; **p<0.005, ***p<0.0005; ****p<0.00005.
Figure 5.
Figure 5.. Deletion of Pdyn in the DLS alters context-conditioned food consumption
(A) Pdynf/f mice were injected with Cre-expressing or control virus in the DLS. (B) Representative coronal images with Cre-mCherry or mCherry expression in the left/right DLS. (C) Larger representative coronal image showing Cre-mCherry expression in the septum. (D) Spread of Cre-mCherry virus was documented for each mouse. (E) Schematic showing the behavioral design for context-conditioned feeding. (F) Distance moved (cm) in contexts A and B during habituation (separate ANOVAs per context: main effects of time). (G) Bodyweight (%) across training and testing (ANOVA: main effect of time). (H) Leftmost graph depicts food consumption (%Bodyweight) at each training session (ANOVA: main effect of time). At test, food consumption (mg and %Bodyweight) is plotted for the nonreinforced (CTX−) and reinforced (CTX+) contexts (for mg, ANOVA: main effect of context and context x virus interactions, significant Bonferroni post-hocs for comparing CTX− vs. CTX+ in controls; for %Bodyweight, ANOVA: main effect of context, p=0.0563 for interaction). A discrimination index was generated based on consumption at test (%Bodyweight; unpaired t-test shown). Final two graphs plot consumption (%Bodyweight) across contexts A and B at test (whether CTX+ or CTX−) and total consumption (%Bodyweight) for both contexts at test. For the entire figure, all data are shown as mean (±SEM), and for all statistics: *=p<0.05; **p<0.005, ***p<0.0005; ****p<0.00005.
Figure 6.
Figure 6.. Inhibition of DHPC inputs in the DLS disrupts expression of context-specific expression food consumption
(A) Pdyn-Cre mice were injected with NpHR-expressing or control virus in the DHPC and optic fibers were placed above the DLS. (B) Representative coronal images with NpHR-YFP expression in the DHPC/DLS and optic tracts above the DLS. (C) Behavioral design for testing spontaneous feeding of fasted mice in a novel context. Optogenetic inhibition occurred throughout test. (D) Leftmost graph shows bodyweight (%) relative to the day before testing. The next graph shows latency (s) to begin chewing food. The final two graphs show the total amount of food consumed at the end of the test (in mg and %Bodyweight, significant unpaired t-tests for both. (E) Behavioral design for context-conditioned feeding. Optogenetic inhibition occurred during the context test phase. (F) Bodyweight (%) across training and testing (ANOVA: main effect of time). (G) Food consumption (%Bodyweight) at each training session (ANOVA: main effect of time). (H) At test, food consumption (mg and %Bodyweight) is plotted for the nonreinforced (CTX−) and reinforced (CTX+) contexts (for both mg and %Bodyweight, ANOVAs: main effects of context and context x virus interactions, significant Bonferroni post-hocs for comparing CTX− vs. CTX+ in controls). A discrimination index was generated based on consumption at test (from %Bodyweight; significant unpaired t-test). Final two graphs plot consumption (%Bodyweight) across contexts A and B at test (whether CTX+ or CTX−) and total consumption (%Bodyweight; unpaired t-test shown) for both contexts at test. For the entire figure, all data are shown as mean (±SEM), and for all statistics: *=p<0.05; **p<0.005, ***p<0.0005; ****p<0.00005.

References

    1. Watts A.G., Kanoski S.E., Sanchez-Watts G., and Langhans W. (2022). The physiological control of eating: signals, neurons, and networks. Physiol Rev 102, 689–813. 10.1152/physrev.00028.2020. - DOI - PMC - PubMed
    1. Alcantara I.C., Tapia A.P.M., Aponte Y., and Krashes M.J. (2022). Acts of appetite: neural circuits governing the appetitive, consummatory, and terminating phases of feeding. Nat Metab 4, 836–847. 10.1038/s42255-022-00611-y. - DOI - PMC - PubMed
    1. Waterson M.J., and Horvath T.L. (2015). Neuronal Regulation of Energy Homeostasis: Beyond the Hypothalamus and Feeding. Cell Metab 22, 962–970. 10.1016/j.cmet.2015.09.026. - DOI - PubMed
    1. Rossi M.A., and Stuber G.D. (2018). Overlapping Brain Circuits for Homeostatic and Hedonic Feeding. Cell Metab 27, 42–56. 10.1016/j.cmet.2017.09.021. - DOI - PMC - PubMed
    1. Saper C.B., Chou T.C., and Elmquist J.K. (2002). The Need to Feed. Neuron 36, 199–211. 10.1016/S0896-6273(02)00969-8. - DOI - PubMed

Publication types

LinkOut - more resources