[Preprint]. 2024 Aug 10:2024.08.09.607311.
doi: 10.1101/2024.08.09.607311.

TFE3 fusions direct an oncogenic transcriptional program that drives OXPHOS and unveils vulnerabilities in translocation renal cell carcinoma

Affiliations

TFE3 fusions direct an oncogenic transcriptional program that drives OXPHOS and unveils vulnerabilities in translocation renal cell carcinoma

Jiao Li et al. bioRxiv. .

Update in

Abstract

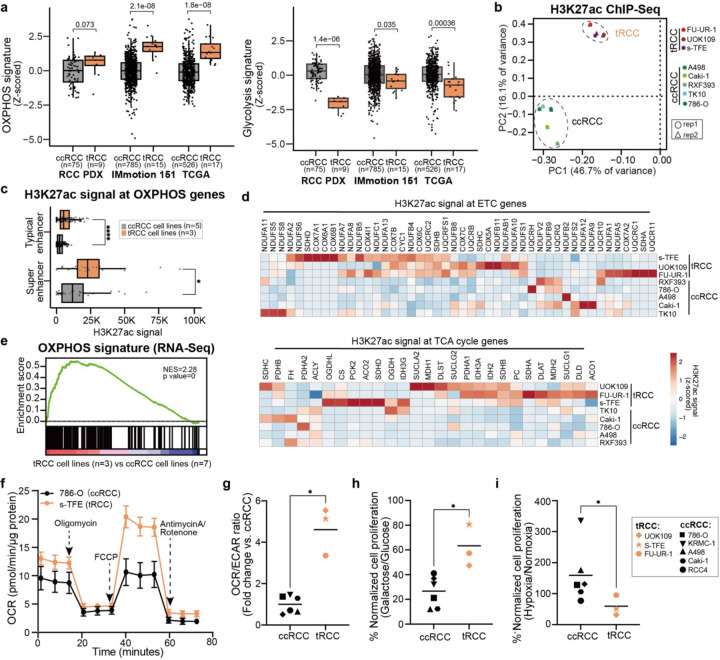
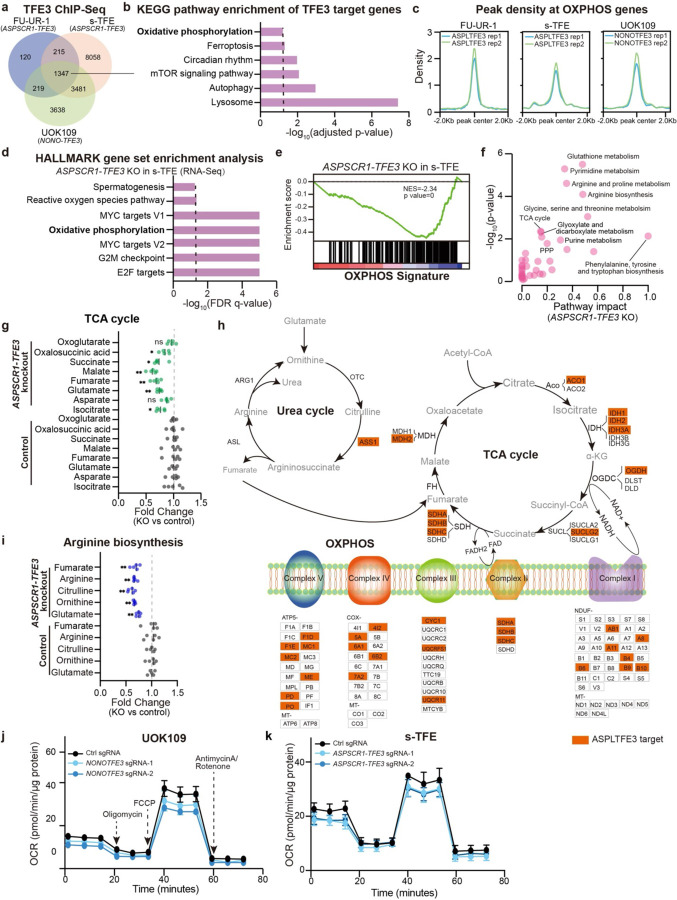
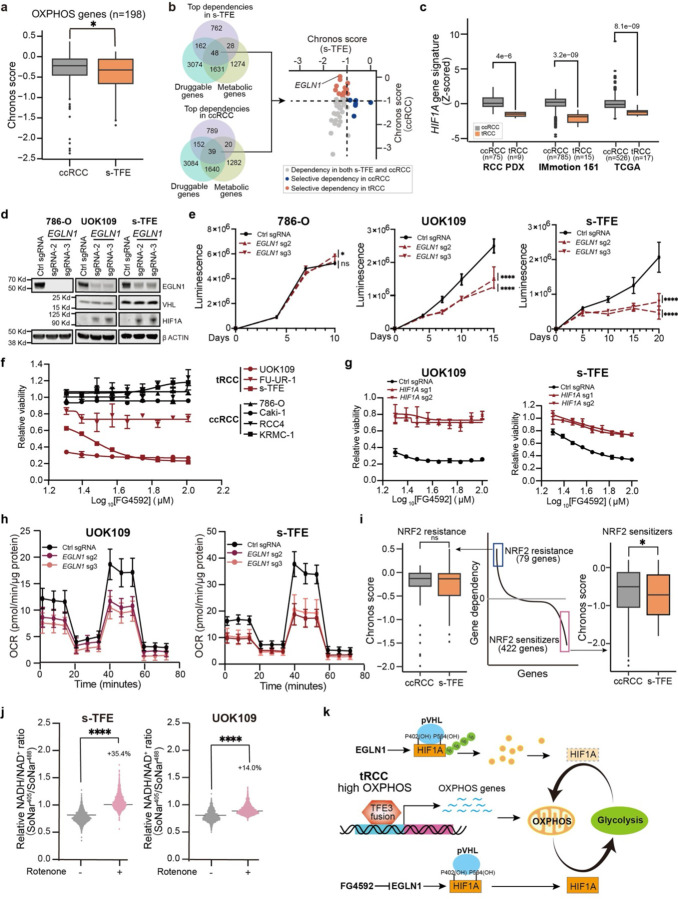
Translocation renal cell carcinoma (tRCC) is an aggressive subtype of kidney cancer driven by TFE3 gene fusions, which act via poorly characterized downstream mechanisms. Here we report that TFE3 fusions transcriptionally rewire tRCCs toward oxidative phosphorylation (OXPHOS), contrasting with the highly glycolytic metabolism of most other renal cancers. This TFE3 fusion-driven OXPHOS program, together with heightened glutathione levels found in renal cancers, renders tRCCs sensitive to reductive stress - a metabolic stress state induced by an imbalance of reducing equivalents. Genome-scale CRISPR screening identifies tRCC-selective vulnerabilities linked to this metabolic state, including EGLN1, which hydroxylates HIF-1α and targets it for proteolysis. Inhibition of EGLN1 compromises tRCC cell growth by stabilizing HIF-1a and promoting metabolic reprogramming away from OXPHOS, thus representing a vulnerability to OXPHOS-dependent tRCC cells. Our study defines a distinctive tRCC-essential metabolic program driven by TFE3 fusions and nominates EGLN1 inhibition as a therapeutic strategy to counteract fusion-induced metabolic rewiring.


Conflict of interest statement

Declaration of Interests S.R.V. has consulted for Jnana Therapeutics within the past 3 years and receives research support from Bayer. L.B-P. is a co-founder, holds equity in and is a consultant for Scorpion Therapeutics.

Figures

Fig. 1:
Fig. 1:. tRCCs bioenergetically favor OXPHOS.
(a) OXPHOS and glycolysis gene signature scores in ccRCC or tRCC tumors from three independent studies (TCGA, Motzer et al., Elias et al. (PDX)),,. (b) Principal component analysis (PCA) of H3K27ac ChIP-Seq data across 8 RCC cell lines (3 tRCC; 5 ccRCC; 4 ccRCC lines were profiled in a previously published study, see Extended Data Fig. S1). (c) Boxplot of averaged H3K27ac signal at typical or super enhancers at OXPHOS genes in 3 tRCC cell lines (UOK109, FU-UR-1, s-TFE) vs. 5 ccRCC cell lines (786-O, Caki-1, RXF393, TK10, A498). (d) Heatmap showing H3K27ac signal (quantified by ROSE2) at ETC and TCA cycle genes in tRCC vs. ccRCC cell lines. (e) GSEA showing enrichment of OXPHOS gene signature in tRCC cell lines (n=3, UOK109, FU-UR-1, s-TFE) versus ccRCC cell lines from CCLE (n=7, A498, A704, 786-O, 769-P, Caki-1, Caki-2, OS-RC-2). (f) Oxygen consumption rate (OCR) as measured by a Seahorse Bioflux analyzer after the addition of oligomycin, FCCP, or antimycin A/rotenone in a ccRCC cell line (786-O) and a tRCC cell line (s-TFE). Data are shown as mean ± s.d, n=5 biological replicates for 786-O cell line, n=6 biological replicates for s-TFE cell line. (g) Ratio of (OCR) to extracellular acidification rate (ECAR) as detected by a Seahorse Bioflux analyzer in ccRCC (n=6, 786-O, Caki-1, Caki-2, KRMC-1, A498, RCC4) and tRCC (n=3, UOK109, FU-UR-1, s-TFE) cell lines. OCR/ECAR ratio represents the basal respiration:glycolytic balance in each cell line. Data are shown as mean ± s.d, n=5–7 biological replicates per cell line. (h) Viability of ccRCC (n=6, 786-O, Caki-1, Caki-2, KRMC-1, A498, RCC4) and tRCC (n=3, UOK109, FU-UR-1, s-TFE) cell lines cultured in glucose or galactose-containing media for 6 days. Data are shown as mean ± s.d. n=3 biological replicates per cell line. (i) Viability of ccRCC (n=6, 786-O, Caki-1, Caki-2, KRMC-1, A498, RCC4) and tRCC (n=3, UOK109, FU-UR-1, s-TFE) cell lines cultured under hypoxic (2.5% O2) or normoxic (20% O2) conditions for 10 days. Data are shown as mean ± s.d. n=3–4 biological replicates per cell line. For panels (a), (c) and (g-i), statistical significance was determined by Mann-Whitney U test. *p < 0.05, **p < 0.01, ***p < 0.001, **** p < 0.0001, n.s. not significant.
Fig. 2:
Fig. 2:. OXPHOS metabolism in tRCC is driven by the TFE3 fusion.
(a) Venn diagram showing overlap of TFE3 fusion peaks detected by ChIP-Seq across three tRCC cell lines (FU-UR-1, s-TFE, UOK109). (b) KEGG pathway analysis showing pathways significantly enriched amongst genes proximal to TFE3 fusion peaks (from shared peaks in panel (a)). (c) Profile plot showing TFE3 fusion ChIP-Seq signal at OXPHOS genes. (d) Bar plot showing the top gene sets depleted upon ASPSCR1-TFE3 knockout in s-TFE cells. (e) GSEA plot showing depletion of OXPHOS gene signature in s-TFE cells upon ASPSCR1-TFE3 knockout. (f) KEGG analysis on untargeted metabolomic profiling data displaying metabolic pathways downregulated following ASPSCR1-TFE3 knockout in s-TFE cells. (g) Change in levels of TCA cycle-related metabolites following ASPSCR1-TFE3 knockout in s-TFE cells. For each metabolite, fold change was normalized to control sgRNA condition. Data are shown as mean ± s.d, n=5 biological replicates per cell line. (h) Schematic of urea cycle, TCA cycle, and the mitochondrial electron transport chain (ETC), annotated with genes that are ASPL-TFE3 targets as determined by ChIP-Seq in s-TFE cells (orange box). In the schematic, enzymes are in black text, metabolites are in gray text. (i) Change in levels of arginine biosynthesis-related metabolites following ASPSCR1-TFE3 knockout in s-TFE cells. For each metabolite, fold change was normalized to control sgRNA condition. Data are shown as mean ± s.d, n=5 biological replicates per cell line. (j) Oxygen consumption rate (OCR) level after knockout of NONO-TFE3 in UOK109 tRCC cell line. Data are shown as mean ± s.d, n=5–6 biological replicates. (k) Oxygen consumption rate (OCR) level after knockout of ASPSCR1-TFE3 in s-TFE tRCC cell line. Data are shown as mean ± s.d, n=8–11 biological replicates. For panels (g) and (i), statistical significance was determined by Mann-Whitney U test. *p < 0.05, **p < 0.01, ***p < 0.001, **** p < 0.0001, n.s. not significant.
Fig. 3:
Fig. 3:. Selective EGLN1 dependency in tRCC.
(a) Comparison of dependency scores for OXPHOS genes in ccRCC cell lines (averaged across 5 cell lines for each gene) vs. s-TFE tRCC cells. (b) Gene dependencies identified via genome-scale CRISPR/Cas9 screening in s-TFE (tRCC) or ccRCC cells were overlapped with druggable and metabolic gene lists to nominate EGLN1 as a candidate selective dependency in tRCC cells. (c) HIF1A gene signature scores in ccRCC or tRCC tumors from three independent studies as in Figure 1A. (d) Western blot showing expression of EGLN1, VHL, and HIF1A after knockout of EGLN1 in a ccRCC cell line (786-O) or tRCC cell lines (UOK109 and s-TFE). (e) Cell proliferation of tRCC cell lines (UOK109 and s-TFE) and ccRCC (786-O) after knockout of EGLN1. Data are shown as mean ± s.d. n=3 biological replicates. (f) Relative cell viability (normalized to DMSO control) of tRCC cell lines or ccRCC lines after treatment with the EGLN inhibitor FG4592. Data are shown as mean ± s.d. n=3 biological replicates. (g) Relative viability of HIF1A knockout tRCC cell lines (n=2, UOK109 and s-TFE) after treatment with FG4592. Data are shown as mean ± s.d. n=3 biological replicates. (h) OCR after knockout of EGLN1 in UOK109 and s-TFE cell lines. Data shown as mean ± s.d, n=8–16 biological replicates. (i) Genes whose knockout has been previously reported to confer sensitivity (422 genes) or resistance (79 genes) to NRF2 activation were compared for dependency in s-TFE cells vs. ccRCC cells (average of dependency score for 5 ccRCC cell lines, for each gene). (j) Quantification of NADH to NAD+ ratio via SoNar assay following rotenone treatment in tRCC cell lines (UOK109 and s-TFE). (k) Model: EGLN1 modulates OXPHOS and is a dependency in tRCC. For panel (a), (c), (e), and (i-j), statistical significance was determined by Mann-Whitney U test. *p < 0.05, **p < 0.01, ***p < 0.001, **** p < 0.0001, n.s. not significant.

References

    1. Kauffman E. C. et al. Molecular genetics and cellular features of TFE3 and TFEB fusion kidney cancers. Nat Rev Urol 11, 465–475 (2014). - PMC - PubMed
    1. Moch H., Cubilla A. L., Humphrey P. A., Reuter V. E. & Ulbright T. M. The 2016 WHO Classification of Tumours of the Urinary System and Male Genital Organs—Part A: Renal, Penile, and Testicular Tumours. European Urology 70, 93–105 (2016). - PubMed
    1. Bakouny Z. et al. Integrative clinical and molecular characterization of translocation renal cell carcinoma. Cell Reports 38, 110190 (2022). - PMC - PubMed
    1. Argani P. et al. Xp11 translocation renal cell carcinoma in adults: expanded clinical, pathologic, and genetic spectrum. Am J Surg Pathol 31, 1149–1160 (2007). - PubMed
    1. Xu L. et al. Xp11.2 translocation renal cell carcinomas in young adults. BMC Urol 15, 57 (2015). - PMC - PubMed

Publication types