[Preprint]. 2024 Aug 10:2024.08.09.607377.
doi: 10.1101/2024.08.09.607377.

microRNA-1 Regulates Metabolic Flexibility in Skeletal Muscle via Pyruvate Metabolism

Affiliations

microRNA-1 Regulates Metabolic Flexibility in Skeletal Muscle via Pyruvate Metabolism

Ahmed Ismaeel et al. bioRxiv. .

Update in

Abstract

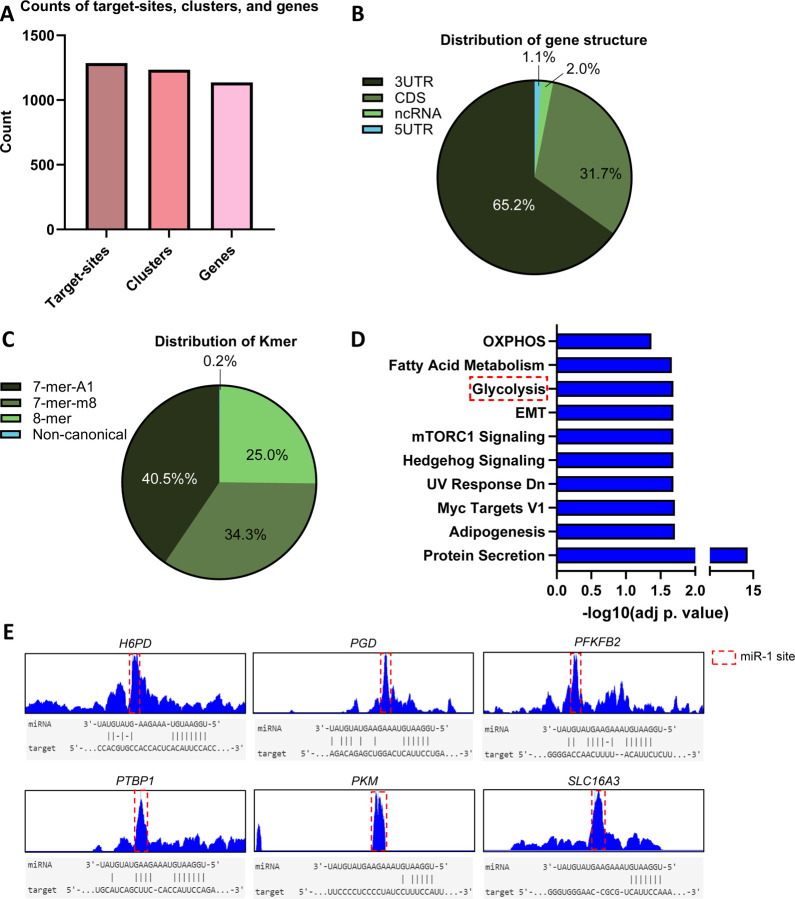
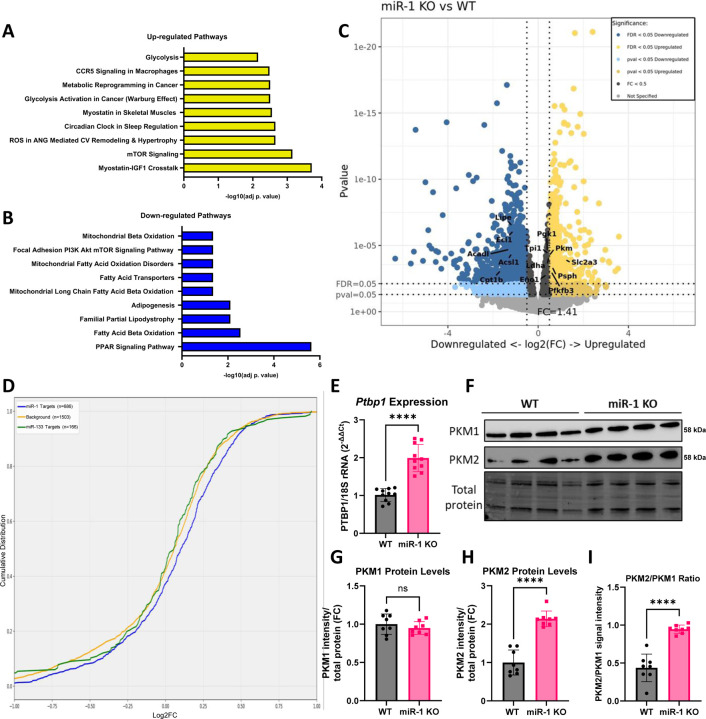
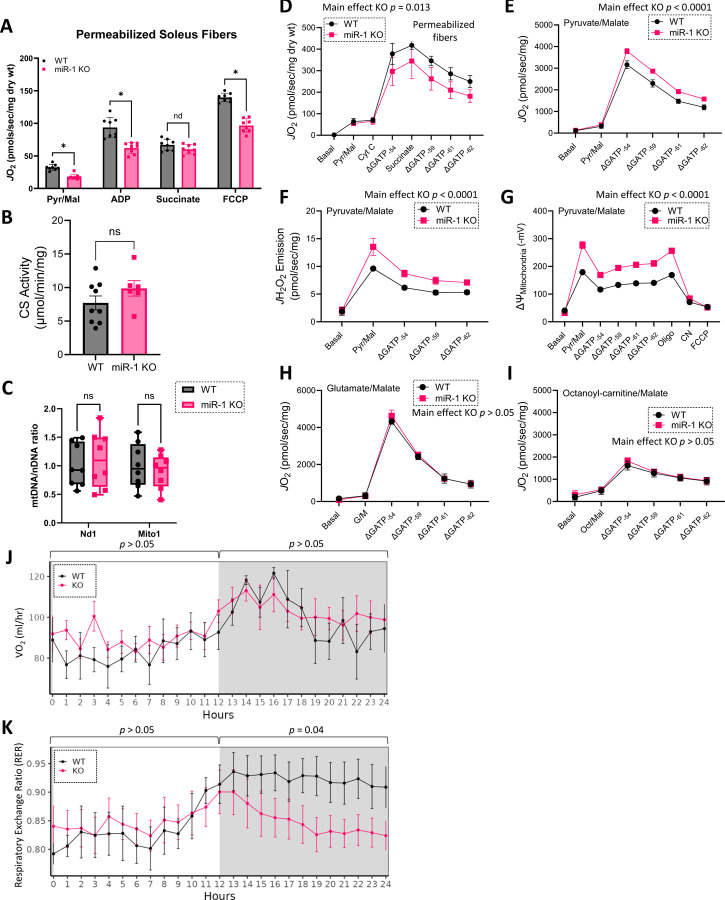
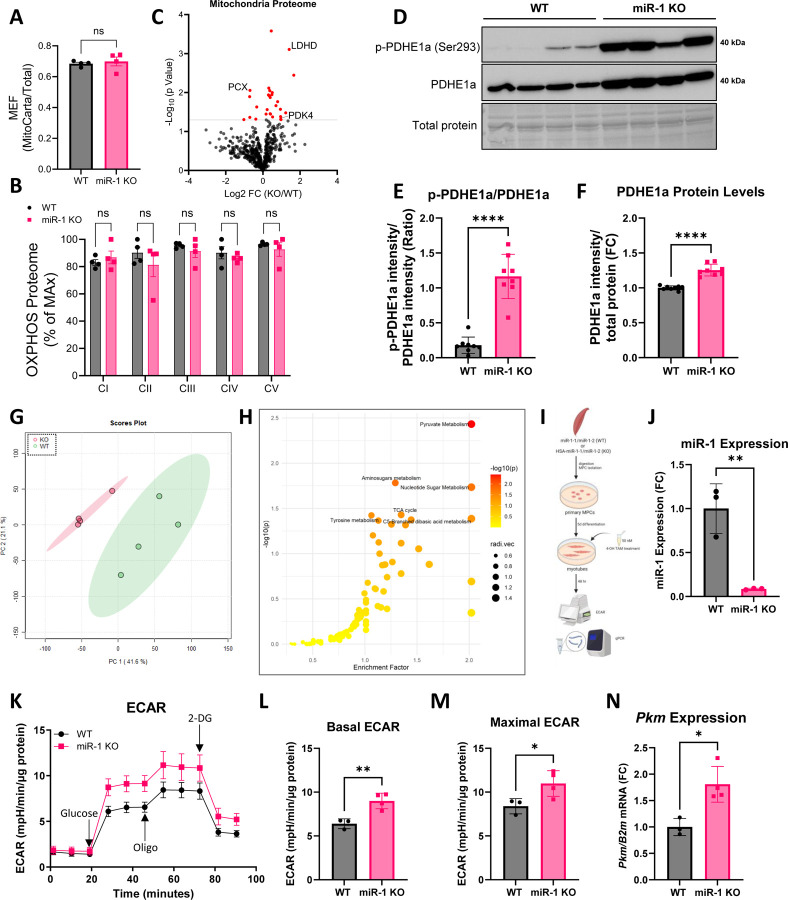
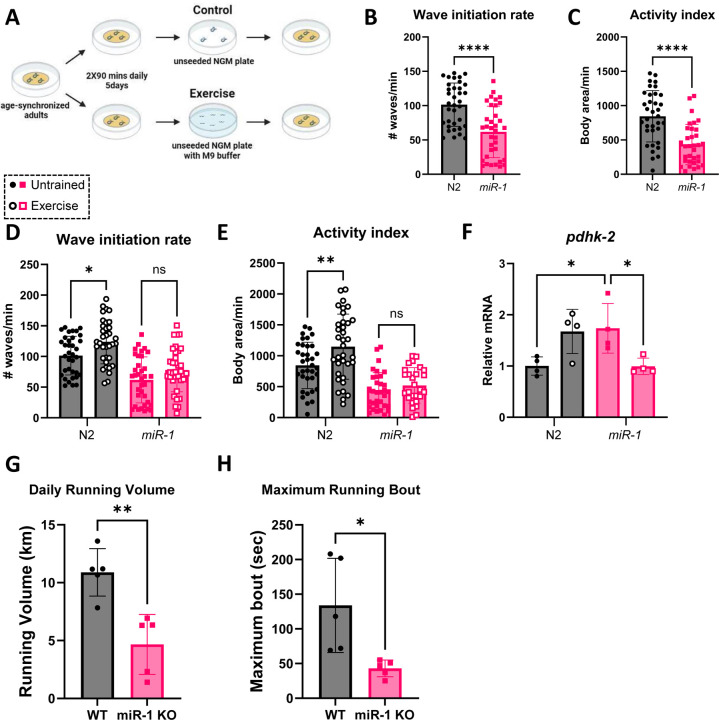
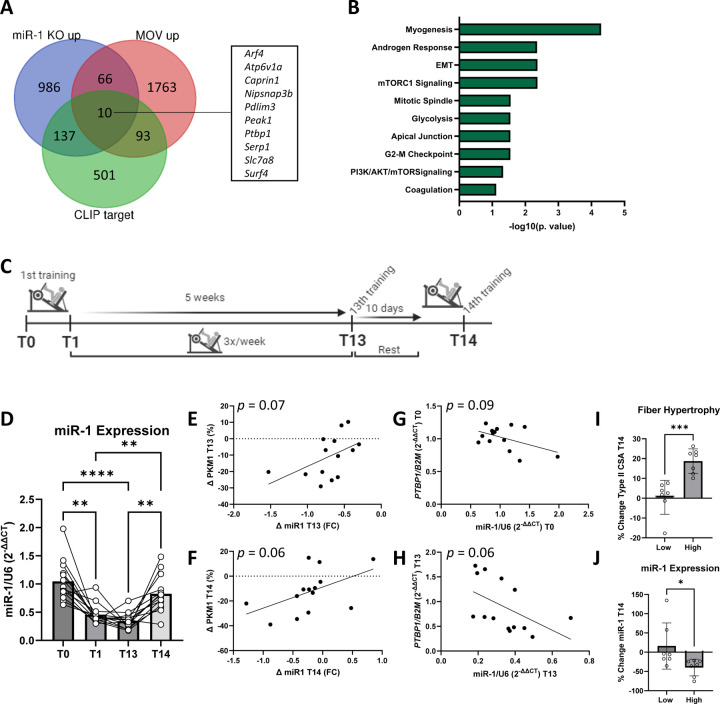
MicroRNA-1 (miR-1) is the most abundant miRNA in adult skeletal muscle. To determine the function of miR-1 in adult skeletal muscle, we generated an inducible, skeletal muscle-specific miR-1 knockout (KO) mouse. Integration of RNA-sequencing (RNA-seq) data from miR-1 KO muscle with Argonaute 2 enhanced crosslinking and immunoprecipitation sequencing (AGO2 eCLIP-seq) from human skeletal muscle identified miR-1 target genes involved with glycolysis and pyruvate metabolism. The loss of miR-1 in skeletal muscle induced cancer-like metabolic reprogramming, as shown by higher pyruvate kinase muscle isozyme M2 (PKM2) protein levels, which promoted glycolysis. Comprehensive bioenergetic and metabolic phenotyping combined with skeletal muscle proteomics and metabolomics further demonstrated that miR-1 KO induced metabolic inflexibility as a result of pyruvate oxidation resistance. While the genetic loss of miR-1 reduced endurance exercise performance in mice and in C. elegans, the physiological down-regulation of miR-1 expression in response to a hypertrophic stimulus in both humans and mice causes a similar metabolic reprogramming that supports muscle cell growth. Taken together, these data identify a novel post-translational mechanism of adult skeletal muscle metabolism regulation mediated by miR-1.

Keywords: C. elegans; Warburg effect; aerobic glycolysis; eCLIP-seq; hypertrophy; metabolomics; microRNA; proteomics; resistance exercise.


Figures

Figure 1.
Figure 1.. Widespread binding of miR-1 targets in human skeletal muscle.
(A) Number of miR-1 target sites across clusters and genes (Count). (B) Pie chart of miR-1 binding events across gene structure, proportion (%) indicated. 3UTR: 3’ untranslated region, CDS: coding sequence, ncRNA: noncoding RNA, 5UTR: 5’ untranslated region. (C) Pie chart of Kmer distributions of miR-1 predicted binding events, proportion (%) indicated. (D) Pathway enrichment analysis (MSigDB Hallmark 2020) of AGO2 eCLIP-defined miR-1 target genes. Top 10 pathways by adj. p-value shown. (E) Example miR-1 binding peaks in mRNAs involved in glycolysis and parallel metabolic pathways outlined with red dotted line. miR-1 alignment on mouse target sequence shown below.
Figure 2.
Figure 2.. Transcriptomic profiling of miR-1 KO skeletal muscle.
(A-B) Pathway enrichment analysis (Elsevier Pathway Collection) of significantly up-regulated genes (A) (FDR < 0.05, Log2FC > 0) and significantly down-regulated genes (B) (FDR < 0.05, Log2FC < 0) in miR-1 KO/WT from gastrocnemius bulk RNA-seq (n=4 female WT, n=4 female miR-1 KO, post-vehicle or tamoxifen treatment and an 8-week washout). Top 9 pathways (by adj. p-value) shown. (C) Volcano plot of differentially expressed genes, dashed lines indicate p-value, FDR, and FC cutoffs. Yellow represents significantly up-regulated genes, and blue represents significantly down-regulated genes. P-value cutoff set at 1e-25 for visibility. Genes in pathways from (A-B) labeled on the volcano plot. (D) Cumulative density function (CDF) of eCLIP-seq-defined miR-1 targets (blue) and miR-133 (green) Log2FC from RNA-seq compared to non-miR-1 targets (yellow). (E) Ptbp1 mRNA expression in WT and miR-1 KO gastrocnemius. (F) Representative Western blot of PKM1 and PKM2 and corresponding total protein levels in WT and miR-1 KO gastrocnemius muscle lysates. (G-I) Quantification of (G) PKM1 protein levels, (H) PKM2 protein levels, and (I) the ratio of PKM2 to PKM1. For Western blotting and qPCR experiments, n=8–10 WT and n=8–10 miR-1 KO females (post-tamoxifen treatment and an 8-week washout) were used, and differences between WT and miR-1 KO were tested using an independent t-test. ****p < 0.0001, ns: not significant.
Figure 3.
Figure 3.. Bioenergetic phenotyping of miR-1 KO skeletal muscle.
(A) Assessment of mitochondrial respiration in permeabilized soleus fibers (n=8 mice per group, post-tamoxifen treatment and an 8-week washout). Oxygen flux (JO2) normalized to mg tissue dry weight. Pyruvate/Malate-supported complex I leak (Pyr/Mal), ADP-stimulated OXPHOS (ADP), complex II OXPHOS (Succinate), and maximum respiration/ET capacity (FCCP) tested. (B) Citrate synthase (CS) activity in gastrocnemius complex lysates, normalized to protein (C) Quantitation of mitochondrial DNA (mtDNA) by levels of NADH Dehydrogenase 1 (Nd1), and Mito1 relative to nuclear DNA (nDNA) in gastrocnemius muscle. Data in (B-C) from n=6–9 female mice per group, post-tamoxifen treatment and an 8-week washout. (D) Assessment of OXPHOS kinetics using the CK clamp technique (increasing free energies [i.e., more negative ΔGATP values correspond to an increased ATP/ADP ratio)] with Pyr/Mal and succinate as substrates in permeabilized fibers from the gastrocnemius, data normalized to mg dry weight. (E) Assessment of OXPHOS kinetics using the CK clamp technique with Pyr/Mal as substrates in isolated mitochondria, data normalized to total protein. (F) H2O2 emission rate (JH2O2) assessed in isolated mitochondria in response to Pyr/Mal using a CK clamp, normalized to total protein. (G) Mitochondrial membrane potential (ΔΨ), expressed in mV, in response to Pyr/Mal using a CK clamp. Oligo: oligomycin, CN: cyanide. (H) OXPHOS kinetics using the CK clamp technique with glutamate/malate (G/M) as substrates in isolated mitochondria, data normalized to total protein. (I) OXPHOS kinetics using the CK clamp technique with octanoyl-carnitine/malate (Oct/Mal) as substrates in isolated mitochondria, data normalized to total protein. Data in (D-I) from n=4 WT and n=4 miR-1 KO female mice (post-tamoxifen treatment and an 8-week washout), and data are mean ± SEM. Data in (A-C) analyzed by t-tests or multiple t-tests, ns: not significant, *p < 0.05. Data in (D-I) analyzed by two-way ANOVA, main effect of miR-1 KO shown. (J) Whole-body oxygen consumption (VO2) and (K) Respiratory exchange ratio (RER) via indirect calorimetry. Data are mean ± SEM, n=5 female mice per group (post-tamoxifen treatment and an 8-week washout). Data analyzed using a two-way ANOVA for light and dark cycles separately.
Figure 4.
Figure 4.. Mitochondrial proteomics and skeletal muscle metabolomic profiling of miR-1 KO skeletal muscle.
(A) Ratio of mitochondrial protein to total protein abundance across samples, referred to as Mitochondrial Enrichment Factor (MEF). (B) Quantification of the OXPHOS protein complexes generated by the summed abundance of all subunits within a given complex. Data are presented as a percentage of the max for each complex. (C) Volcano plot depicting changes in the skeletal muscle mitochondrial proteome. Red color indicates significance (p < 0.05), and differentially expressed proteins involved in pyruvate metabolism are labeled. Data in (A-C) from n=4 WT and n=4 miR-1 KO female mice (post-tamoxifen treatment and an 8-week washout). (D) Representative Western blot of phosphorylation of Ser 293 on the PDHE1a subunit [p-PDHE1a(Ser293)], total PDHE1a, and corresponding total protein levels in WT and miR-1 KO gastrocnemius muscle lysates. (E) Quantification of p-PDHE1a/total PDHE1a protein levels after densitometric analysis of the levels of each sample normalized to corresponding total protein levels, expressed as a ratio. (F) Quantification of total PDHE1a protein levels after densitometric analysis of the levels of each sample normalized to corresponding total protein levels, expressed as FC. (G) Principal component analysis (PCA) scores plot generated using MetaboAnalyst based on gastrocnemius metabolites in n=4 WT and n=4 miR-1 KO female mice (post-tamoxifen treatment and an 8-week washout). Predictive component (PC) 1 and PC2 can differentiate the WT and miR-1 KO muscle. (H) Summary of altered metabolic pathways analysis with MetaboAnalyst reflecting the impact on the pathway and the level of significance. The colors of dots (varying from yellow to red) indicates the significance of the metabolites in the data, and the size of the dot is positively corelated with the impact of the metabolic pathway. Top 6 pathways labeled. (I) Study design for in vitro studies, created using Biorender.com. (J) miR-1 expression of 4-Hydroxytamoxifen (4-OH TAM)-treated myotubes from WT or miR-1 KO mice (n=3 untreated female mice per group). (K) Extracellular acidification rate (ECAR) trace over time after injection of indicated glycolytic modulators in WT (n=3 female) and miR-1 KO (n=4 female)-derived myotubes. Oligo: oligomycin, 2-DG: 2-deoxy-D-glucose. (L) Quantification of basal ECAR (before Oligo addition), and (M) maximal ECAR (after Oligo addition). (N) Pkm mRNA expression of WT and miR-1 KO myotubes. Data in (E-F, J, L-N) analyzed using independent t-tests. *p < 0.05, **p < 0.01, ****p < 0.0001.
Figure 5.
Figure 5.. Effect of miR-1 loss on swimming activity in C. elegans and voluntary wheel running in mice.
(A) Schematic of C. elegans swimming protocol. (B-C) CeLeST analysis of (B) wave initiation rate and (C) activity index in Untrained N2 (WT) (n=32) and mir-1 mutant worms (n=35). (D-E) CeLeST analysis of (D) wave initiation rate and (E) activity index in Untrained (dark circle) or Exercised (open circle) N2 (n=32 and n=36, respectively), and Untrained (dark square) and Exercised (open square) mir-1 mutant worms (n=35 and n=36, respectively). (F) Pdhk-2 mRNA expression in Untrained and Exercised N2 and mir-1 mutant mice (n=4 per group), analyzed by qPCR. (G-H) ClockLab analyses of 4 weeks of voluntary wheel running. Average (G) daily running volume (km/day) and (H) maximum running bout (sec). Data in (G-H) from n=5 female mice per group (post-tamoxifen treatment and a 4-week washout). Data in (B-C, G-H) analyzed using independent t-tests, and data in (D-F) analyzed using multiple t-tests. Ns: not significant, *p < 0.05, **p < 0.01, ****p < 0.0001.
Figure 6.
Figure 6.. miR-1 down-regulation during MOV-induced muscle hypertrophy.
(A) Venn diagram comparing significantly up-regulated genes in miR-1 KO compared to WT (“miR-1 KO up”), significantly up-regulated genes following 3 days of synergist ablation-induced MOV compared to sham (“MOV up”), and eCLIP-seq-defined miR-1 targets (CLIP target). Consensus genes listed. Venn diagram generated using https://bioinformatics.psb.ugent.be/webtools/Venn/. (B) Pathway enrichment analysis of consensus genes between “miR-1 KO up” and “MOV up,” top 10 pathways by adj. p-value shown. (C) Outline of human resistance exercise training program and times of biopsy collection (T0: baseline, T1: after the 1st training session, T13: after the 13th training session, T14: after the 14th training session). (D) miR-1 expression in human skeletal muscle biopsies (from n=14 males) at the different time points of the resistance exercise training program. Differences in miR-1 expression at the different time points tested using a repeated-measures ANOVA with Tukey’s multiple comparisons. (E-F) Association between the change (Δ) in miR-1 expression and the Δ PKM1 protein levels at (E) T13 and (F) T14. (G-H) Association between miR-1 expression and PTBP1 mRNA expression at (G) T0 and (H) T13. Associations tested using simple linear regressions, p-values shown. (I) Type II fiber hypertrophy, demonstrated as percent change in Type II fiber CSA from T0 to T14. Participants divided into Low (n=7) and High (n=7) groups based on magnitude of CSA increases. (J) Percent change in miR-1 expression from T0 to T14 in participants in the Low and High fiber hypertrophy groups. Data in (I-J) analyzed using independent t-tests Ns: not significant, *p < 0.05, **p < 0.01, ***p < 0.0001.
Figure 7.
Figure 7.. Summary of the effect of miR-1 loss on glycolytic and pentose phosphate enzymes and intermediates.
Glycolytic and pentose phosphate pathway enzymes (ovals) and intermediates depicted. Enzymes up-regulated in miR-1 KO RNA-seq or mitochondrial proteomics indicated by green color, and inactivated enzymes indicated by red color. Up-regulated metabolites in miR-1 KO metabolomics indicated by bolded green text. Green plus sign indicates positive regulation. Target symbol indicates eCLIP-seq-defined miR-1 target. Created using Biorender.com.

References

    1. Janssen I., et al. Skeletal muscle mass and distribution in 468 men and women aged 18–88 yr. J Appl Physiol (1985), 2000. 89(1): p. 81–8. - PubMed
    1. Frontera W.R. and Ochala J., Skeletal muscle: a brief review of structure and function. Calcif Tissue Int, 2015. 96(3): p. 183–95. - PubMed
    1. Ali S. and Garcia J.M., Sarcopenia, cachexia and aging: diagnosis, mechanisms and therapeutic options - a mini-review. Gerontology, 2014. 60(4): p. 294–305. - PMC - PubMed
    1. Merz K.E. and Thurmond D.C., Role of Skeletal Muscle in Insulin Resistance and Glucose Uptake. Compr Physiol, 2020. 10(3): p. 785–809. - PMC - PubMed
    1. Wightman B., Ha I., and Ruvkun G., Posttranscriptional regulation of the heterochronic gene lin-14 by lin-4 mediates temporal pattern formation in C. elegans. Cell, 1993. 75(5): p. 855–62. - PubMed

Publication types