[Preprint]. 2024 Aug 13:2024.08.05.606704.
doi: 10.1101/2024.08.05.606704.

Mfn2 induces NCLX-mediated calcium release from mitochondria

Affiliations

Mfn2 induces NCLX-mediated calcium release from mitochondria

Panagiota Kolitsida et al. bioRxiv. .

Abstract

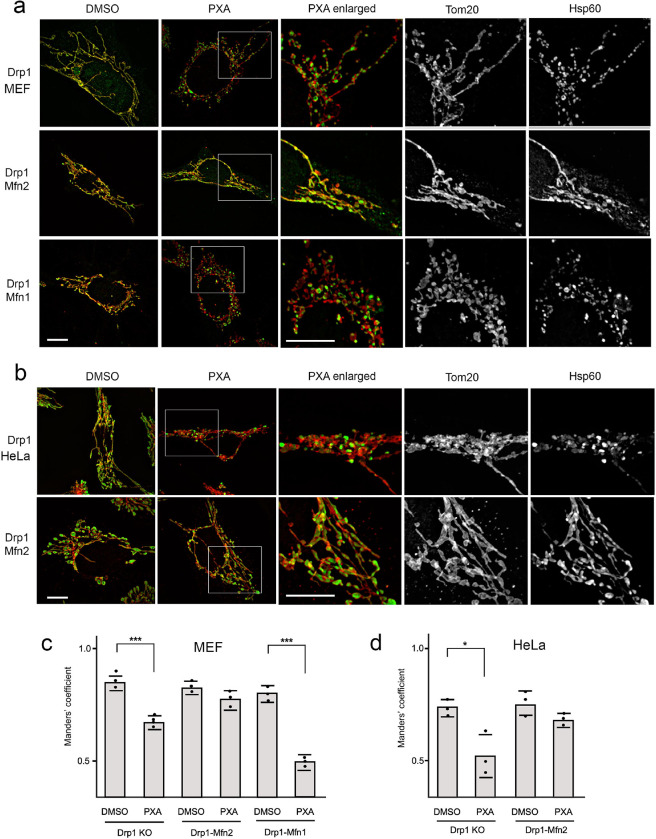
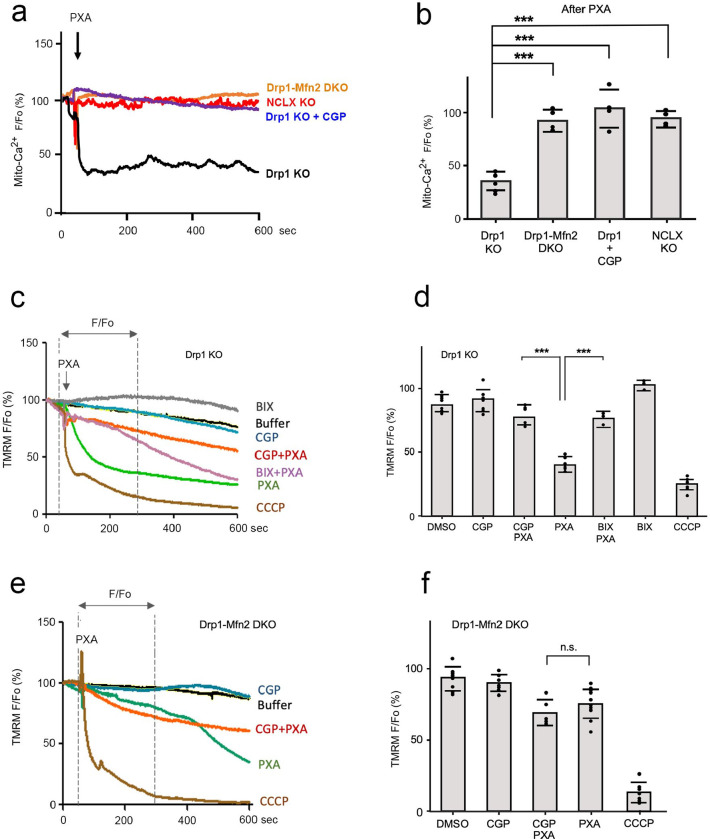
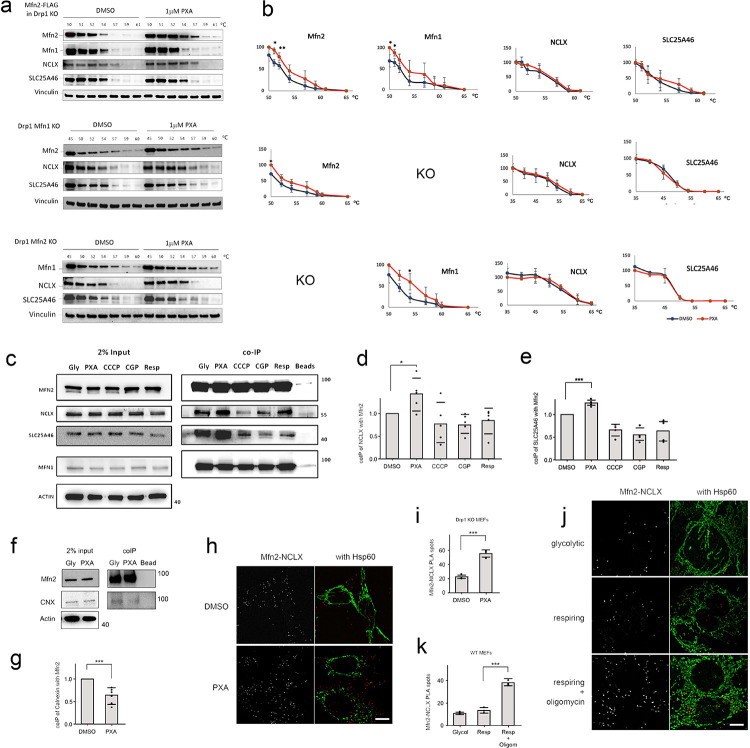
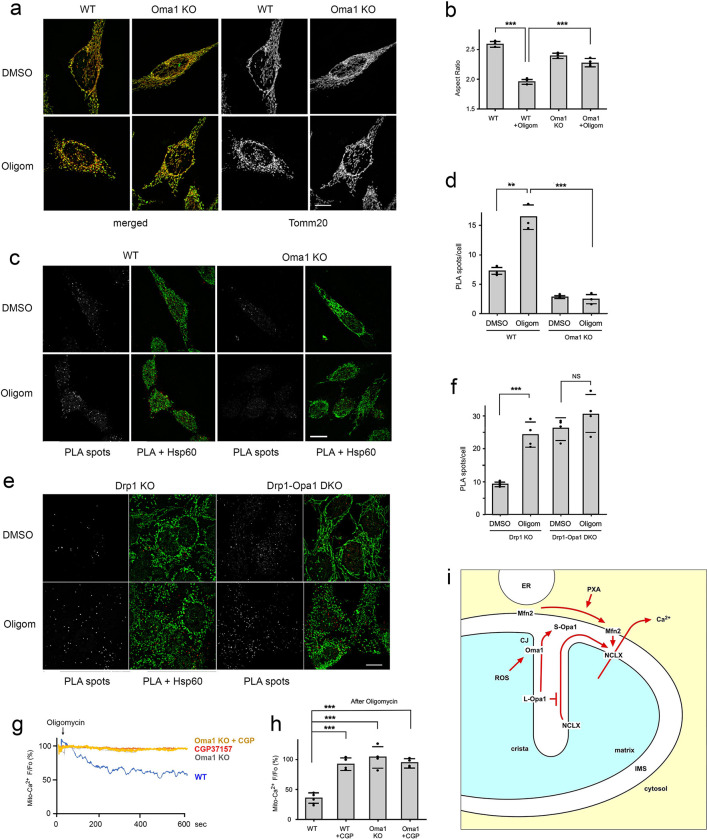
Mfn2 is a mitochondrial outer membrane fusion protein with the additional role of tethering mitochondria to the ER. Here, we describe a novel connection between Mfn2 and calcium release from mitochondria. We show that Mfn2 controls the mitochondrial inner membrane sodium-calcium exchange protein NCLX, which is a major source for calcium release from mitochondria. This discovery was made with the fungal toxin Phomoxanthone (PXA), which induces calcium release from mitochondria. PXA-induced calcium release is blocked by a chemical inhibitor of NCLX, while NCLX and Mfn2 deletions both also prevent PXA-induced calcium release. CETSA experiments show that PXA directly targets Mfn2, which likely controls NCLX through physical interactions since co-immunoprecipitation and proximity ligation assays show increased association between Mfn2 and NCLX upon treatment with PXA. Interactions between Mfn2 and NCLX also increase when cells are treated with mitochondrial ROS-inducing conditions, such as oligomycin treatment of respiring cells, while the interactions do not increase in Oma1 -/- cells. It seems likely that opening of cristae by Oma1-mediated cleavage of Opa1 promotes translocation of NCLX from cristae to the rim where it can come into contact with Mfn2 thus promoting PXA-induced calcium release from mitochondria. These results therefore delineate a pathway that connects ROS produced inside mitochondria with calcium release and signaling in the cytosol.


Figures

Fig. 1.
Fig. 1.. PXA induced morphological effects on mitochondria are controlled by Mitofusins.
(a) MEFs with the indicated genotypes were treated with DMSO or 10uM PXA for 30 min at 37 °C and labeled with Tom20 (red) and Hsp60 (green) antibodies for immunofluorescence. PXA induces contraction of the mitochondrial matrix in Drp1 KO cells, but these contractions are suppressed in Drp1-Mfn2 DKO cells. Drp1-Mfn1 DKO cells show the opposite effect. There contractions are enhanced to the point that outer membrane fission also occurred. The boxed areas in PXA images cells were enlarged to show these changes more clearly. Scale bar is 10 μm. (b) Similar effects were observed with Drp1 KO and Drp1-Mfn2 DKO HeLa cells. (c, d) Manders’ coefficients of Tom20 and Hsp60 colocalization were used to quantify the matrix contractions. The averages (with SD) for three independent experiments in which 50 images were analyzed for each condition show significantly reduced Manders’ coefficients in PXA-treated Drp1 KO and Drp1-Mfn1 DKO cells, but not in Drp1-Mfn2 DKO cells.
Fig. 2.
Fig. 2.. Mfn2 regulates mitochondrial calcium efflux and membrane potential through NCLX.
(a) Tracings of mitochondrial matrix Ca2+ in Hela cells obtained with the Ca2+ sensitive fluorescent probe matrix3mt-R-CEPIA. Drp1 KO, Drp1-Mfn2 DKO, Drp1-NCLX DKO cells were recorded, as well as Drp1 KO cells that were pre-incubated for 30 min at 37°C with 10uM CGP37157. Baselines (Fo) were established with 60 sec tracings in HBSS media and then Ca2+ release was induced by perfusion with 10uM PXA in HBSS followed by 600 sec of further recording. (b) Changes in mitochondrial Ca2+ levels reflected by the relative fluorescence (F/Fo) at 600 sec. Averages are shown with SD for the data points in the histogram and significance was determined with a Student’s T test. (c) Effects of PXA on mitochondrial membrane potential (ΔΨ) determined with Drp1 KO HeLa cells loaded with 25 nM TMRM. Where indicated, cells were preincubated for 30 min with 100 nm BIX (NHE1 inhibitor) or 10uM CGP37157 (NCLX inhibitor). Baselines and tracings after perfusion with or without 10uM PXA were obtained as in panel a. Perfusion with 10uM CCCP was used as control for dissipation of ΔΨ. (d) Averages of F/Fo determined at 300sec after perfusion with SD for the data points in the histogram and significance was determined with a Student’s T test. (e, f) Tracings and histograms of TMRM fluorescence obtained as for panel c and d, but with Drp1-Mfn2 DKO cells instead of Drp1 KO cells.
Fig. 3.
Fig. 3.. PXA targets Mitofusins and that targeting induces interactions between Mfn2 and NCLX.
(a) CETSA of dodecyl maltoside extracts from Drp1-Mfn2 DKO + Mfn2-FLAG, Drp1-Mfn1 DKO and Drp1-Mfn2 DKO MEFs. These extracts were incubated with DMSO or 1uM PXA and subjected to heat denaturation for 3 min at the indicated temperatures, followed by removal of denatured proteins by centrifugation and blot analysis of the supernatants with antibodies against Mfn2, Mfn1, NCLX and SLC25A46, as well as Vinculin as control. The upper panel was made with Drp1-Mfn2 DKO cells that stably express exogenous Mfn2-FLAG, while the lower two sets of blots were made with endogenous proteins. (b) Band intensities determined with densitometric scans of blots as shown in panel a. The intensities were normalized to 45 or 50°C. The points are averages with SD from 3 independent experiments. (c) Co-immunoprecipitation (coIP) of endogenous NCLX and SLC25A46 with Mfn2-FLAG using FLAG antibody attached to beads. Cells were grown under glycolytic conditions (Gly) and treated for 30 min with DSMO, 10 μM PXA, 10 μM CCCP or 10 μM CGP37157, or grown under respiring conditions (galactose). These cells were incubated with DSP cross-linker and subjected to coIP, followed by Western blot analysis. Actin was used as a loading control. (d) Densitometry of the coIPs, normalized to the levels of Mfn2 for each condition. Averages of 5 independent experiments are shown with SD and results of a Student’s T test. (e) Densitometry of SLC25A46 coIPs as described for NCLX in panel d. (f) CoIP of Calnexin with Mfn2-FLAG after treatment with PXA under glycolytic conditions as described in panel c. (g) Densitometry of Calnexin coIP with Mfn2-FLAG as in panels d and e. (h) PLA of Mfn2-myc and NCLX-HA (red spots) in glycolytic Drp1 KO MEFs treated with DMSO or PXA. Mitochondria were detected by immunofluorescence with a chicken antibody against Hsp60 (green). The size marker is 10 μm. (i) Average numbers of PLA spots per cell from 3 independent experiments with SD and results of a Student’s T test. PLA spots in 35 cells were counted for each experiment. (j) PLA of Mfn2-myc and NCLX-HA (red spots) in glycolytic or respiring Drp1 KO MEFs treated with DMSO or oligomycin as indicated. (k) Average numbers of PLA spots for these conditions determined as in panel i.
Fig. 4.
Fig. 4.. Oma1 controls Mfn2-NCLX association and calcium release.
(a) Immunofluorescence of WT and Oma1 KO HeLa cells treated for 30 min with DMSO or 10 μM Oligomycin in respiring conditions. Merged images show Tomm20 (red) and Hsp60 (green), while the black and white images show Tomm20 labeling separately. Scale bar is 10 μm. (b) Aspect ratios of mitochondrial outer membranes (Tom20) under the conditions for panel b. Averages are shown for 3 independent experiments with SD and the results of Student’s T tests. Aspect ratios were determined for each condition with mitochondria in 25 cells per experiment. (c) PLA of Mfn2-myc and NCLX-HA (red spots) in WT and Oma1 KO HeLa cells grown under respiring conditions and treated for 30 min with DMSO or 10 μM Oligomycin. Mitochondria were detected by immunofluorescence with a chicken antibody against Hsp60 (green). Scale bar is 10 μm. (d) Average numbers of PLA spots per cells treated with DMSO or Oligomycin from 3 independent experiments with SD and results of a Student’s T test. (e) PLA of Mfn2-myc and NCLX-HA (red spots) in Drp1 KO and Drp1/Opa1DKO MEFs grown as in panel d under respiring conditions and treated for 30 min with DMSO or 10 μM Oligomycin. Mitochondria were detected by immunofluorescence with a chicken antibody against Hsp60 (green). Scale bar is 10 μm. (f) Average numbers of PLA spots per cells treated with DMSO or Oligomycin from 3 independent experiments with SD and results of a Student’s T test. (g) Tracings of mitochondrial matrix Ca2+ in WT and Oma1 KO Hela cells grown under respiring conditions and treated with 10 μM Oligomycin. Where indicated with CGP, cells were pre-incubated for 30 min at 37°C with 10uM CGP37157. (h) Changes in mitochondrial Ca2+ levels reflected by the relative fluorescence (F/Fo) at 600 sec. Averages are shown with SD for the data points in the histogram and significance was determined with a Student’s T test. (i) outline of pathway for PXA and ROS induced association of Mfn2 and NCLX, which connects stress in the mitochondrial matrix to cytoplasmic signaling through mitochondrial Ca2+ release (CJ, Cristae Junction).

References

    1. Alam M.S. 2018. Proximity Ligation Assay (PLA). Curr Protoc Immunol. 123:e58. - PMC - PubMed
    1. Assali E.A., Jones A.E., Veliova M., Acin-Perez R., Taha M., Miller N., Shum M., Oliveira M.F., Las G., Liesa M., Sekler I., and Shirihai O.S.. 2020. NCLX prevents cell death during adrenergic activation of the brown adipose tissue. Nat Commun. 11:3347. - PMC - PubMed
    1. Bernard-Marissal N., van Hameren G., Juneja M., Pellegrino C., Louhivuori L., Bartesaghi L., Rochat C., El Mansour O., Medard J.J., Croisier M., Maclachlan C., Poirot O., Uhlen P., Timmerman V., Tricaud N., Schneider B.L., and Chrast R.. 2019. Altered interplay between endoplasmic reticulum and mitochondria in Charcot-Marie-Tooth type 2A neuropathy. Proc Natl Acad Sci U S A. 116:2328–2337. - PMC - PubMed
    1. Bohler P., Stuhldreier F., Anand R., Kondadi A.K., Schlutermann D., Berleth N., Deitersen J., Wallot-Hieke N., Wu W., Frank M., Niemann H., Wesbuer E., Barbian A., Luyten T., Parys J.B., Weidtkamp-Peters S., Borchardt A., Reichert A.S., Pena-Blanco A., Garcia-Saez A.J., Itskanov S., van der Bliek A.M., Proksch P., Wesselborg S., and Stork B.. 2018. The mycotoxin phomoxanthone A disturbs the form and function of the inner mitochondrial membrane. Cell Death Dis. 9:286. - PMC - PubMed
    1. Chakrabarti R., Fung T.S., Kang T., Elonkirjo P.W., Suomalainen A., Usherwood E.J., and Higgs H.N.. 2022. Mitochondrial dysfunction triggers actin polymerization necessary for rapid glycolytic activation. J Cell Biol. 221. - PMC - PubMed

Publication types

LinkOut - more resources