[Preprint]. 2024 Aug 6:2024.08.03.606493.
doi: 10.1101/2024.08.03.606493.

3D histology reveals that immune response to pancreatic precancers is heterogeneous and depends on global pancreas structure

Affiliations

3D histology reveals that immune response to pancreatic precancers is heterogeneous and depends on global pancreas structure

Ashley L Kiemen et al. bioRxiv. .

Abstract

Pancreatic ductal adenocarcinoma (PDAC) is a highly lethal cancer for which few effective therapies exist. Immunotherapies specifically are ineffective in pancreatic cancer, in part due to its unique stromal and immune microenvironment. Pancreatic intraepithelial neoplasia, or PanIN, is the main precursor lesion to PDAC. Recently it was discovered that PanINs are remarkably abundant in the grossly normal pancreas, suggesting that the vast majority will never progress to cancer. Here, through construction of 48 samples of cm3-sized human pancreas tissue, we profiled the immune microenvironment of 1,476 PanINs in 3D and at single-cell resolution to better understand the early evolution of the pancreatic tumor microenvironment and to determine how inflammation may play a role in cancer progression. We found that bulk pancreatic inflammation strongly correlates to PanIN cell fraction. We found that the immune response around PanINs is highly heterogeneous, with distinct immune hotspots and cold spots that appear and disappear in a span of tens of microns. Immune hotspots generally mark locations of higher grade of dysplasia or locations near acinar atrophy. The immune composition at these hotspots is dominated by naïve, cytotoxic, and regulatory T cells, cancer associated fibroblasts, and tumor associated macrophages, with little similarity to the immune composition around less-inflamed PanINs. By mapping FOXP3+ cells in 3D, we found that regulatory T cells are present at higher density in larger PanIN lesions compared to smaller PanINs, suggesting that the early initiation of PanINs may not exhibit an immunosuppressive response. This analysis demonstrates that while PanINs are common in the pancreases of most individuals, inflammation may play a pivotal role, both at the bulk and the microscopic scale, in demarcating regions of significance in cancer progression.

Keywords: PanIN; Pancreatic cancer; inflammation; precancers; tumor heterogeneity.


Figures
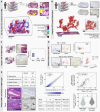
Fig 1.
Fig 1.. Integration of CODA + IHC for mapping the pancreatic immune microenvironment.
(a) Forty-eight samples of cm3-sized human pancreas tissue were reconstructed using CODA to create 3D maps of pancreatic microanatomy. (b) In a subset of cases, intervening sections were stained for CD45 and CD3/FOXP3, enabling integration of immune cells in the 3D pancreas microenvironment. (c) Nonlinear image registration was used to align the multiplex images to the same coordinate space. Target registration error (TRE) demonstrates the quality of the registration. (d) Immune cell coordinates were generated using color deconvolution and a k-medoids algorithm. (e) Top left: table cataloging the number of tissue samples, sections, and PanIN per cohort. Bottom left: sample H&E and CD45-stained histology showing a non-inflamed normal pancreatic duct and an inflamed PanIN. Cell density in the stroma (pink in H&E image) appears to correlate to CD45+ stain. Center: approximation of 3D CD45+ cell density using 3D stromal cell density via five-fold cross-validation of linear, power, and exponential fits, with the best fit achieved using a power law. Top right: graph depicting error in approximation of mean PanIN inflammation using the power law fit. Bottom right: violin plot depicting the mean PanIN inflammation as determined using CD45-stained IHC images from two 3D samples and as determined using H&E images from 46 3D samples.
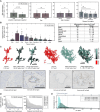
Figure 2.
Figure 2.. PanIN are most inflamed structure in most normal pancreases and feature complex immune patterns.
(a) Samples resected from the pancreatic head were found to be significantly (p = 0.03) more inflamed than samples resected from the pancreatic tail. No significant difference in inflammation found as a function of patient diagnosis, age, or sex. P-values calculated using the Wilcoxon rank sum test. (b) Bar graph depicting the average inflammation present within eight structures of the pancreas. PanIN was found to be the most inflamed, followed by normal pancreatic ducts. Table containing mean and range values. (c) Sample 3D renderings depicting PanIN local immune cell density. Sample histology contains immune “hotspots” and “cold spots” present in these PanINs (d) Quantification of radial immune cell density around the PanINs depicted in c. Grey lines were calculated at each 2D instance of PanIN in the histology. Dashed blue line is the average of the 2D. Solid blue line is the true, 3D radial immune cell density. (e) Quantification of inflammatory heterogeneity. For a PanIN, 1,000 starting points were randomly chosen. Moving across the surface of the PanIN, the distance necessary for inflammation to change 25%, 50%, and 100% was found. On average, inflammation changed 25% within 5 sections (20 μm), 50% within 10 sections (40 μm), and 100% within 19 sections (76 μm).
Figure 3.
Figure 3.. Pancreatic precancer inflammation is a global process.
(a) 3D heatmap renderings of a PanIN depicting local composition of immune cells, and local density of pancreatic structures including stroma, acini, and vasculature. (b) Z-projections of three pancreatic tissue samples showing bulk changes to tissue structure with increasing PanIN content. (c) Table showing r2 values of the correlation between tissue structures and inflammation at the local (150 μm) scale and the bulk (entire cm3 tissue sample) scale. Several structures, including PanIN, stroma, normal ducts, vasculature, acinar lobules, and acinar-to-stromal ratio are highly correlated to inflammation at the bulk scale. (d) Average PanIN inflammation plotted as a function of PanIN volume. No correlation found. (e) Sample visualization of data in c, showing correlation of bulk inflammation to PanIN cellular composition.
Figure 4.
Figure 4.. PanIN immune hotspots feature unique microenvironments.
(a) A 3D rendering of a PanIN with regions of immune hotspots and cold spots. The table contains observed phenomena in the PanIN hotspots and cold spots for all 48 samples, with hotspots containing more high-grade dysplasia, reactive stroma, and acinar to ductal metaplasia (ADM), and cold spots containing more large ductal lumens or dilations. Sample histology provided, arrows indicate the regions of interest. (b) Comparison of the tissue composition in hotspot and cold spot histology revealed more acini, islets, and PanIN in hotspot regions, and more stroma and lumen in cold spot regions. P-values calculated using the Wilcoxon rank sum test. (c) In 3 samples, we identified a WSI containing a PanIN hotspot, another PanIN, and a normal pancreatic duct and applied a 38-plex imaging mass cytometry panel. (d) Quantitative comparison revealed generally higher immune cell densities at the hotspot PanIN. The immune cell densities of the randomly selected PanIN appeared to generally mirror those cell densities of the non-neoplastic duct.
Figure 5.
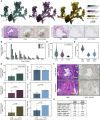
Figure 5.. The composition of T cells around PanIN is heterogeneous.
(a) 3D renderings of the CD45+, CD3+, and FOXP3+ cell density across a PanIN. Sample H&E and IHC histology at locations on the characterized by heavy or light immune infiltration. (b) Bar graph depicting the average CD45+, CD3+, and FOXP3+ cell density present within eight components of the pancreas. (c). Violin plot displaying the CD45+, CD3+, and FOXP3+ cell density at 34 PanIN. (d) Violin plot displaying the CD3 to CD45, FOXP3 to CD45, and FOXP3 to CD3 cell ratios at 34 PanIN. (e) Bar graphs depicting the CD45+, CD3+, and foP3+ cell density, and the CD3 to CD45, FOXP3 to CD45, and FOXP3 to CD3 cell ratios between small (< 0.01 mm3) and large (≥ 0.01 mm3) PanIN. Larger PanIN are in general more inflamed and have higher FOXP3 composition than small PanIN. P-values calculated using the Wilcoxon rank sum test. (f) Sample histology of a small PanIN possessing low FOXP3+ cell composition and a large PanIN possessing large FOXP3+ cell composition. (g) Table containing the immune cell properties of the PanIN shown in the sample histology.

References

    1. Siegel R.L., Miller K.D., Fuchs H.E., and Jemal A. (2021). Cancer Statistics, 2021. CA Cancer J Clin 71, 7–33. 10.3322/caac.21654. - DOI - PubMed
    1. Morton D.L., Eilber F.R., Malmgren R.A., and Wood W.C. (1970). Immunological Factors Which Influence Response to Immunotherapy in Malignant Melanoma. Surgery 68, 158-&. - PubMed
    1. Doroshow D.B., Sanmamed M.F., Hastings K., Politi K., Rimm D.L., Chen L.P., Melero I., Schalper K.A., and Herbst R.S. (2019). Immunotherapy in Non-Small Cell Lung Cancer: Facts and Hopes. Clinical Cancer Research 25, 4592–4602. 10.1158/1078-0432.Ccr-18-1538. - DOI - PMC - PubMed
    1. Herbst R.S., Morgensztern D., and Boshoff C. (2018). The biology and management of non-small cell lung cancer. Nature 553, 446–454. 10.1038/nature25183. - DOI - PubMed
    1. Chen R., Zinzani P.L., Fanale M.A., Armand P., Johnson N.A., Brice P., Radford J., Ribrag V., Molin D., Vassilakopoulos T.P., et al. (2017). Phase II Study of the Efficacy and Safety of Pembrolizumab for Relapsed/Refractory Classic Hodgkin Lymphoma. Journal of Clinical Oncology 35, 2125–+. 10.1200/Jco.2016.72.1316. - DOI - PMC - PubMed

Publication types

LinkOut - more resources