[Preprint]. 2024 Aug 10:2024.08.10.607461.
doi: 10.1101/2024.08.10.607461.

Therapeutic Spp1 silencing in TREM2+ cardiac macrophages suppresses atrial fibrillation

Affiliations

Therapeutic Spp1 silencing in TREM2+ cardiac macrophages suppresses atrial fibrillation

Noor Momin et al. bioRxiv. .

Abstract

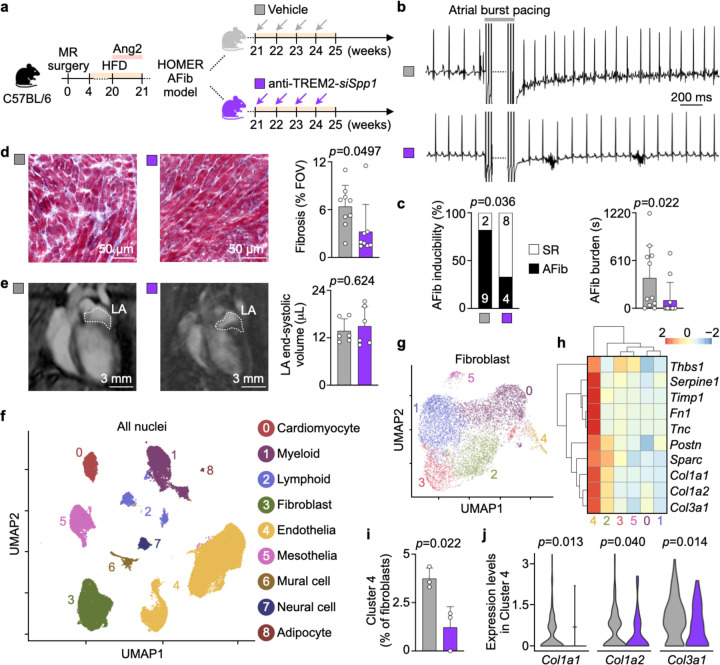
Atrial fibrillation (AFib) and the risk of its lethal complications are propelled by fibrosis, which induces electrical heterogeneity and gives rise to reentry circuits. Atrial TREM2+ macrophages secrete osteopontin (encoded by Spp1), a matricellular signaling protein that engenders fibrosis and AFib. Here we show that silencing Spp1 in TREM2+ cardiac macrophages with an antibody-siRNA conjugate reduces atrial fibrosis and suppresses AFib in mice, thus offering a new immunotherapy for the most common arrhythmia.


Conflict of interest statement

Competing interests: S.S. received speaker fees or honoraria from Astra Zeneca, Novartis, Berlin-Chemie, Daiichi Sankyo, Bristol Myers Squibb, Pfizer, Boehringer Ingelheim, and Lilly. P.T.E. receives sponsored research support from Bayer AG, IBM Research, Bristol Myers Squibb, Pfizer, and Novo Nordisk; he has also served on advisory boards or consulted for Bayer AG. D.G.A is a founder of oRNA Tx, Verseau Tx, Combined Tx, and Souffle Tx. M.N. has received funds or material research support from Alnylam, Biotronik, CSL Behring, GlycoMimetics, GSK, Medtronic, Novartis, and Pfizer, as well as consulting fees from Biogen, Gimv, IFM Therapeutics, Molecular Imaging, Sigilon, Verseau Therapeutics, and Bitterroot. N.M., A.R., I.L., M.J.S., D.G.A., K.N, M.N., and M.H. are inventors on U.S. Provisional Patent applications no. 63/501,286 and 63/525,135 regarding the role of and modulating stromal and immune cells in atrial disease. The other authors declare no competing interests.

Figures

Extended Data Fig. 1 |
Extended Data Fig. 1 |. Dual dose response of predicted siRNA candidates.
a, Predicted siRNA sequences directed against mouse Spp1 (mmSpp1). Gray boxes denote siRNA candidates with predicted cross-reactivity to human SPP1. b,c, The effect of each candidate siRNA in Hepa1-6 cells at 20 nM (b) and 2 nM (c) concentrations on target mmSpp1 expression normalized to mmGapdh expression (top) and absolute mmGapdh expression normalized to mock-transfected cells (bottom). n = 4 to 8 biological replicates per candidate. All bar graph data are mean±s.d. with individual values for data distribution.
Extended Data Fig. 2 |
Extended Data Fig. 2 |. Dose response of top siRNA candidates.
a,b, The effect of siRNA candidates 110, 111, 487, 814, 943, and 1050 in Hepa1-6 cells at different doses on target mmSpp1 expression normalized to mmGapdh expression (a) and absolute mmGapdh expression normalized to mock-transfected cells (b). Data are mean±s.d., n = 4 biological replicates per dose per candidate. c, The silencing potency (IC50) and maximum inhibition (max. inhib.) of top siRNA candidates generated from a sigmoidal dose-response curve fit.
Extended Data Fig. 3 |
Extended Data Fig. 3 |. Binding and internalization of anti-TREM2.
a, Antibody binding of AF647-conjugated anti-TREM2 in RAW264.7 macrophages by flow cytometry. Expi293 cells lacking TREM2 expression served as negative control cells, while commercially available TREM2-APC antibody served as a positive control antibody. b, RAW264.7 macrophages exposed to AF488-conjugated anti-TREM2 for 0, 0.5, 1, 3, and 5 hours with or without exposure to the anti-AF488 fluorescence quenching antibody. c, MFI quantification attributed to cell surface-binding antibody, cell internalized antibody, and total antibody signal. d, Linear fit of the internalization rate using measurements of the internalized fraction of antibody versus the surface integral over time.
Extended Data Fig. 4 |
Extended Data Fig. 4 |. Antibody and siRNA conjugation.
a, Method for functionalizing the anti-TREM2 antibody with MeTz-Peg4-NHS. b, Method for functionalizing the 3’ end of the siRNA sense strand with a TCO-Peg4-NHS moiety. fN = 2’-fluoro nucleotides; n = 2’-O-methyl nucleotides; vinU = 5’-E-VP uridine; red bars = phosphorothioate linkages. c, Click chemistry reaction scheme for conjugating the MeTz groups on the antibody with TCO-tagged siRNAs to form antibody-siRNA conjugates (ARCs). d, Size exclusion chromatography purification of ARC based on 280 nm absorbance. e, Representative size exclusion chromatography with multi-angle light scattering (SEC-MALS) of anti-TREM2 and anti-TREM2-siSpp1 from two independent experiments. The protein concentration in the antibody sample or the conjugate was estimated from the differential refractive index increments (dn/dc), and the molecular mass was determined from the multi-angle light scattering (DLS) detector responses. f, Analysis of SEC-MALS to determine the siRNA drug-to-antibody conjugate ratio.
Extended Data Fig. 5 |
Extended Data Fig. 5 |. TREM2 expression on cardiac cells.
a, Experimental outline of C57BL/6 mice infused with saline or Ang2 via minipumps for 28 days. b, Representative flow cytometry gating strategies to identify cell subsets in heart tissue from saline- and Ang2-treated mice. c, Enumeration of MHCIIhi and MHCIIlo macrophages in hearts from saline- and Ang2-treated mice by flow cytometry. Data are mean±s.d. with individual values for data distribution, n = 8 to 9 per group from two independent experiments, two-tailed Student’s t-test. d, Flow cytometry quantification of TREM2 on lymphocytes, neutrophils, MHCIIlo macrophages, MHCIIhi macrophages, endothelial cells, and fibroblasts in hearts from saline- and Ang2-treated mice.
Extended Data Fig. 6 |
Extended Data Fig. 6 |. ARC silencing half-life is 6 days.
a, Experimental outline of C57BL/6 mice infused with Ang2 via minipumps for 28 days followed by treatment with vehicle or anti-TREM2-siSpp1 at 1.5 mg siRNA/kg body weight total dose equally divided between days 6 and 9. Hearts were excised either on day 12 or day 15. b, Spp1 expression in TREM2hi (left) and TREM2lo (right) cardiac macrophages isolated on day 12 or 15 from anti-TREM2-siSpp1-treated hypertensive mice normalized to vehicle-treated hypertensive mice. Data are mean±s.d. with individual values for data distribution, n = 3 to 12 per group from four independent experiments, one-way ANOVA followed by Tukey’s multiple comparisons test.
Extended Data Fig. 7 |
Extended Data Fig. 7 |. Contractility of ARC-treated human myocardium.
a, Representative contraction traces of human myocardial slices 48 hours after treatment with either anti-TREM2-siSpp1 or vehicle control. b, Quantification of contraction amplitude, time-to-peak 80% and relaxation time 80% of human myocardial slices treated with either anti-TREM2-siSpp1 or vehicle control. n = 6 heart slices. c,d, Representative contraction traces (c) and contraction amplitudes (d) of vehicle- and anti-TREM2-siSpp1-treated myocardial slices during increasing stimulation rates (0.5, 1, and 2 Hz) testing the force-frequency relationship. n = 5 to 6 heart slices. e,f, Representative contractility traces (e) and post-rest ratios (f) of vehicle- and anti-TREM2-siSpp1-treated myocardial slices during stimulation pauses (10 s and 30 s) as a surrogate for sarcoplasmic reticulum function. n = 6 heart slices. Data are mean±s.d. with individual values for data distribution.
Extended Data Fig. 8 |
Extended Data Fig. 8 |. Liver histological features of treated HOMER mice.
a, Representative H&E images of livers from vehicle- and anti-Trem2-Spp1-treated HOMER mice. Scale bars, 300 µm. b, Summary of histological features observed in liver sections from vehicle- and anti-Trem2-Spp1-treated HOMER mice. n = 15 to 16 per group from two independent experiments, Two-sided Fisher’s exact test. Scoring description: 0 = non; +/− = focal, minimal; 1 = mild; 2 = mild-moderate; 3 = moderate; 4 = severe.
Extended Data Fig. 9 |
Extended Data Fig. 9 |. Annotating mouse left atrial nuclei.
a, Clustering of 48,647 nuclei from left atrial tissues of three vehicle- and three anti-Trem2-Spp1-treated HOMER mice. b, Dot plot annotating nuclei clusters by signature gene expression. Color denotes z-score of average gene expression (red: high; blue: low); circle size indicates percentage of cells expressing the gene. c, Cd44 expression levels in the 6 fibroblast clusters from three vehicle- and three anti-Trem2-siSpp1-treated HOMER mice.
Fig. 1 |
Fig. 1 |. ARC silences Spp1 in TREM2+ macrophages
a, Uniform manifold approximation and projection (UMAP) of deposited human scRNA-seq data derived from atrial appendages of five controls and seven patients with AFib highlighting co-expression of SPP1 and TREM2. The major cell clusters identified were mononuclear phagocytes (M), neutrophils (N), lymphocytes (L), fibroblasts (F), endothelial cells (E), and mural cells (V). b, UMAP of deposited murine scRNA-seq data derived from left atria of four sham and four HOMER AFib mice highlighting co-expression of Spp1 and Trem2. c, Schematic of a TREM2 antibody bearing an inert IgG2c Fc with LALAPG mutations (anti-TREM2) fused to siRNAs directed against Spp1 (siSpp1). d, Experimental outline to assess the organ and cellular biodistribution of fluorescently labeled isotype control antibody, anti-TREM2, and anti-TREM2-siSpp1 injected intravenously. e, Representative fluorescence images of heart, liver lobe, spleen, and kidney. Scale bars, 5 mm. f, Quantification of mean organ fluorescence in heart’s left atria (LA) and left ventricle (LV), liver lobe, spleen, and kidney normalized to vehicle-treated control. n = 4 per group from two independent experiments, one-way ANOVA followed by Tukey’s multiple comparisons test. g, Median fluorescence intensity histograms of internalized isotype control antibody, anti-TREM2, and anti-TREM2-siSpp1 in cardiac lymphocytes (lympho), MHCIIlo macrophages (MHCIIlo Mφ), MHCIIhi macrophages (MHCIIhi Mφ), endothelial cells (EC), and fibroblasts. h, Percentage of total cardiac MHCIIlo and MHCIIhi macrophages with internalized fluorescence. n = 4 to 7 per group from two independent experiments, one-way ANOVA followed by Tukey’s multiple comparisons test. i, Experimental outline to differentiate bone-marrow-derived macrophages (BMDM) from wild-type (WT) C57BL/6 mice and Trem2−/− mice. j,k, Quantification of Spp1 mRNA (j) and protein (k) expression in WT (left) and Trem2−/− (right) BMDM normalized to vehicle-treated control. n = 8 to 16 per group from three independent experiments, one-way ANOVA followed by Tukey’s multiple comparisons test. l, Experimental outline of C57BL/6 mice undergoing chronic hypertension for 28 days followed by treatment with vehicle or anti-TREM2-siSpp1 on days 6 and 9. m, Expression of Spp1 mRNA in TREM2hi (left) and TREM2lo (right) cardiac macrophage subsets isolated on day 12 normalized to vehicle-treated cells. n = 5 to 12 per group from four independent experiments, one-way ANOVA followed by Tukey’s multiple comparisons test. n, Experimental outline for testing anti-TREM2-siSpp1 in beating human cardiac tissue. o, In situ staining of SPP1 and CD68 mRNA on human ventricular tissue; arrowheads indicate SPP1+ CD68+ macrophages. p, Quantification of CD68+ macrophages/mm2 with different expression levels of SPP1 in vehicle- and anti-TREM2-siSpp1-treated human ventricular tissues. Vehicle: n = 23 field of views (FOV) from three heart slices; anti-TREM2-siSpp1: n = 25 FOV from three heart slices; nested t-test. All bar graph data are mean±s.d. with individual values for data distribution.
Fig. 2 |
Fig. 2 |. ARC therapy suppresses AFib by reducing atrial fibrosis.
a, Experimental outline to treat HOMER mice with established atrial pathology arising from hypertension (angiotensin 2 – Ang2), obesity (high-fat diet – HFD) and mitral valve regurgitation (MR) with weekly intravenous injections of vehicle or anti-TREM2-siSpp1 for one month. b, Representative ECG recordings from a cardiac electrophysiological (EP) study of vehicle- and anti-TREM2-siSpp1-treated HOMER mice at week 25. Scale bar, 200 ms. c, EP study of AFib inducibility and burden in vehicle- and anti-TREM2-siSpp1-treated HOMER mice. n = 11 to 12 per group from two independent experiments. (Left) Two-sided Fisher’s exact test. (Right) Two-tailed Mann–Whitney test. d, Representative images (left) and quantification (right) of fibrosis (Masson’s trichrome staining) in left atrial tissue from vehicle- and anti-TREM2-siSpp1-treated HOMER mice. n = 8 to 9 per group from two independent experiments, two-tailed Student’s t-test. Scale bars, 50 µm. e, Representative cardiac MRI images (left) and left atrial (LA) end-systolic volumes (right) of vehicle- and anti-TREM2-siSpp1-treated HOMER mice. n = 6 per group from two independent experiments, two-tailed Mann–Whitney test. Scale bars, 3 mm. f, UMAP delineates 9 major cardiac cell types in three vehicle- and three anti-Trem2-siSpp1-treated HOMER mice. Cell identities were inferred from known marker gene expression. g, UMAP plot of left atrial fibroblasts in three vehicle- and three anti-Trem2-siSpp1-treated HOMER mice. h, Heatmap and hierarchical clustering of the 6 fibroblast clusters according to the gene expression levels of fibrosis-related genes (represented by z-scores of the average normalized counts). i, Fraction of pro-fibrotic fibroblasts (cluster 4) in three vehicle- and three anti-Trem2-siSpp1-treated HOMER mice. Two-tailed Student’s t-test. j, Expression levels of collagen genes in pro-fibrotic fibroblasts (cluster 4) of three vehicle- and three anti-Trem2-siSpp1-treated HOMER mice. Kolmogorov-Smirnov test. All bar graph data are mean±s.d. with individual values for data distribution.

References

    1. Kornej J., Börschel C. S., Benjamin E. J. & Schnabel R. B. Epidemiology of Atrial Fibrillation in the 21st Century: Novel Methods and New Insights. Circ Res 127, 4–20 (2020). - PMC - PubMed
    1. Michaud G. F. & Stevenson W. G. Atrial Fibrillation. N Engl J Med 384, 353–361 (2021). - PubMed
    1. Dobrev D., Heijman J., Hiram R., Li N. & Nattel S. Inflammatory signalling in atrial cardiomyocytes: a novel unifying principle in atrial fibrillation pathophysiology. Nat Rev Cardiol 20, 145–167 (2023). - PMC - PubMed
    1. Hulsmans M. et al. Recruited macrophages elicit atrial fibrillation. Science 381, 231–239 (2023). - PMC - PubMed
    1. Lund S. A., Giachelli C. M. & Scatena M. The role of osteopontin in inflammatory processes. J Cell Commun Signal 3, 311–322 (2009). - PMC - PubMed

Publication types