[Preprint]. 2024 Aug 12:2024.08.09.607355.
doi: 10.1101/2024.08.09.607355.

Productive mRNA Chromatin Escape is Promoted by PRMT5 Methylation of SNRPB

Affiliations

Productive mRNA Chromatin Escape is Promoted by PRMT5 Methylation of SNRPB

Joseph D DeAngelo et al. bioRxiv. .

Update in

  • Productive mRNA chromatin escape is promoted by PRMT5 activity.
    DeAngelo JD, Maron MI, Roth JS, Hegde S, Silverstein AM, Gupta V, Stransky S, Basken J, Azofeifa J, Query CC, Sidoli S, Gamble MJ, Shechter D. DeAngelo JD, et al. Mol Cell. 2025 Nov 6;85(21):4016-4031.e9. doi: 10.1016/j.molcel.2025.09.021. Epub 2025 Oct 13. Mol Cell. 2025. PMID: 41086806

Abstract

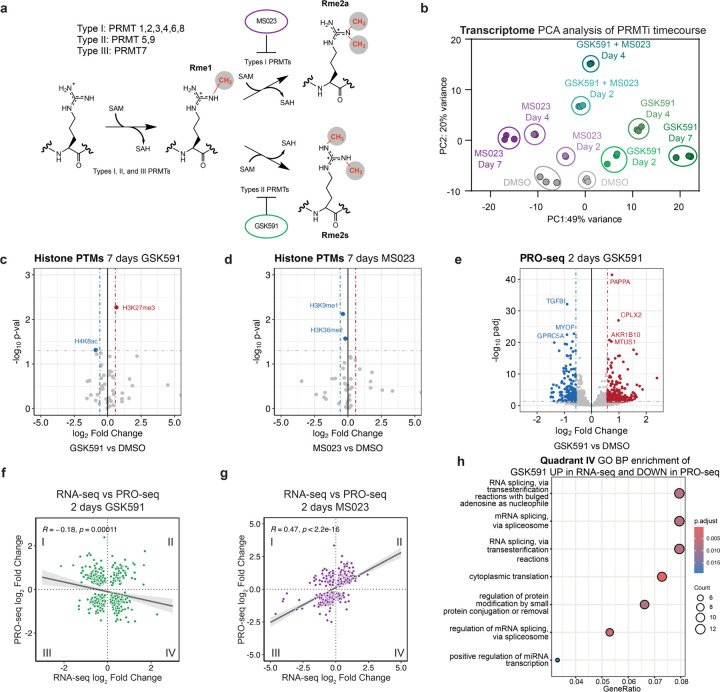
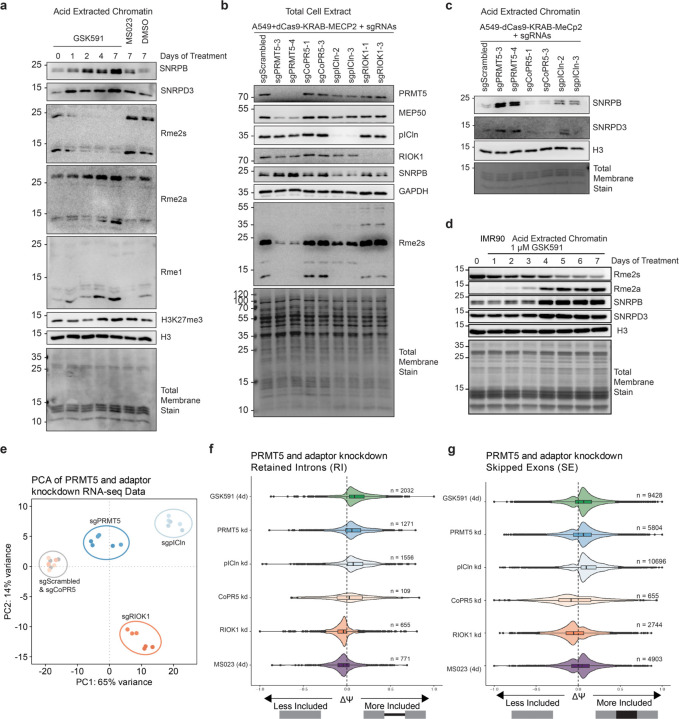
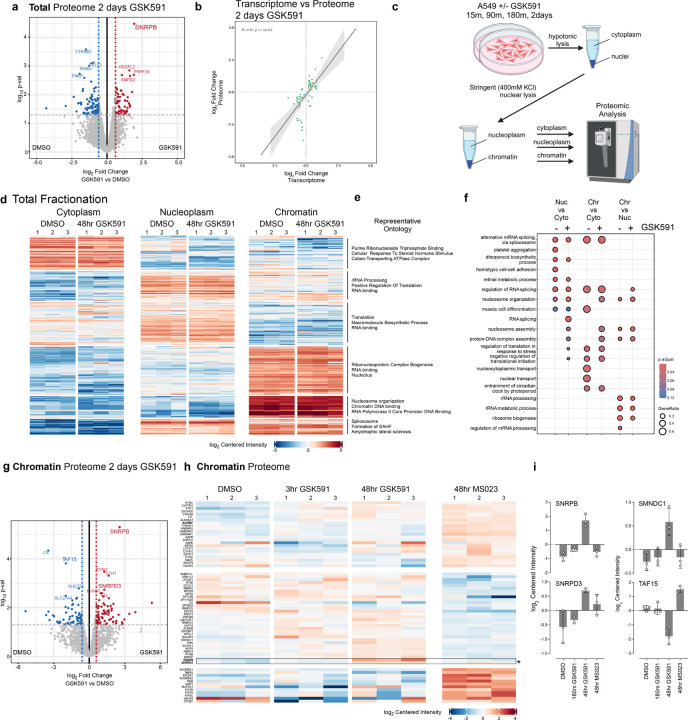
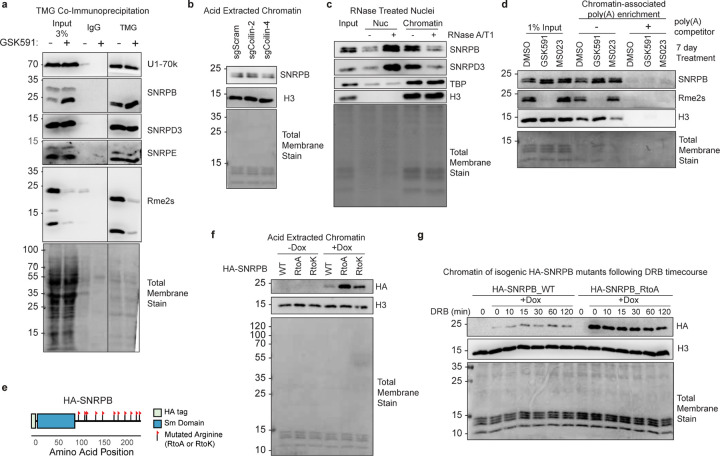
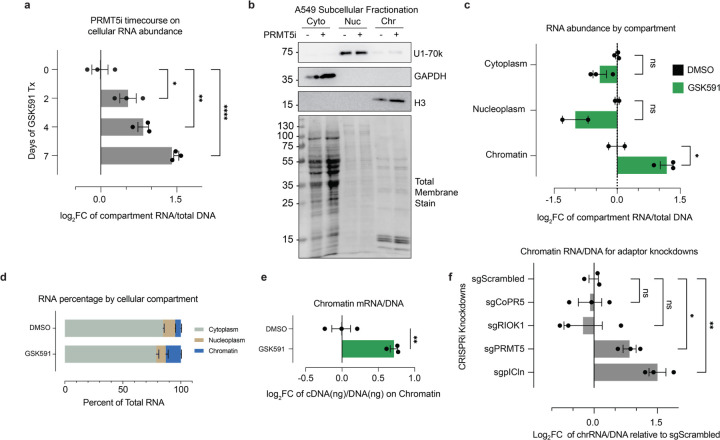
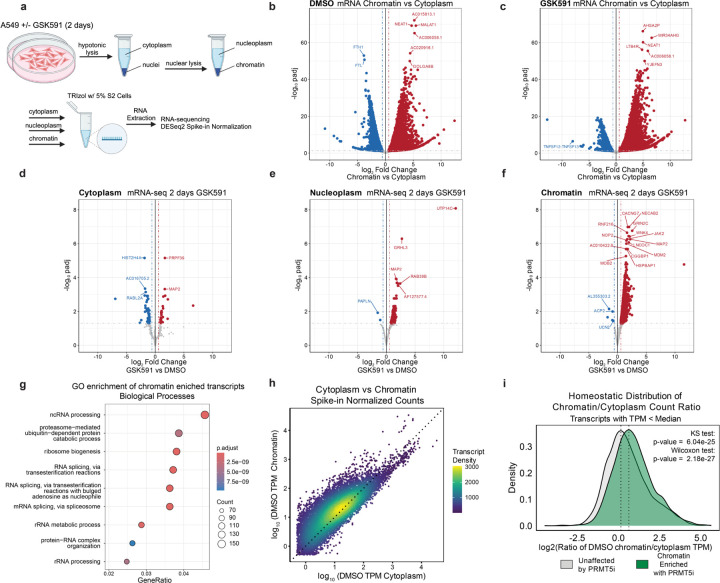
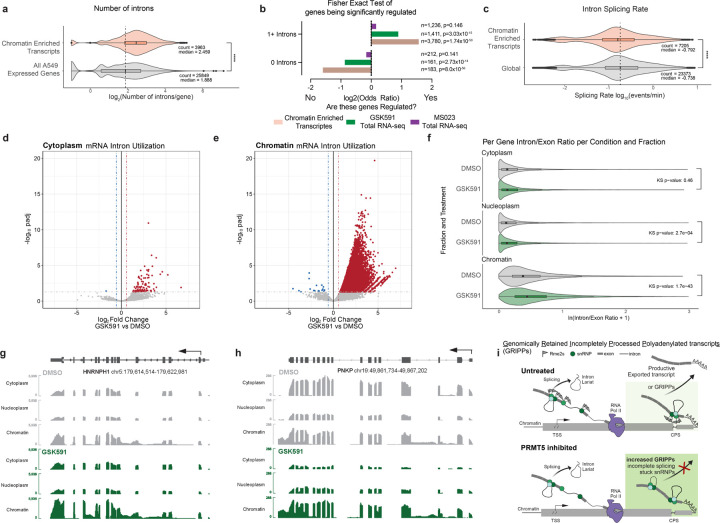
Protein Arginine Methyltransferase 5 (PRMT5) regulates RNA splicing and transcription by symmetric dimethylation of arginine residues (Rme2s/SDMA) in many RNA binding proteins. However, the mechanism by which PRMT5 couples splicing to transcriptional output is unknown. Here, we demonstrate that a major function of PRMT5 activity is to promote chromatin escape of a novel, large class of mRNAs that we term Genomically Retained Incompletely Processed Polyadenylated Transcripts (GRIPPs). Using nascent and total transcriptomics, spike-in controlled fractionated cell transcriptomics, and total and fractionated cell proteomics, we show that PRMT5 inhibition and knockdown of the PRMT5 SNRP (Sm protein) adapter protein pICln (CLNS1A) -but not type I PRMT inhibition-leads to gross detention of mRNA, SNRPB, and SNRPD3 proteins on chromatin. Compared to most transcripts, these chromatin-trapped polyadenylated RNA transcripts have more introns, are spliced slower, and are enriched in detained introns. Using a combination of PRMT5 inhibition and inducible isogenic wildtype and arginine-mutant SNRPB, we show that arginine methylation of these snRNPs is critical for mediating their homeostatic chromatin and RNA interactions. Overall, we conclude that a major role for PRMT5 is in controlling transcript processing and splicing completion to promote chromatin escape and subsequent nuclear export.

Keywords: Arginine Methylation; Arginine Methyltransferase; PRMT1; PRMT5; Post-Translational Modifications; Splicing; Transcription; mRNA Processing.


Conflict of interest statement

Conflict of Interest The authors declare that they have no conflicts of interest with the contents of this article. The content is solely the responsibility of the authors and does not necessarily represent the official views of the National Institutes of Health. J.B. was an employee of Arpeggio Bio, and J.A. is an employee and founder of Arpeggio Bio, which was contracted to undertake the PRO-seq experiments described in this paper.

Figures

Figure 1.
Figure 1.. PRMT5 inhibition results in gross transcriptome rearrangements.
a) Overview of arginine methyltransferases and their methylation reactions. b) PCA clustering analysis for an RNA-seq time course of Type I (MS023) and Type II (GSK591) inhibition. c-d) Volcano plots of histone PTM proteomics following 7 days of either GSK591 or MS023 treatment. Horizontal lines correspond to a 0.05 padj cutoff and vertical lines to a 0.58 log2 Fold Change. e) Volcano plot of nascent Pro-seq after two days of GSK591 treatment, relative to DMSO control. Horizontal lines correspond to a 0.05 padj cutoff and vertical lines to a 0.58 log2 Fold Change. f-g) Linear correlations of transcripts significantly called (padj<0.05) in both RNA-seq and PRO-seq experiments for either two days of GSK591 or MS023 treatment. h) Dot plot of biological function gene ontology for transcripts upregulated two days GSK591 RNA-seq and downregulated in Pro-seq (Quadrant IV of Figure 1h). Size of the dots corresponds to the number of genes in each category and color is representative of the group’s p-value.
Figure 2.
Figure 2.. PRMT5-pICln dependent methylation of SNRPB is required for chromatin accumulation.
a) Immunoblot of acid extracted chromatin over a time course of PRMT5 inhibition by GSK591. DMSO and MS023 controls are also present. b) Immunoblot of total cell extract of A549_dCas9-KRAB-MECP2 cells transduced with various sgRNAs. c) Immunoblot analysis of acid extracted chromatin of A549_dCas9-KRAB-MECP2 cells transduced with various sgRNAs. d) Immunoblot of IMR90-hTert cells over a time course of PRMT5 inhibition. e) PCA analysis of RNA-sequencing of PRMT5 and adaptor protein knockdowns. f) Comparison of ΔΨ (Delta PSI / Percent Spliced In) of retained introns (RI) following PRMT5 and adaptor protein knockdowns. g) Comparison of ΔΨ (Delta PSI) of skipped exons (SE) following PRMT5 and adaptor protein knockdowns.
Figure 3.
Figure 3.. Fractionated proteomics reveal that SNPRB accumulation on chromatin is the major proteomic consequence of PRMT5 inhibition.
a) Volcano plot of total cell proteome following two days of GSK591 inhibition. Highlighted proteins are those above a p-value>0.05 and an absolute log2 fold change >0.58. b) Linear correlation of shared genes from total RNA-sequencing and proteomics (with a padj <0.05 cutoff) following two days of PRMT5 inhibition. c) Schematic of cellular fractionation approach. d-e) Heatmap and representative ontology for each cellular fraction and treatment. Color corresponds to a log2 of centered intensity. f) Dot plot highlighting ontology of biological function of proteins in each cellular compartment. Size of dot corresponds to gene ratio and color to the adjusted p-value. g) Volcano plot of mass-spec log2 Fold change vs log10 pval of the chromatin fraction following GSK591 treatment. h) Heatmap comparing changes in the chromatin proteome. Block color is representative of log2 centered intensity. i) Selected histograms of chromatin associated proteins and their centered intensity across different drug treatments.
Figure 4.
Figure 4.. Unmethylated SNRPB chromatin accumulation is dependent on post-transcriptional mRNAs.
a) Co-immunoprecipitation of TMG followed western blotting for Sm proteins and mature snRNP components. b) Immunoblots of acid extracted chromatin following Coilin CRISPRi knockdowns. c) Immunoblots of nucleoplasm and chromatin fractions after nuclei treatment with RNase A/T1. d) Immunoblot of pulldown with oligodT-linked beads with crosslinked chromatin. A poly(A) competitor was used as a negative control for the pull-down. e) Schematic of cloned HA-SNRPB ORF with each flag representing a site of arginine mutation on the C-terminal tail. f) Immunoblot of acid extracted chromatin of inducible SNRPB construct overexpression with doxycycline treatment. g) Immunoblot of chromatin after inducing SNRPB WT and RtoA expression and a time course of DRB treatment.
Figure 5.
Figure 5.. PRMT5 inhibition results in mRNA chromatin detention.
a) Histograms depicting the amount of total RNA per cell normalized to the amount of DNA. *<0.01, **<0.01, ****<0.0001, n.s. = not significant. b) Immunoblots validation of RNA cellular fractionation protocol into cytoplasm, nucleoplasm, and chromatin fractions. c) Gross RNA abundance per cellular compartment, normalized to DNA in the chromatin fraction. *<0.01, n.s. = not significant. d) Relative abundance of RNA per cellular compartment with GSK591 or DMSO control. e) Gross amount of mRNA on chromatin, normalized to DNA. mRNA measured via RNA conversion to cDNA using oligo dT primers. f) Relative abundance of RNA on chromatin for PRMT5 and adaptor protein knockdown, normalized to amount of cellular DNA per sample. *<0.01, **<0.01, n.s. = not significant.
Figure 6.
Figure 6.. PRMT5 promotes mRNA escape from chromatin.
a) Schematic of cellular fractionation and RNA-sequencing experiment. b-c) Volcano plots of mRNA-sequencing of each treatment comparing cytoplasm to chromatin using S2 spike-in normalization. Red transcripts have a log2FC>0.58 and a padj>0.05. Blue transcripts have a log2FC<−0.58 and a padj>0.05. d-f) Volcano plots of mRNA-sequencing of each cellular compartment between conditions using S2 spike-in normalization. Red transcripts have a log2FC>0.58 and a padj>0.05. Blue transcripts have a log2FC<−0.58 and a padj>0.05. g) Dot plot of biological function gene ontology for chromatin-enriched transcripts. Dot size is representative to the number of genes per category and color represents the p-adjusted value. h) Correlation of the log10 average spike-in normalized read counts in TPM for transcripts in the cytoplasm and chromatin compartments for untreated cells (DMSO). Dotted line represents y=x. Transcript color represents the density of points on the plot. i) Density plots of the ratio of normalized TPM counts per gene (with TPM < median of all expressed genes) between chromatin and cytoplasm compartments, comparing genes found to be enriched on chromatin upon PRMTi. Kolmogorov-Smirnov (KS) and Wilcoxon ranked sum tests were used to compare distributions.
Figure 7.
Figure 7.. Chromatin enriched transcripts are defined by slower splicing rate and retained introns.
a) Number of introns per gene for chromatin enriched transcripts and all expressed genes in A549 cells. Average compared by Wilcoxon Ranked Sum test. **** signifies p < 0.0001. b) Fisher Exact Test and ODDS ratio of chromatin enriched transcripts, PRMT5i altered transcripts, and Type I PRMTi altered transcripts depending on their number of introns. c) SKaTER-seq calculated splicing rate of chromatin enriched transcripts compared to global transcript splicing rates. Distribution compared with Kolmogorov-Smirnov test. **** signifies p < 0.0001. d-e) Volcano plots of intron utilization for introns in cytoplasm, and chromatin, compared to DMSO matched controls. Red introns have a log2FC>0.58 and a padj>0.05. Blue introns have a log2FC<−0.58 and a padj>0.05. f) Violin plots representing the average Intron/Exon ratio of genes significantly expressed in each cellular compartment. The distribution of ratios per compartment was tested using the Kolmogorov-Smirnov test. g-h) Selected transcript IGV tracks demonstrating scaled transcript and intron levels in cytoplasm, nucleoplasm, and chromatin for DMSO and GSK591 treated cells. i) Model figure illustrating Genomically Retained Incompletely Processed Polyadenylated Transcripts (GRIPPs) and their dependence on arginine methylation for productive escape from chromatin.

References

    1. Maron M.I., Lehman S.M., Gayatri S., DeAngelo J.D., Hegde S., Lorton B.M., Sun Y., Bai D.L., Sidoli S., Gupta V., et al. (2021). Independent transcriptomic and proteomic regulation by type I and II protein arginine methyltransferases. iScience 24, 102971. 10.1016/j.isci.2021.102971. - DOI - PMC - PubMed
    1. Lorton B.M., and Shechter D. (2019). Cellular consequences of arginine methylation. Cell Mol Life Sci 76, 2933–2956. 10.1007/s00018-019-03140-2. - DOI - PMC - PubMed
    1. Guccione E., and Richard S. (2019). The regulation, functions and clinical relevance of arginine methylation. Nat Rev Mol Cell Biol 20, 642–657. 10.1038/s41580-019-0155-x. - DOI - PubMed
    1. Friesen W.J., Paushkin S., Wyce A., Massenet S., Pesiridis G.S., Van Duyne G., Rappsilber J., Mann M., and Dreyfuss G. (2001). The methylosome, a 20S complex containing JBP1 and pICln, produces dimethylarginine-modified Sm proteins. Mol Cell Biol 21, 8289–8300. 10.1128/MCB.21.24.8289-8300.2001. - DOI - PMC - PubMed
    1. Meister G., Eggert C., Buhler D., Brahms H., Kambach C., and Fischer U. (2001). Methylation of Sm proteins by a complex containing PRMT5 and the putative U snRNP assembly factor pICln. Curr Biol 11, 1990–1994. 10.1016/s0960-9822(01)00592-9. - DOI - PubMed

Publication types

LinkOut - more resources