[Preprint]. 2024 Aug 9:2024.08.08.607074.
doi: 10.1101/2024.08.08.607074.

DMT1 knockout abolishes ferroptosis induced mitochondrial dysfunction in C. elegans amyloid β proteotoxicity

Affiliations

DMT1 knockout abolishes ferroptosis induced mitochondrial dysfunction in C. elegans amyloid β proteotoxicity

Wilson Peng et al. bioRxiv. .

Update in

Abstract

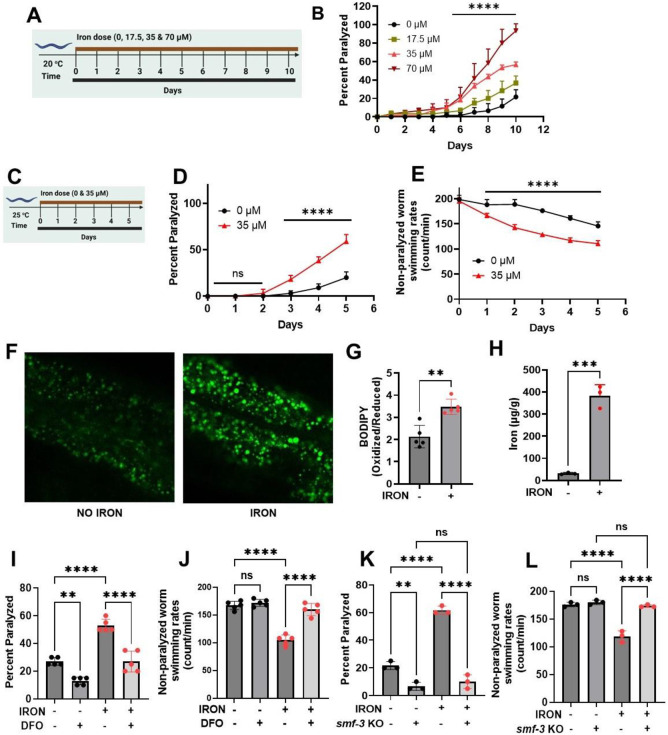
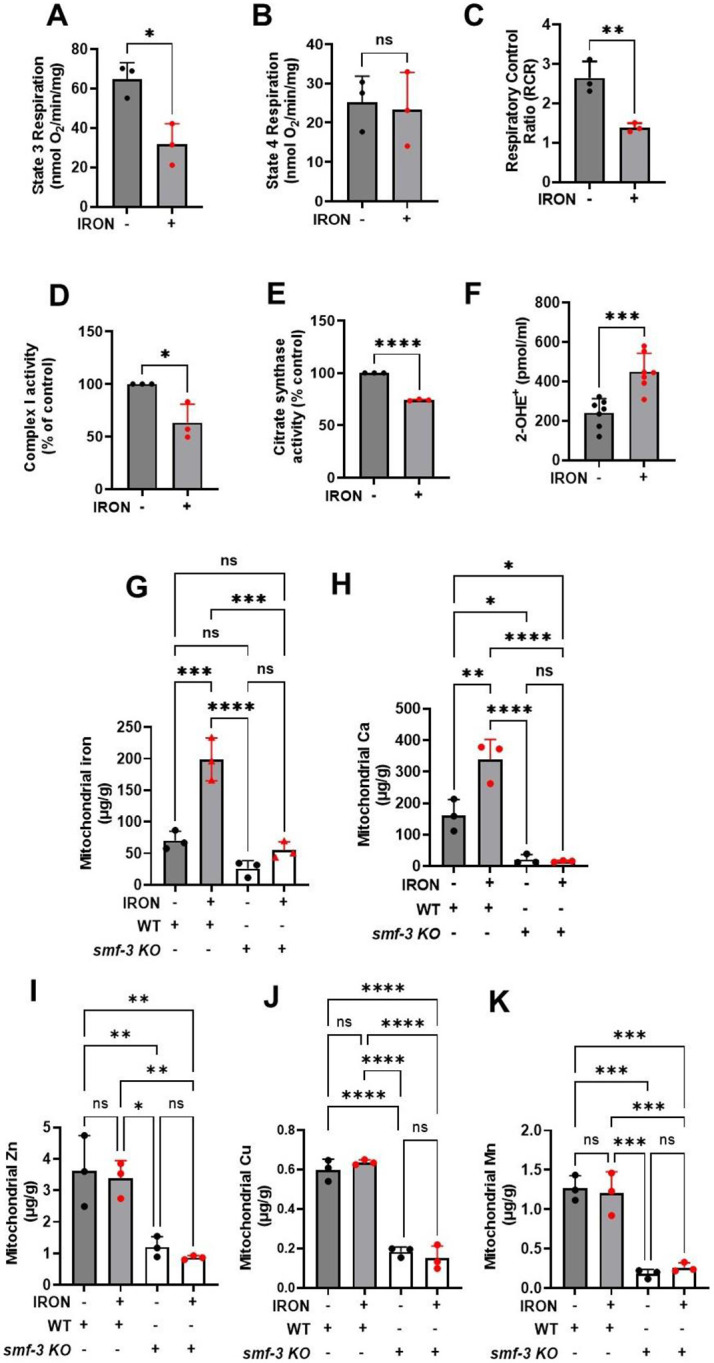
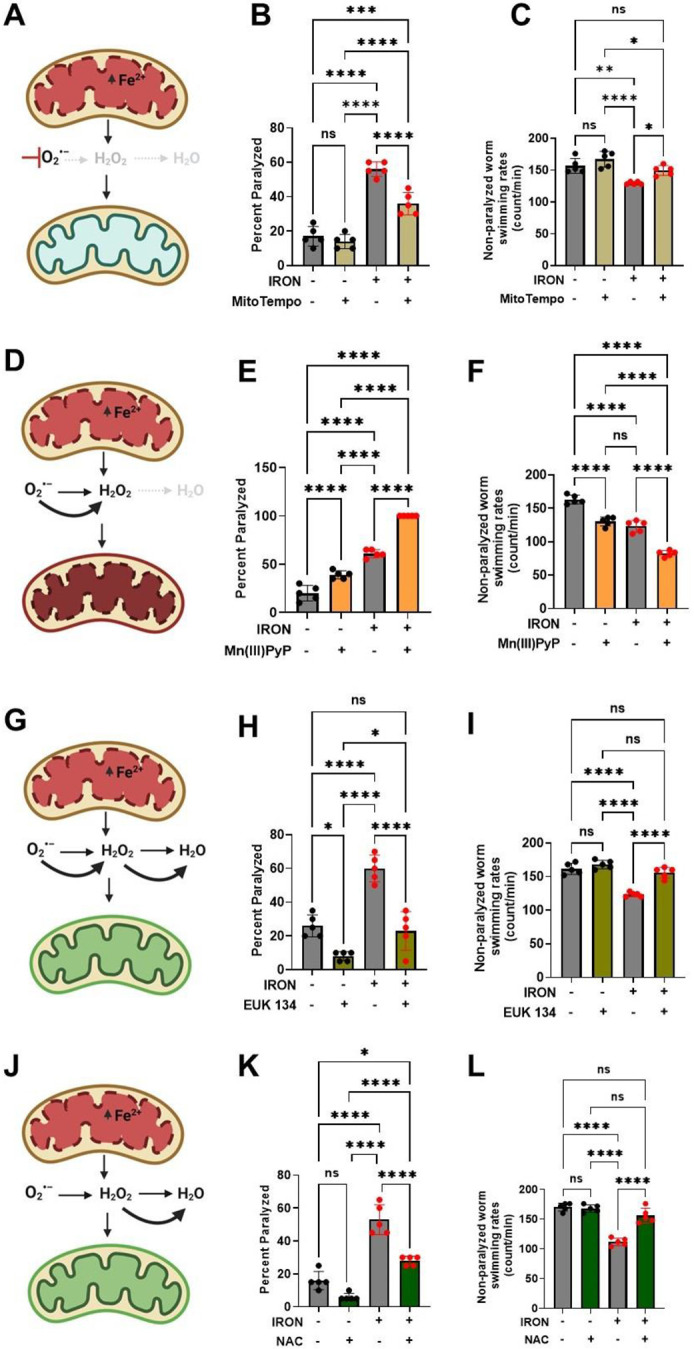
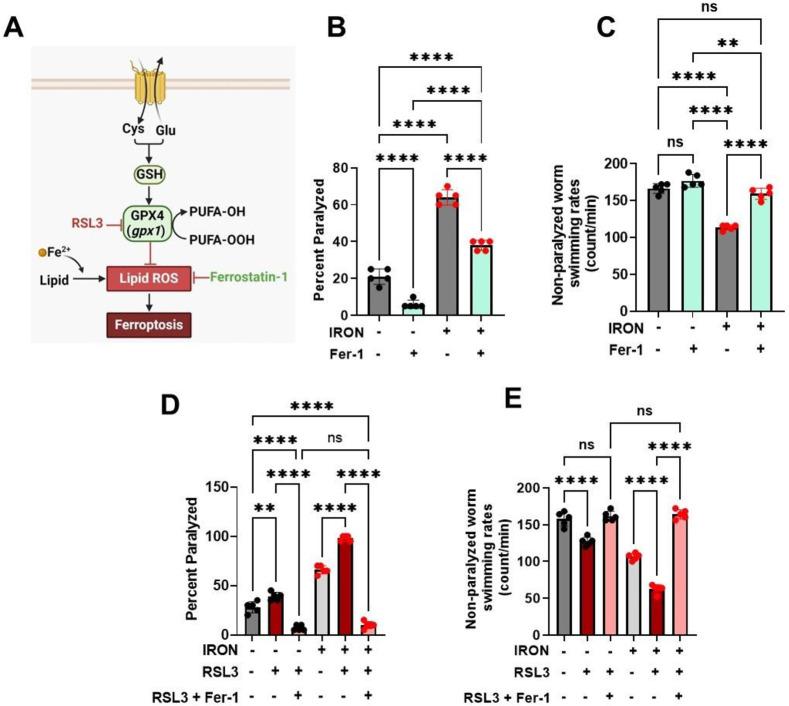
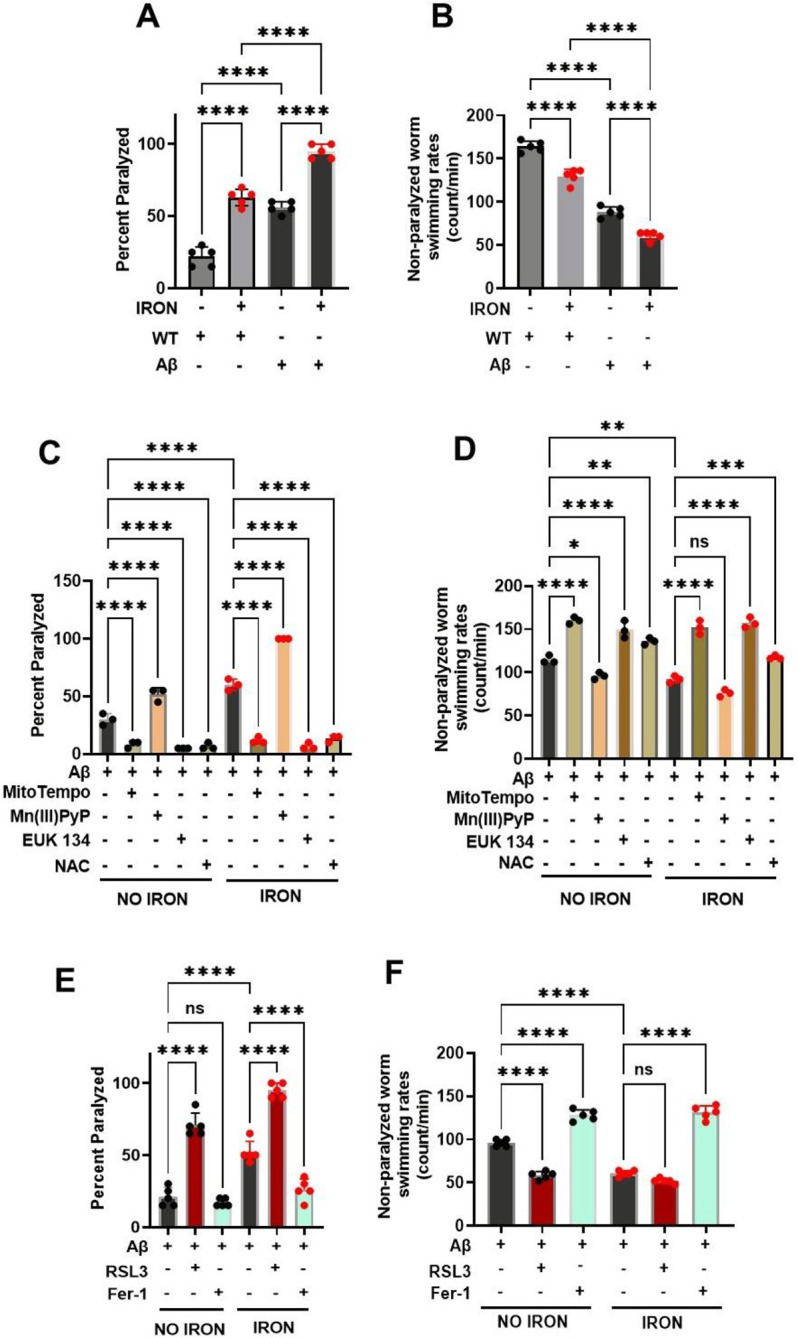
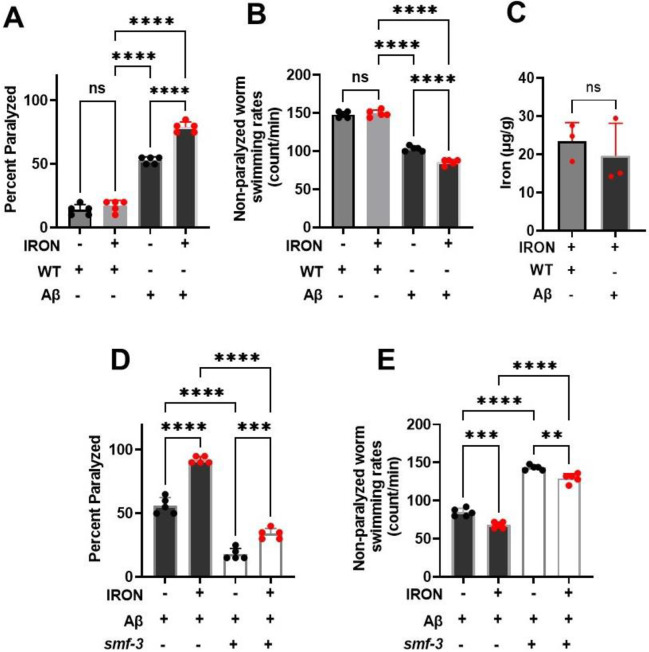
Iron is critical for neuronal activity and metabolism, and iron dysregulation alters these functions in age-related neurodegenerative disorders, such as Alzheimer's disease (AD). AD is a chronic neurodegenerative disease characterized by progressive neuronal dysfunction, memory loss and decreased cognitive function. AD patients exhibit elevated iron levels in the brain compared to age-matched non-AD individuals. However, the degree to which iron overload contributes to AD pathogenesis is unclear. Here, we evaluated the involvement of ferroptosis, an iron-dependent cell death process, in mediating AD-like pathologies in C. elegans. Results showed that iron accumulation occurred prior to the loss of neuronal function as worms age. In addition, energetic imbalance was an early event in iron-induced loss of neuronal function. Furthermore, the loss of neuronal function was, in part, due to increased mitochondrial reactive oxygen species mediated oxidative damage, ultimately resulting in ferroptotic cell death. The mitochondrial redox environment and ferroptosis were modulated by pharmacologic processes that exacerbate or abolish iron accumulation both in wild-type worms and worms with increased levels of neuronal amyloid beta (Aβ). However, neuronal Aβ worms were more sensitive to ferroptosis-mediated neuronal loss, and this increased toxicity was ameliorated by limiting the uptake of ferrous iron through knockout of divalent metal transporter 1 (DMT1). In addition, DMT1 knockout completely suppressed phenotypic measures of Aβ toxicity with age. Overall, our findings suggest that iron-induced ferroptosis alters the mitochondrial redox environment to drive oxidative damage when neuronal Aβ is overexpressed. DMT1 knockout abolishes neuronal Aβ-associated pathologies by reducing neuronal iron uptake.

Keywords: Aβ proteotoxicity; Bioenergetics; Divalent metal transporter 1; Ferroptosis; Oxidative stress.


Conflict of interest statement

Declaration of conflict of interest All the authors have no conflict of interest to report

Figures

Figure 1:
Figure 1:. Iron toxicity alters worm physiologic function:
A). Experimental layout showing 10 days of worm exposure to different iron doses (0, 17.5, 35, and 70 μM) at 20 °C. B). Dose- and time-dependent effects of iron exposure on worm paralysis at 20 °C. Staged L4 worms were transferred to plates containing iron (0, 17.5, 35, and 70 μM). Worms were then transferred every 24 h for 10 days. Paralysis (e.g., inability to move upon stimulation) was scored every 24 h for 10 days. Data are mean ±SEM, N=3 independent biological replicates (where one biological replicate contains 20 worms per plate). ****p<0.0001, two-way ANOVA, Tukey post hoc test. C). Experimental layout showing 5 days of worm exposure to iron (0 and 35 μM) at 25 °C. D). Time course of iron exposure on worm paralysis at 25 °C. Staged L4 worms were transferred to plates containing iron (0 or 35 μM). Paralysis was scored every 24 h for 5 days. Data are mean ±SEM, N=5 independent biological replicates (where one biological replicate contains 20 worms per plate). ns not significant, ****p<0.0001, one-way ANOVA, Tukey post hoc test. E). Iron reduced non-paralyzed worm swimming rates at 25 °C. Staged L4 worms were transferred to plate containing iron (0 or 35 μM). Worms were then transferred every 24 h for 5 days. Non-paralyzed worms were individually transferred to plate containing 100 μl of buffer. After 30 seconds of equilibration, swimming rates were collected for 15 seconds. Data are mean ±SEM N=5 independent replicates (where 4 independent worm count constitute an N). ****p<0.0001, one-way ANOVA, Tukey post hoc test. Iron toxicity increases whole worm lipid peroxidation. F) Confocal Image and G) Quantification. Staged L4 worms were transferred to plate containing iron (0 or 35 μM). Worms were then transferred every 24 h for 5 days. Then worms were transferred to plate containing 1.25 μM BODIPY for 60 min and prep for confocal imaging. Image scale 30 μm. Data are mean ±SEM N=5 independent replicates, **p=0.001, one-way ANOVA, Tukey post hoc test. H). Total iron was measured in worms using ICP-MS where dark circle (no iron) and red triangle(iron) bars treated with 35 μM iron. Data are mean ±SEM, N=4 independent biological replicates. ****p<0.0001, Unpaired t test. I). Effects of Deferoxamine (DFO) on iron-induced paralysis. Staged L4 worms were transferred to plates containing 0 μM iron, 0 μM iron + 100 μM DFO 35 μM iron and 35 μM iron + 100 μM DFO. Paralysis was scored every 24 h for 5 days. Data are mean ±SEM, N=5 independent biological replicates (where one biological replicate contains 20 worms per plate). ns not significant, ****p<0.0001, one-way ANOVA, Tukey post hoc test. J). Deferoxamine restored iron-induced impairment of non-paralyzed worm swimming rates. Staged L4 worms were transferred to plates containing 0 μM iron, 0 μM iron + 100 μM DFO 35 μM iron and 35 μM iron + 100 μM DFO . Non-paralyzed worms were individually transferred to plate containing 100 μl of buffer. After 30 seconds of equilibration, swimming rates were collected for 15 seconds on day 5. Data are mean ±SEM N=5 independent replicates. ns not significant, ****p<0.0001, one-way ANOVA, Tukey post hoc test. K). DMT1 (smf-3) knock out abolished iron toxicity mediated worm paralysis. Staged L4 worms were transferred to plates containing iron WT, smf-3 KO, WT + iron (35 μM) and smf-3 KO + iron (35 μM). Paralysis was scored every 24 h for 5 days. Data are mean ±SEM, N=3 independent biological replicates (where one biological replicate contains 20 worms per plate). *p<0.05, ****p<0.0001, one-way ANOVA, Tukey post hoc test. L). DMT1 (smf-3) knock out shielded worms from iron-induced reduction of non-paralyzed worm swimming rates. Staged L4 worms were transferred to plates containing iron WT, smf-3 KO, WT + iron (35 μM) and smf-3 KO + iron (35 μM). Non-paralyzed worms were individually transferred to plate containing 100 μl of buffer. After 30 seconds of equilibration, swimming rates were collected for 15 seconds. Data are mean ±SEM N=3 independent replicates (where 4 independent worm count constitute an N). ns not significant, ***p=0.0001, ****p<0.0001, one-way ANOVA, Tukey post hoc test.
Figure 2:
Figure 2:. Iron toxicity impairs mitochondrial function and increases ROS production.
Synchronized worms (0.25 million/plate) were transferred to plate with or without iron (0 and 35 μM). Mitochondria were isolated after 3 days and quantified for: A). State 3 respiration is the maximum respiratory rates following addition of ATP. Data are mean ±SEM N=3 independent replicates. *p<0.05, Unpaired t test. B). State 4 respiration is the minimum respiratory rates upon depletion of ATP. Data are mean ±SEM N=3 independent replicates. ns not significant, Unpaired t test. C). Respiratory control ratio (RCR) which is the ratio of maximum respiration state 3 over that of minimum respiration state 4. Data are mean ±SEM N=3 independent replicates. **p<0.001, Unpaired t test. D). Iron toxicity reduced mitochondrial complex I enzyme activity. Data are mean ±SEM N=3 independent replicates. *p<0.05, Unpaired t test. E). Iron toxicity reduced citrate synthase activity. Data are mean ±SEM N=3 independent replicates. *p<0.0001, Unpaired t test. F). Iron toxicity increased mitochondrial Superoxide (O2•−) production. Data are mean ±SEM N=7 independent replicates. ***p=0.0001, Unpaired t test. G). DMT1 (smf-3) knock out reduced mitochondrial iron uptake. Mitochondrial iron was measured using ICP-MS in isolated mitochondrial from WT, WT + 35 μM iron, smf-3 KO, and smf-3 + 35 μM iron. Data are mean ±SEM, N=3 independent biological replicates. ns not significant, ***p=0.0001, ***p<0.0001, one-way ANOVA, Tukey post hoc test. H). DMT1 (smf-3) knock out abolished iron induced increase in mitochondrial calcium uptake. Mitochondrial Ca was measured using ICP-MS in isolated mitochondrial from WT, WT + 35 μM iron, smf-3 KO, and smf-3 + 35 μM iron. Data are mean ±SEM, N=3 independent biological replicates. ns not significant, *p<0.05, **p<0.001, ***p<0.0001, one-way ANOVA, Tukey post hoc test. I). Mitochondrial Zn is not impacted by iron toxicity in DMT1 knock out. Mitochondrial Zn was measured using ICP-MS in isolated mitochondrial from WT, WT + 35 μM iron, smf-3 KO, and smf-3 + 35 μM iron. Data are mean ±SEM, N=3 independent biological replicates. ns not significant, *p<0.05, **p<0.001, one-way ANOVA, Tukey post hoc test. J). Mitochondrial Cu is not impacted by iron toxicity in DMT1 knock. Mitochondrial Cu was measured using ICP-MS in isolated mitochondrial from WT, WT + 35 μM iron, smf-3 KO, and smf-3 + 35 μM iron. Data are mean ±SEM, N=3 independent biological replicates. ns not significant, ***p<0.0001, one-way ANOVA, Tukey post hoc test. K). No effect of iron on mitochondrial Mn in DMT1 knock. Mitochondrial Mn was measured using ICP-MS in isolated mitochondrial from WT, WT + 35 μM iron, smf-3 KO, and smf-3 + 35 μM iron. Data are mean ±SEM, N=3 independent biological replicates. ns not significant, ***p=0.0001, one-way ANOVA, Tukey post hoc test.
Figure 3:
Figure 3:. Iron toxicity modulates mitochondrial redox environment.
A). Schematic diagram showing specific target of mitoTempo in redox environment. B). MitoTempo ameliorates iron toxicity induced increase in worm paralysis. Staged L4 worms were transferred to plates containing 0 μM iron, 0 μM iron + 10 μM MitoTempo, 35 μM iron and 35 μM iron + 10 μM MitoTempo. Paralysis was scored every 24 h for 5 days. Data are mean ±SEM, N=5 independent biological replicates (where one biological replicate contains 20 worms per plate). ***p=0.0001, ****p<0.0001, one-way ANOVA, Tukey post hoc test. C). MitoTempo restored non-paralyzed worm swimming rates in iron toxicity environment. Staged L4 worms were transferred to plates containing 0 μM iron, 0 μM iron + 10 μM MitoTempo, 35 μM iron and 35 μM iron + 10 μM MitoTempo. Non-paralyzed worms were individually transferred to plate containing 100 μl of buffer. After 30 seconds of equilibration, swimming rates were collected for 15 seconds. Data are mean ±SEM N=5 independent replicates (where 4 independent worm count constitute an N). ns not significant, **p<0.001, ****p<0.0001, one-way ANOVA, Tukey post hoc test. D). Schematic diagram showing specific target of SOD mimetic manganese porphyrin [Mn(III)PyP] in redox environment. E). Mn(III)PyP exacerbates iron toxicity induced increase in worm paralysis. Staged L4 worms were transferred to plates containing 0 μM iron, 0 μM iron + 100 μM Mn(III)PyP, 35 μM iron and 35 μM iron + 100 μM Mn(III)PyP. Paralysis was scored every 24 h for 5 days. Data are mean ±SEM, N=5 independent biological replicates (where one biological replicate contains 20 worms per plate). ****p<0.0001, one-way ANOVA, Tukey post hoc test. F). Mn(III)PyP worsen non-paralyzed worm swimming rates in iron toxicity environment. Staged L4 worms were transferred to plates containing 0 μM iron, 0 μM iron + 100 μM Mn(III)PyP, 35 μM iron and 35 μM iron + 100 μM Mn(III)PyP. Non-paralyzed worms were individually transferred to plate containing 100 μl of buffer. After 30 seconds of equilibration, swimming rates were collected for 15 seconds. Data are mean ±SEM N=5 independent replicates (where 4 independent worm count constitute an N). ****p<0.0001, one-way ANOVA, Tukey post hoc test. G). Schematic diagram showing specific target of EUK 134 (SOD and Catalase mimetic) in mitochondrial redox environment. H). EUK 134 protects against iron-induced toxicity induced in worm paralysis. Staged L4 worms were transferred to plates containing 0 μM iron, 0 μM iron + 100 μM EUK 134, 35 μM iron and 35 μM iron + 100 μM EUK 134. Paralysis was scored every 24 h for 5 days. Data are mean ±SEM, N=5 independent biological replicates (where one biological replicate contains 20 worms per plate). ns not significant ***p=0.0001, ****p<0.0001, one-way ANOVA, Tukey post hoc test. I). EUK 134 restored non-paralyzed worm swimming rates in iron toxicity environment. Staged L4 worms were transferred to plates containing 0 μM iron, 0 μM iron + 100 μM EUK 134, 35 μM iron and 35 μM iron + 100 μM EUK 134. Non-paralyzed worms were individually transferred to plate containing 100 μl of buffer. After 30 seconds of equilibration, swimming rates were collected for 15 seconds. Data are mean ±SEM N=5 independent replicates (where 4 independent worm count constitute an N). ns not significant, **p<0.001, ****p<0.0001, one-way ANOVA, Tukey post hoc test. J). Schematic diagram showing specific target of N-Acetyl Cysteine (NAC) in mitochondrial redox environment. K). NAC protects against iron toxicity induced increase in worm paralysis. Staged L4 worms were transferred to plates containing 0 μM iron, 0 μM iron + 2.5 mM NAC, 35 μM iron and 35 μM iron + 2.5 mM NAC. Paralysis was scored every 24 h for 5 days. Data are mean ±SEM, N=5 independent biological replicates (where one biological replicate contains 20 worms per plate). *p<0.05, ***p=0.0001, ****p<0.0001, one-way ANOVA, Tukey post hoc test. L). NAC restored non-paralyzed worm swimming rates in iron toxicity environment. Staged L4 worms were transferred to plates containing 0 μM iron, 0 μM iron + 2.5 mM NAC, 35 μM iron and 35 μM iron + 2.5 mM NAC. Non-paralyzed worms were individually transferred to plate containing 100 μl of buffer. After 30 seconds of equilibration, swimming rates were collected for 15 seconds. Data are mean ±SEM N=5 independent replicates (where 4 independent worm count constitute an N). ns not significant, ****p<0.0001, one-way ANOVA, Tukey post hoc test
Figure 4:
Figure 4:. Ferroptosis modulates iron induced toxicity.
A). Schematic diagram showing side of ferroptotic drug target regulating iron toxicity. B). Ferrostatin-1 (Fer-1) ameliorates iron-induced worm paralysis. Staged L4 worms were transferred to plates containing 0 μM iron, 0 μM iron + 5 μM Fer-1, 35 μM iron and 35 μM iron + 5 μM Fer-1. Paralysis was scored every 24 h for 5 days. Data are mean ±SEM, N=5 independent biological replicates (where one biological replicate contains 20 worms per plate). ****p<0.0001, one-way ANOVA, Tukey post hoc test. C). Ferrostatin-1 restored non-paralyzed worm swimming rates in iron toxicity environment. Staged L4 worms were transferred to plates containing 0 μM iron, 0 μM iron + 5 μM Fer-1, 35 μM iron and 35 μM iron + 5 μM Fer-1. Non-paralyzed worms were individually transferred to plate containing 100 μl of buffer. After 30 seconds of equilibration, swimming rates were collected for 15 seconds. Data are mean ±SEM N=5 independent replicates (where 4 independent worm count constitute an N). ns not significant, ****p<0.0001, one-way ANOVA, Tukey post hoc test. D). RSL3 exacerbates iron toxicity induced increase in worm paralysis. Staged L4 worms were transferred to plates containing 0 μM iron, 0 μM iron + 5 nM RSL3, 0 μM iron + 5 nM RSL3 + 5 μM Fer-1, 35 μM iron, 35 μM iron + 5 nM RSL3, and 35 μM iron + 5 nM RSL3 + 5 μM Fer-1. Paralysis was scored every 24 h for 5 days. Data are mean ±SEM, N=5 independent biological replicates (where one biological replicate contains 20 worms per plate). ****p<0.0001, one-way ANOVA, Tukey post hoc test. E). RSL3 worsen non-paralyzed worm swimming rates in iron toxicity environment. Staged L4 worms were transferred to plates containing 0 μM iron, 0 μM iron + 5 nM RSL3, 0 μM iron + 5 nM RSL3 + 5 μM Fer-1, 35 μM iron, 35 μM iron + 5 nM RSL3, and 35 μM iron + 5 nM RSL3 + 5 μM Fer-1. Non-paralyzed worms were individually transferred to plate containing 100 μl of buffer. After 30 seconds of equilibration, swimming rates were collected for 15 seconds. Data are mean ±SEM N=5 independent replicates (where 4 independent worm count constitute an N). ****p<0.0001, one-way ANOVA, Tukey post hoc test
Figure 5:
Figure 5:. Iron toxicity exacerbates ROS and ferroptosis dependent phenotypes in neuronal Aβ pathology:
A) Iron toxicity potentiate Aβ increased worm paralyses. Staged L4 worms (WT and neuronal Aβ) were transferred to plates containing iron (0 or 35 μM). Paralysis was scored every 24 h for 5 days. Data are mean ±SEM, N=5 independent biological replicates (where one biological replicate contains 20 worms per plate). ns not significant, ****p<0.0001, one-way ANOVA, Tukey post hoc test. B) Iron toxicity worsen Aβ decreased in worm swimming rates. Staged L4 worms (WT and neuronal Aβ) were transferred to plate containing iron (0 or 35 μM). Worms were then transferred every 24 h for 5 days. Non-paralyzed worms were individually transferred to plate containing 100 μl of buffer. After 30 seconds of equilibration, swimming rates were collected for 15 seconds. Data are mean ±SEM N=5 independent replicates (where 4 independent worm count constitute an N). ****p<0.0001, one-way ANOVA, Tukey post hoc test. C) Iron toxicity induced ROS potentiates Aβ paralyses. Staged L4 worms neuronal Aβ were transferred to plates containing iron (0 or 35 μM) with oxidative stress modulators 10 μM MitoTempo, 100 μM Mn(III)PyP, 100 μM EUK 134 and 2.5 mM NAC. Paralysis was scored every 24 h for 3 days. Data are mean ±SEM, N=3 independent biological replicates (where one biological replicate contains 20 worms per plate). ****p<0.0001, one-way ANOVA, Tukey post hoc test. D) Impact of iron-induced ROS on neuronal Aβ worm swimming rates. Staged L4 worms neuronal Aβ were transferred to plates containing iron (0 or 35 μM) with oxidative stress modulators 10 μM MitoTempo, 100 μM Mn(III)PyP, 100 μM EUK 134 and 2.5 mM NAC. Worms were then transferred every 24 h for 3 days. Non-paralyzed worms were individually transferred to plate containing 100 μl of buffer. After 30 seconds of equilibration, swimming rates were collected for 15 seconds. Data are mean ±SEM N=3 independent replicates (where 4 independent worm count constitute an N). ns not significant, *p<0.05, **p<0.001, ***p=0.0001, ****p<0.0001, one-way ANOVA, Tukey post hoc test. E) Ferroptosis regulates iron-induced paralysis in neuronal Aβ pathology. Staged L4 worms neuronal Aβ were transferred to plates containing iron (0 or 35 μM) ferroptosis modulators 5 nM RSL3 and 5 μM Fer-1. Paralysis was scored every 24 h for 3 days. Data are mean ±SEM, N=5 independent biological replicates (where one biological replicate contains 20 worms per plate). ns not significant, ****p<0.0001, one-way ANOVA, Tukey post hoc test. F) Ferroptosis drives iron-induced slow swimming of neuronal Aβ worms. Staged L4 worms neuronal Aβ were transferred to plates containing iron (0 or 35 μM) ferroptosis modulators 5 nM RSL3 and 5 μM Fer-1. Worms were then transferred every 24 h for 3 days. Non-paralyzed worms were individually transferred to plate containing 100 μl of buffer. After 30 seconds of equilibration, swimming rates were collected for 15 seconds. Data are mean ±SEM N=5 independent replicates (where 4 independent worm count constitute an N). ns not significant, ****p<0.0001, one-way ANOVA, Tukey post hoc test.
Figure 6:
Figure 6:. DMT1(smf-3) KO protects against neuronal Aβ pathology:
Neuronal Aβ worms exhibit increase sensitivity to iron toxicity than WT. A) Paralysis: Staged L4 worms (WT and neuronal Aβ) were transferred to plates containing iron (0 or 8.75 μM). Paralysis was scored every 24 h for 5 days. Data are mean ±SEM, N=5 independent biological replicates (where one biological replicate contains 20 worms per plate). ns not significant, ****p<0.0001, one-way ANOVA, Tukey post hoc test. B) Non-paralyzed worm swimming rates. Staged L4 worms (WT and neuronal Aβ) were transferred to plate containing iron (0 or 8.75 μM). Worms were then transferred every 24 h for 5 days. Non-paralyzed worms were individually transferred to plate containing 100 μl of buffer. After 30 seconds of equilibration, swimming rates were collected for 15 seconds. Data are mean ±SEM N=5 independent replicates (where 4 independent worm count constitute an N). ns not significant, ****p<0.0001, one-way ANOVA, Tukey post hoc test. C) Neuronal Aβ iron sensitivity not mediated by iron burden. Tissue iron burden was measured in WT and Aβ treated with 8.75 μM iron for 5 days using ICP-MS. Data are mean ±SEM, N=3 independent biological replicates. ns not significant, Unpaired t test. D). Knock out of smf-3 in neuronal Aβ worms abolished paralysis. Staged L4 worms (neuronal Aβ and neuronal Aβ+ smf-3 KO) were transferred to plates containing iron (0 or 35 μM). Paralysis was scored every 24 h for 5 days. Data are mean ±SEM, N=5 independent biological replicates (where one biological replicate contains 20 worms per plate). ***p=0.0001, ****p<0.0001, one-way ANOVA, Tukey post hoc test. E) smf-3 KO in neuronal Aβ worms protects against Aβ decreased swimming rate. Staged L4 worms (neuronal Aβ and neuronal Aβ+ smf-3 KO) were transferred to plates containing iron (0 or 35 μM). Worms were then transferred every 24 h for 5 days. Non-paralyzed worms were individually transferred to plate containing 100 μl of buffer. After 30 seconds of equilibration, swimming rates were collected for 15 seconds. Data are mean ±SEM N=5 independent replicates (where 4 independent worm count constitute an N). **p<0.001, ***p=0.0001, ****p<0.0001, one-way ANOVA, Tukey post hoc test.

References

    1. Crichton R.R., Dexter D.T., and Ward R.J., Brain iron metabolism and its perturbation in neurological diseases. J Neural Transm (Vienna), 2011. 118(3): p. 301–14. - PubMed
    1. Belaidi A.A. and Bush A.I., Iron neurochemistry in Alzheimer's disease and Parkinson's disease: targets for therapeutics. J Neurochem, 2016. 139 Suppl 1: p. 179–197. - PubMed
    1. Onukwufor J.O., Dirksen R.T., and Wojtovich A.P., Iron Dysregulation in Mitochondrial Dysfunction and Alzheimer's Disease. Antioxidants (Basel), 2022. 11(4). - PMC - PubMed
    1. Ward R.J., et al., The role of iron in brain ageing and neurodegenerative disorders. Lancet Neurol, 2014. 13(10): p. 1045–60. - PMC - PubMed
    1. Huang L., et al., Intracellular amyloid toxicity induces oxytosis/ferroptosis regulated cell death. Cell Death Dis, 2020. 11(10): p. 828. - PMC - PubMed

Publication types

LinkOut - more resources