[Preprint]. 2024 Aug 7:2024.08.07.607052.
doi: 10.1101/2024.08.07.607052.

The pseudoenzyme β-amylase9 from Arabidopsis binds to and enhances the activity of α-amylase3: A possible mechanism to promote stress-induced starch degradation

Affiliations

The pseudoenzyme β-amylase9 from Arabidopsis binds to and enhances the activity of α-amylase3: A possible mechanism to promote stress-induced starch degradation

Christopher E Berndsen et al. bioRxiv. .

Update in

Abstract

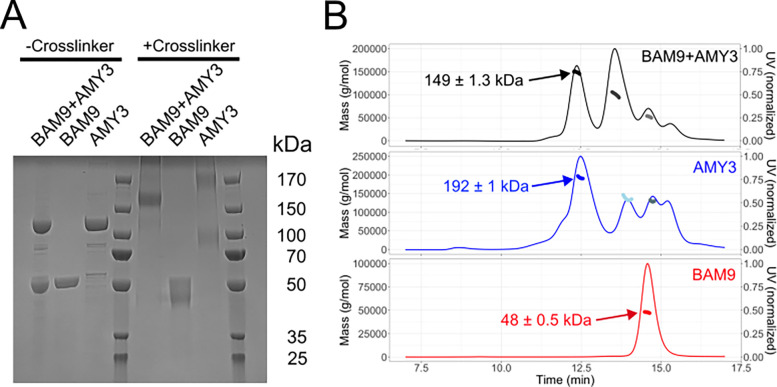
Starch accumulation in plant tissues provides an important carbon source at night and for regrowth after periods of dormancy and in times of stress. Both ɑ- and β-amylases (AMYs and BAMs, respectively) catalyze starch hydrolysis, but their functional roles are unclear. Moreover, the presence of catalytically inactive amylases that show starch excess phenotypes when deleted presents an interesting series of questions on how starch degradation is regulated. Plants lacking one of these catalytically inactive β-amylases, BAM9, were shown to have enhanced starch accumulation when combined with mutations in BAM1 and BAM3, the primary starch degrading BAMs in response to stress and at night, respectively. Importantly, BAM9 has been reported to be transcriptionally induced by stress through activation of SnRK1. Using yeast two-hybrid experiments, we identified the plastid-localized AMY3 as a potential interaction partner for BAM9. We found that BAM9 interacted with AMY3 in vitro and that BAM9 enhances AMY3 activity 3-fold. Modeling of the AMY3-BAM9 complex revealed a previously undescribed N-terminal structural feature in AMY3 that we call the alpha-alpha hairpin that could serve as a potential interaction site. Additionally, AMY3 lacking the alpha-alpha hairpin is unaffected by BAM9. Structural analysis of AMY3 showed that it can form a homodimer in solution and that BAM9 appears to replace one of the AMY3 monomers to form a heterodimer. Collectively these data suggest that BAM9 is a pseudoamylase that activates AMY3 in response to cellular stress, possibly facilitating starch degradation to provide an additional energy source for stress recovery.


Figures

Figure 1.
Figure 1.
Domain organization of Arabidopsis AMY3. The numbers indicate the amino acid boundaries for each region as defined by Uniprot (Q94A41) and the AlphaFold3 model. cTP stands for chloroplast transit peptide, which is removed after AMY3 is transported to the chloroplast. CBM, Carbohydrate binding modules CBM45. Purple Y2H bars indicate the prey plasmid sequences identified as interacting with BAM9 in the yeast two-hybrid experiment. A complete list of possible BAM9 plastidic interaction partners are found in Supplementary Table S1.
Figure 2.
Figure 2.
Purification and amylase activity of BAM9 and AMY3. (A) SDS-PAGE of recombinant AMY3 and BAM9 after nickel affinity and size-exclusion chromatography purification. Sequence-based molecular weights for each protein are indicated. AMY3 consistently migrates slower than expected based on the sequence weight. This phenomenon has been observed by others studying AMY3 (Seung et al., 2013). (B) Stimulation of AMY3 activity by BAM9. AMY3cat is a purified, recombinant truncation of AMY3, which includes only the ɑ-amylase domain. Data shown are representative data from three assays and the raw scatter of the measurements from this experiment is shown. (C) Titration of BAM9 to estimate the stoichiometry of the BAM9-AMY3 complex. Dashed vertical line indicates a 1:1 molar ratio, and combined data from three experiments are shown in the plot.
Figure 3.
Figure 3.
Structural Model of BAM9-AMY3 and conservation of the potential interaction site. (A) Top scoring AlphaFold3 model of AMY3 (blue) and BAM9 (red). (B) Positioning of individual domains of AMY3 on BAM9 (right) from the 10 AlphaFold models. The top panel shows the positions of the tandem CBM domains, middle is the alpha-alpha hairpin domain, and bottom is the amylase domain (all in blue) relative to BAM9 (red) in alignments of potential AMY3-BAM9 complexes. (C) Focus on the 10 positions of the alpha-alpha hairpin (cyan/blue) in the predicted interaction with BAM9 (red/white). The WebLogo of the alpha-alpha hairpin is indicated with cyan or blue rectangles to indicate the first and second respective helix in the hairpin. The two helices within BAM9 and the corresponding WebLogos showing sequence conservation are highlighted in red. WebLogos for AMY3 and BAM9 sequences were generated from alignments of sequences from 21 orders of Angiosperms (see Supplementary Table S2 for species and accession numbers).
Figure 4.
Figure 4.
Isolation of the BAM9-AMY3 complex and AMY3 homodimer. (A) SDS-PAGE of BAM9, AMY3, and BAM9 with AMY3 alone or after crosslinking with glutaraldehyde. (B) Size-exclusion chromatography coupled to multi-angle light scattering (SEC-MALS) of BAM9 (red), AMY3 (blue), and BAM9 with AMY3 (black). Molecular weight measurements from MALS are indicated in points and correspond to the masses indicated on the left-side y-axis.
Figure 5.
Figure 5.
Small-angle X-ray scattering of BAM9, AMY3, and BAM9-AMY3. (A) Kratky plots of BAM9 (red), AMY3 (blue), and BAM9 with AMY3 (black) SAXS data. The crossed lines show the “ideal” maximum for globular proteins. Deviations up and to the right of this intersection indicate proteins that are flexible in solution. (B) log(intensity) vs. q plot showing the data and the fit of an AlphaFold3 model of BAM9 to the data. (C) log(intensity) vs. q plot showing the data and the fit of an AlphaFold3 model of AMY3 to the data. The solid line is the fit of the BilboMD fit to the SAXS data. Dotted and dashed lines indicate the fit of the AlphaFold3 model and a BilboMD-optimized single structure fit to the data, which has X2 values of 16 and 2, respectively. The two structures are the BilboMD optimized ensemble that fitted best to the data.
Figure 6.
Figure 6.
Evolution of BAM9 and AMY3 in Viridiplantae. The presence or absence of BAM9 (red) and AMY3 (blue) genes mapped onto a phylogenetic tree of species ranging from a charophyte alga to eudicots. The green circle indicates the putative origin of both genes. The red circle indicates a loss of the AMY3 gene, and the two blue circles indicate the loss of both BAM9 and AMY3 genes. The phylogenetic tree was generated using TimeTree: timetree.org (Kumar et al. 2017) and the scale bar represents time in millions of years. Accession numbers are listed in Supplementary Table S4.

References

    1. Abramson J. et al. (2024) ‘Accurate structure prediction of biomolecular interactions with AlphaFold 3’, Nature, pp. 1–3. - PMC - PubMed
    1. Adachi M. et al. (1998) ‘Crystal structure of recombinant soybean beta-amylase complexed with beta-cyclodextrin’, The Journal of biological chemistry, 273(31), pp. 19859–19865. - PubMed
    1. Baena-González E. et al. (2007) ‘A central integrator of transcription networks in plant stress and energy signalling’, Nature, 448(7156), pp. 938–942. - PubMed
    1. Chandler J.W., Apel K. and Melzer S. (2001) ‘A novel putative β-amylase gene and ATβ-Amy from Arabidopsis thaliana are circadian regulated’, Plant science: an international journal of experimental plant biology, 161(5), pp. 1019–1024.
    1. Chinnam N.B. et al. (2023) ‘Combining small angle X-ray scattering (SAXS) with protein structure predictions to characterize conformations in solution’, Methods in enzymology, 678, pp. 351–376. - PMC - PubMed

Publication types

LinkOut - more resources