[Preprint]. 2024 Aug 8:2024.08.06.606880.
doi: 10.1101/2024.08.06.606880.

Cysteine depletion triggers adipose tissue thermogenesis and weight-loss

Affiliations

Cysteine depletion triggers adipose tissue thermogenesis and weight-loss

Aileen H Lee et al. bioRxiv. .

Update in

  • Cysteine depletion triggers adipose tissue thermogenesis and weight loss.
    Lee AH, Orliaguet L, Youm YH, Maeda R, Dlugos T, Lei Y, Coman D, Shchukina I, Andhey PS, Smith SR, Ravussin E, Stadler K, Chen B, Artyomov MN, Hyder F, Horvath TL, Schneeberger M, Sugiura Y, Dixit VD. Lee AH, et al. Nat Metab. 2025 Jun;7(6):1204-1222. doi: 10.1038/s42255-025-01297-8. Epub 2025 Jun 3. Nat Metab. 2025. PMID: 40461845 Free PMC article.

Abstract

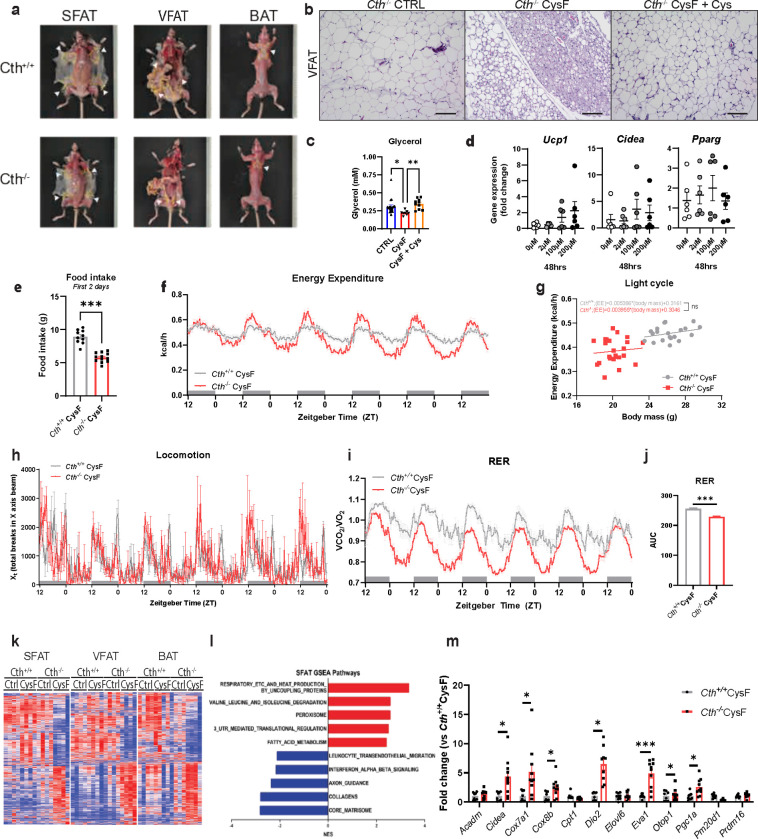
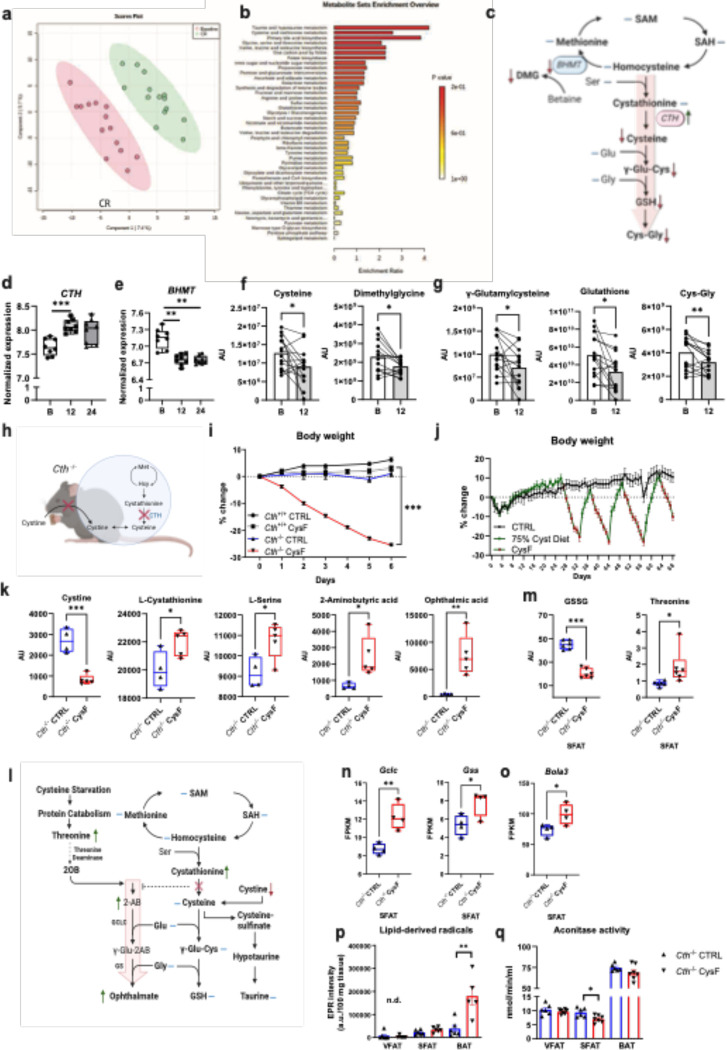
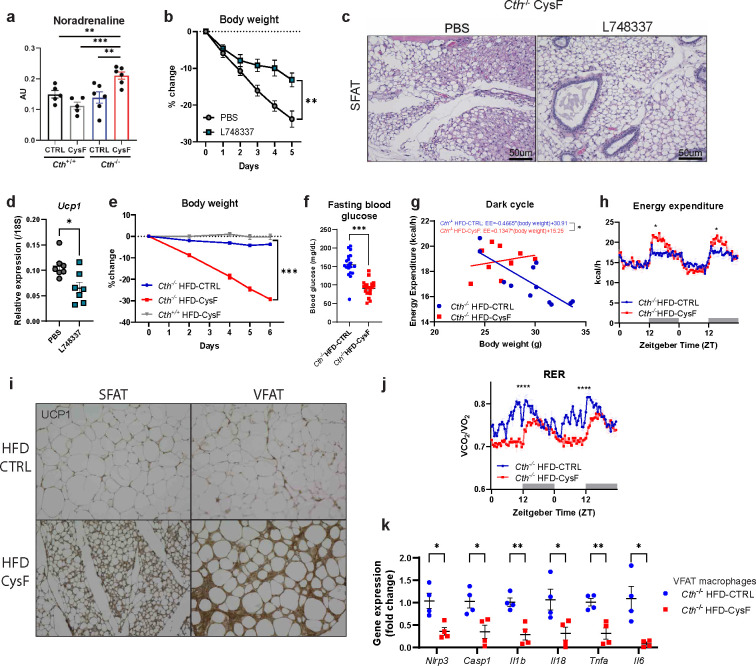
Dietary interventions such as caloric restriction (CR)1 and methionine restriction2 that prolong lifespan induce the 'browning' of white adipose tissue (WAT), an adaptive metabolic response that increases heat production to maintain health3,4. However, how diet influences adipose browning and metabolic health is unclear. Here, we identified that weight-loss induced by CR in humans5 reduces cysteine concentration in WAT suggesting depletion of this amino-acid may be involved in metabolic benefits of CR. To investigate the role of cysteine on organismal metabolism, we created a cysteine-deficiency mouse model in which dietary cysteine was eliminated and cystathionine γ-lyase (CTH)6, the enzyme that synthesizes cysteine was conditionally deleted. Using this animal model, we found that systemic cysteine-depletion causes drastic weight-loss with increased fat utilization and browning of adipose tissue. The restoration of dietary cysteine in cysteine-deficient mice rescued weight loss together with reversal of adipose browning and increased food-intake in an on-demand fashion. Mechanistically, cysteine deficiency induced browning and weight loss is dependent on sympathetic nervous system derived noradrenaline signaling via β3-adrenergic-receptors and does not require UCP1. Therapeutically, in high-fat diet fed obese mice, one week of cysteine-deficiency caused 30% weight-loss and reversed inflammation. These findings thus establish that cysteine is essential for organismal metabolism as removal of cysteine in the host triggers adipose browning and rapid weight loss.


Figures

Extended Data Figure 1:
Extended Data Figure 1:. Cysteine depletion induces weight-loss in mice without overt pathology.
a) Cystathionine and homocysteine measurements by MS/MS in human SFAT at baseline (B) and after 12 months of caloric restriction (n=14). AU: arbitrary units. b) Schematic of Cth−/− and Cthfl/fl mice generation (KOMP construct) used to cross to either Alb:cre or Adipoq:cre. c) Body weight of Cth+/+ and Cth−/− mice fed with CTRL or CysF diet for 6 days (n=5 Cth+/+ CTRL, n=6 Cth+/+ CysF, n=4 Cth−/− CTRL, n=5 Cth−/− CysF). d) Fat mass and lean mass measured by EchoMRI of male Cth+/+ and Cth−/− after 6 days of CTRL or CysF diet (n=5 Cth+/+ CTRL, n=12 Cth+/+ CysF, n=8 Cth−/− CTRL, n=17 Cth−/− CysF). e) Cth+/+ and Cth−/− mice were fed ad libitum (ad lib) or pair fed CTRL or CysF diet (n=4 Cth+/+CysF ad lib, n=5 Cth+/+CysF pair fed, n=7 Cth−/−CTRL pair fed, n=5 Cth−/− CysF pair fed). Percentage body weight change over 6 days of diet. f) Accumulated food intake of Cth+/+ and Cth−/− mice over 6 days of CysF feeding measured in metabolic cages (n=10 Cth+/+ and n=12 Cth−/−). Cage image and video show that Cth−/− mice on CysF diet at day 5 have normal activity. g) Qualitative assessment of nest building (score from 0 to 4) and presence (score=1) or absence (score=0) of kyphosis in WT and Cth−/− mice (n=12/group). h) Gait assessment, ledge test and hindlimb clasping test were performed to measure motor coordination in WT and Cth−/− mice. Mice were scored from 0 (normal behavior) to 1 (abnormal behavior) (n=12/group). i) Representative H&E-stained sections of kidney, lung, heart, and liver from female CTH−/− mice fed control diet or Cystine-deficient diet for 6 days, lack significant pathologic changes and do not differ in microscopic changes by diet in the tissues examined. C = renal cortex, M = renal medulla A = airway, P = pulmonary artery, > = central vein, and * = portal triad. Kidney scale bars=200 μm, lung, heart, liver scale bars= 100μm. j) Serum L-methionine, L-homocysteine, glutamic acid and k) SFAT GSH quantified by mass spectrometry in Cth−/− mice fed with CTRL or CysF diet for 6 days (n=4–5/group). AU: arbitrary units. l) RNA-seq-based Nfs1 and Isca1 gene expression in SFAT of Cth+/+ and Cth−/− mice after 6 days of CTRL or CysF feeding (n=4/group). m) Representative EPR spectra of POBN-lipid radical adducts measured in Folch extracts of VFAT, SFAT and BAT tissues. The six-line spectrum (red arrows) is consistent with carbon-centered lipid-derived radicals, indicative of lipid peroxidation (identified through hyperfine coupling constants aN = 15.75 ± 0.06 G and aβH = 2.77 ± 0.07 G). Data are expressed as mean±SEM. Statistical differences were calculated by 2-way ANOVA with Sidak’s correction for multiple comparisons, or by unpaired t-test (**p<0.01, ***p<0.001).
Extended Data Figure 2:
Extended Data Figure 2:. Cysteine starvation induces thermogenic reprogramming of adipose tissue transcriptome.
a) Representative subcutaneous (SFAT), visceral (VFAT), and brown adipose depots (BAT) of Cth+/+ and Cth−/− after 6 days of CysF diet. b) Representative H&E-stained sections of VFAT of Cth−/− mice fed CTRL or CysF diet for 6 days or after Cys supplementation following CysF weight loss (scale bar=100 μm). c) Serum glycerol levels of Cth−/− mice fed with CTRL (n=20) or CysF (n=8) or switched to Cys-containing diet after CysF feeding (n=10). d) Ucp1, Cidea and Pparg gene expression in Cth−/− pre-adipocytes differentiated in vitro and treated with increasing concentration of Cystine for 48 hours. e) Cumulative food intake during the initial two days of CysF feeding in Cth+/+ and Cth−/− mice (n=10 Cth+/+ and n=12 Cth−/−). f-j) Cth+/+ and Cth−/− mice were fed with CysF diet for 6 days and housed in metabolic cages (n=10 Cth+/+ and n=12 Cth−/−). f) Energy expenditure during CysF feeding. g) Linear regression analysis of unnormalized average energy expenditure measured by indirect calorimetry against body mass on days 4 and 5 of CysF diet. h) Locomotor activity. i) Respiratory exchange ratio (RER) and j) area under the curve (AUC) quantified for RER. k-l) Whole tissue RNA-seq of SFAT, VFAT, and BAT of Cth+/+ and Cth−/− fed 6 days of CTRL or CysF diet (n=4/group). k) Heat map highlighting changes specifically occurring in cysteine deficiency. l) Select top pathways being up- and down-regulated in Cth−/− CysF vs CTRL in SFAT after gene set enrichment analysis. i) Gene expression of selected thermogenesis markers confirmed by qPCR in SFAT, in Cth+/+ and Cth−/− mice fed with CysF diet (n=8 Cth+/+ and n=10 Cth−/−. Data are expressed as mean±SEM. Statistical differences were calculated by one-way ANOVA, or by 2-way ANOVA with Sidak’s correction for multiple comparisons, or by unpaired t-test, (*p<0.05, **p<0.01, ***p<0.001).
Extended Data Figure 3:
Extended Data Figure 3:. Impact of cysteine depletion on transcriptional regulation of adipose tissue at single cell resolution.
a) Experimental design schematic of cell processing of subcutaneous adipose depot (SFAT) stromal vascular fraction (SVF) for scRNA-seq. b) t-SNE plot of scRNAseq from SFAT stromal vascular fraction with c) cluster identities. APCs: antigen presenting cells. ASCs: adipose-derived stromal cells. d) Heat map of normalized gene expression of selected markers to identify major cell lineages. e) Enrichment of CL-316,243 activated gene signature overlaid on all populations in all samples. f) t-SNE plots displaying Dpp4, Cd9, Icam1, Col5a3, F3, and Tagln expression in red across all populations in Cth−/− CTRL and Cth−/− CysF samples. g) Volcano plot of differentially expressed genes comparing Cth−/− CysF and Cth+/+ CysF in cluster 1. h) Orthogonal validation of adipocyte progenitor changes using FACS analysis of SFAT SVF in Cth+/+ and Cth−/− mice on CTRL and CysF diet for 4 days (n=5–6/group). i) Select top pathways from gene set enrichment comparing Cth−/− CysF vs. Cth+/+ CysF in cluster 1. j) Heatmap of gene expression of select stem and mature adipocyte genes in clusters 0, 1 and 2 showing the impact of cysteine depletion in mice. Data are expressed as mean±SEM. Statistical differences were calculated by 2-way ANOVA with Sidak’s correction for multiple comparisons, and by unpaired t-test (*p<0.05, **p<0.01, ***p<0.001).
Extended Data Figure 4:
Extended Data Figure 4:. Cysteine-depletion mobilizes lipids for thermogenic response independently of thermoneutrality.
a) Quantification of ATGL immunoblot shown in Fig. 3a, Actin was used as a loading control. b-c) Tissue lipidomics of brown adipose depot (BAT) from Cth−/− mice fed CTRL (n=4) or CysF diet (n=5) for 6 days with b) triglycerides (TG) and c) diacylglycerol species highlighted. AU: arbitrary units. d) Core body temperature (CBT) measured in the peritoneal cavity by implantation of Star-Oddi logger of Cth−/− mice fed with CTRL or CysF diet over 6 days and e) average day and night CBT of Cth−/− mice fed with CTRL or CysF diet. Recordings were taken every 30 minutes (n=11 Cth−/− CTRL, n=12 Cth−/− CysF, 3 independent experiments pooled). f) Fgf21 gene expression in the liver of Cth+/+ and Cth−/− mice fed CTRL or CysF diet for 6 days (n=8 Cth+/+ CTRL, n=10 Cth+/+ CysF, n=8 Cth−/− CTRL, n=12 Cth−/− CysF). g-h) Serum levels of g) FGF21 and h) GDF15 in Cth−/− and Cth−/−CHOP−/− mice after 5 days of CysF feeding, measured by ELISA (n=9 Cth−/− and n=7 Cth−/−CHOP−/−). i) SFAT, VFAT and BAT weight normalized to body weight of Cth−/− and Fgf21−/−Cth−/− mice after CysF feeding (n=5/group). j) Respiratory exchange ratio (RER) of Cth−/− and Fgf21−/−Cth−/− mice upon CysF feeding, measured at day 3 and 4 in metabolic cages (n=5/group). k) Ucp1 gene expression in SFAT of Cth−/− and Fgf21−/−Cth−/− mice after 6 days of CysF feeding (n=11–12/group).l) Representative H&E histology images of SFAT showing increased browning at day 6 in Cth+/+ and Cth−/− mice fed CysF diet and housed at 20°C or at 30°C. m) Ucp1 gene expression measured by qPCR in BAT of Cth+/+ and Cth−/− mice fed CysF diet and housed at 20°C or at 30°C for 6 days (n=3–5/group). Data are expressed as mean±SEM. Statistical differences were calculated by 2-way ANOVA with Sidak’s correction for multiple comparisons, and by unpaired t-test (*p<0.05, **p<0.01, ***p<0.001).
Extended Data Figure 5:
Extended Data Figure 5:. Systemic cysteine depletion induced weight-loss is independent of microbiota and canonical thermogenic pathways.
a) Immunoblot analysis of CTH in liver, kidney, subcutaneous (SFAT), visceral (VFAT), brown (BAT) adipose depots, lung, heart, spleen, and thymus. b) Immunoblot analysis of CTH in kidney samples from male and female Cthf/f;Alb-Cre− and Cthf/f;Alb-Cre+ mice and in liver samples from male and female Cthf/f;Adipoq-Cre− and Cthf/f;Adipoq-Cre+ mice. Actin is used as a loading control. c-d) Cysteine serum levels of c) Cthf/f and Alb-Cre;Cthf/f mice and d) Cthf/f and Adipoq-Cre;Cthf/f mice after 5 days of CTRL or CysF diet (n=4–5/group). e-i) Alb-Cre;Cthf/f mice were fed CTRL or CysF diet for 6 days. Schematic summary of changes in the metabolites in the e) serum and in the f) liver. g) Volcano plot of metabolites identified by MS/MS in the liver. h) Schematic summary of changes in the metabolites and i) volcano plot of metabolites identified by MS/MS in the SFAT. Transsulfuration pathway related metabolites are highlighted in red. Cys: cysteine. Met: methionine. SAM: S-adenosyl methionine. SAH: S-adenosyl homocysteine. j) Schematic summary of changes in serum metabolites of Adipoq-Cre;Cthf/f fed with CTRL or CysF diet for 6 days. Blue lines represent measured, but unchanged metabolites, red and green arrows indicate significantly decreased or increased metabolites, respectively (p<0.05). k) Percentage body weight change of Cth+/+ and Cth−/− mice that were co-housed and fed CysF diet for 6 days (n=4/group). l) Accumulated food intake of Cth−/− and Cth−/− Ucp1−/− mice during 6 days of CysF diet (n=7 Cth−/− and n=8 Cth−/− Ucp1−/−). m-n) RNA-seq based expression of genes associated with m) creatine futile cycle (Slc6a8, Gatm, Gamt, Ckmt2, Alpl and Ckb) and n) calcium futile cycle (Atp2a2 and Ryr2) in the SFAT of Cth+/+ and Cth−/− mice fed CTRL or CysF diet for 6 days (n=4/group). o) qPCR gene expression of Sarcolipin and Atp2a2 in the soleus of Cth+/+ and Cth−/− mice fed CTRL or CysF diet for 6 days (n=3 Cth+/+CTRL, n=6 Cth+/+CysF, n=3 Cth+/+CTRL and n=5 Cth+/+CysF). p) RNA-seq based expression of genes associated with triglyceride and fatty acid metabolism (Dgat1, Pnpla2, Lipe, Gk) in the SFAT of Cth+/+ and Cth−/− mice fed CTRL or CysF diet for 6 days (n=4/group). Data are expressed as mean±SEM. Statistical differences were calculated by 2-way ANOVA with Sidak’s correction for multiple comparisons, and by unpaired t-test (*p<0.05, **p<0.01, ***p<0.001).
Extended Data Figure 6:
Extended Data Figure 6:. Cysteine starvation induced browning requires adrenergic signaling.
a) Imaging mass spectrometry of noradrenaline in the BAT of Cth+/+ and Cth−/− fed 6 days of CTRL or CysF diet. b-c) qPCR gene expression of b) Maoa and c) Comt in SFAT of Cth+/+ (n=8) and Cth−/− (n=10) mice fed with CysF diet for 6 days. d) Body composition measured by Echo-MRI on day 6 post diet switch (n=6 Cth−/− HFD-CTRL and n=4 Cth−/− HFD-CysF). e) The glucose tolerance test (GTT) in mice fed control and cysF diet with glucose dose based on lean mass. f) The GTT in Cth−/− after diet switch from HFD-CTRL to HFD-CysF (Cth−/− HFD-CTRL n=19, Cth−/− HFD-CysF, n=20). The glucose administration based on total body-weight. Data are expressed as mean±SEM. Statistical differences were calculated by 2-way ANOVA with Sidak’s correction for multiple comparisons, and by unpaired t-test (*p<0.05, ***p<0.001).
Figure 1:
Figure 1:. Cysteine deficiency induces weight-loss.
a) Principal component analysis of the metabolome of subcutaneous adipose depots (SFAT) of healthy individuals at baseline and after 12 months of caloric restriction (CR) (n=14). b) Metabolite set enrichment analysis shows that compared to baseline, one year of CR in humans activates TSP, with increased cysteine and taurine metabolism. c) Schematic summary of TSP and metabolites from baseline to one year CR, measured in human SFAT. Blue lines indicate unchanged metabolites, green and red arrows indicate significantly increased or decreased metabolites or genes respectively, via paired t-test (p<0.05). d-e) Normalized expression of changes in CTH, and BHMT in human SFAT at baseline, after 12 months, and 24 months of CR. Adjusted p-values were calculated in the differential gene expression analysis in a separate cohort from metabolome analyses in the CALERIE-II trial (n=8). f-g) Change in metabolites in human SFAT at baseline (B) and 12 months of CR. Significance was calculated using paired t-tests (n=14). AU: arbitrary unit. h) Mouse model used to achieve cysteine deficiency utilizing Cth−/− mice fed a Cystine free (CysF) diet. i) Male Cth+/+ and Cth−/− mice were fed control (CTRL) or CysF diets for 6 days (n=5 Cth+/+ CTRL, n=12 Cth+/+ CysF, n=8 Cth−/− CTRL, n=17 Cth−/− CysF, 3 experiments pooled). Percent body weight represented over 6 days of diet. j) Cth−/− mice were fed purified control diet (black line) or a diet containing 75% cysteine (green line) alternately switched to CysF diet (green line with red dots n = 6/group). k) Box plots of metabolites involved in TSP in the serum of Cth−/− mice fed CTRL or CysF diet for 6 days (n=4 Cth−/− CTRL, n=5 Cth−/− CysF). l) Schematic summary of changes in the metabolites in the serum of Cth−/− mice fed CTRL or CysF diet for 6 days. Blue lines represent measured, but unchanged metabolites, red and green arrows indicate significantly decreased or increased metabolites, respectively (p<0.05). m) Box plots of GSSG and threonine quantification in the SFAT of Cth−/− mice fed CTRL or CysF diet for 6 days (n=6/group). n-o) RNA-seq based expression of (n) Gclc, Gss and (o) Bola3 in the SFAT of Cth−/− mice fed with CTRL or CysF for 6 days. p) Analysis of EPR spectra of POBN-lipid radical adducts measured in Folch extracts of VFAT, SFAT and BAT tissues from Cth−/− mice fed with CTRL or CysF diet for 5 days, normalized to 100 mg (n.d=not detectable, n=5–6/group). q) Aconitase activity determined in VFAT, SFAT and BAT tissues from Cth−/− fed with CTRL or CysF diet for 5 days (n=6–7/group). Data are represented as mean ± SEM. Unless mentioned, differences were determined with unpaired t-tests (*p<0.05, **p<0.01, ***p<0.001).
Figure 2:
Figure 2:. Cysteine depletion induces browning of adipose tissue.
a) Representative images of subcutaneous (SFAT) and visceral (VFAT) fat sections stained for UCP1 from Cth−/− mice fed CTRL or CysF diet for 6 days (scale bar=100um). b) Representative H&E-stained sections of SFAT of Cth−/− mice fed CTRL or CysF diet for 6 days or CysF diet followed by Cys-supplemented diet for 4 days (CysF+Cys) (scale bar=100 μm). c) Western blot detection of ATGL and UCP1 in SFAT from Cth−/− mice after 6 days of CTRL or CysF diet or Cys supplementation after CysF-induced weight loss. Actin is used as a loading control. d) qPCR analysis of thermogenic genes in SFAT of Cth+/+ and Cth−/− mice fed CysF diet for 6 days (n=8 Cth+/+ and n=10 Cth−/−). e) Fecal calorie content and f) cumulative food intake of Cth−/− mice fed CTRL or CysF diet for 4 days (n=6/group). g) Linear regression analysis of energy expenditure against body mass during dark cycle at 4, 5 days of weight loss (n=10 Cth+/+ CysF and n=12 Cth−/− CysF). h) Percent body weight change of Cth−/− mice fed with CTRL diet or CysF diet (red line) for 5 days and then switched to Cys-containing diet (orange line) for 3 days (n=6/group). i) Respiratory exchange ratio (RER) measured in metabolic cages, of Cth−/− mice fed with CTRL diet or Cys-containing diet after CysF induced weight loss (n=4–6/group). j) Average food intake of Cth−/− mice fed with CysF diet and then switched to Cys-containing diet for 2 days (n=7/group). Significance was measured with paired t-test. k) Linear regression analysis of energy expenditure against body mass during dark cycle of Cth−/− mice fed with CTRL or Cys-supplemented diet after CysF induced weight loss (n=4–6/group), average values of the first two nights after diet switch. l) t-SNE plot of scRNAseq showing cluster identities from SFAT stromal vascular fraction from Cth−/− mice fed CTRL or CysF diet at day 4 of weight-loss and bar chart showing population fold changes in relative abundance of each cluster comparing Cth−/− CysF vs. Cth−/− CTRL. m) t-SNE plot displaying Pdgfra expression in red across all populations and monocle analysis of clusters 0, 1, and 2, with coloring by pseudotime to show right most cluster giving rise to two separate clusters. Each cluster represented by color in Cth−/− CTRL and Cth−/− CysF. Data are expressed as mean±SEM. Statistical differences were calculated by 2-way ANOVA with Sidak’s correction for multiple comparisons or unpaired t-test (*p<0.05, **p<0.01, ***p<0.001).
Figure 3:
Figure 3:. FGF21 is partially required for cysteine-restriction mediated weight-loss.
a) Western blot detection of lipolysis regulators pHSL, HSL and ATGL in SFAT from Cth−/− mice after 6 days of CTRL or CysF diet, actin is used as loading control. b) Volcano plot of lipid species of BAT showing fold change of triglycerides in Cth−/− mice fed CTRL or CysF diet. c) in vivo measurement of BAT temperature by BIRDS imaging and d) quantification of local temperature differences in BAT compared to surrounding tissue in Cth+/+ and Cth−/− mice on CysF diet for 6 days (n=5/group). e) Serum FGF21 quantification in Cth−/− CTRL (n=23), Cth−/− CysF for 6 days (n=8) and Cth−/− CysF followed with 4 days of Cys supplementation (n=10). f) Serum GDF15 concentrations in Cth−/− CTRL, Cth−/− CysF for 4 days and Cth−/− CysF followed with 3 days of Cys supplementation (n=6/group). g) Immunoblot analysis of CHOP, Calnexin, IRE1a, BiP in the liver of Cth−/− mice fed with CTRL or CysF diet at day 6. Actin was used as loading control. h) Percentage body weight change of Cth−/− and Cth−/−CHOP−/− mice fed with CysF diet for 5 days (n=17 Cth−/− and n=15 Cth−/−CHOP−/−). i) Percentage body weight change of Cth−/− and Fgf21−/−Cth−/− mice fed with CysF diet for 5 days (n=13 Cth−/− and n=18 Fgf21−/−Cth−/−). j) Energy expenditure measured in metabolic cages of Cth−/− and Cth−/− Fgf21−/− mice on days 3–4 of CysF diet (n=5/group). k) Immunoblot analysis of pHSL, HSL, ATGL, and UCP1 in SFAT of Cth+/+, Cth−/− and Cth−/−Fgf21−/− mice fed CysF diet for 6 days. l) Representative H&E stained SFAT sections of Cth−/− and Fgf21−/−Cth−/− mice after 6 days of CysF diet (scale bar=500um). m-p) Cth+/+ and Cth−/− mice were fed with CysF diet and housed at 20°C or 30°C for 6 days. m) Percentage body weight change (n=3 Cth+/+ 20°C, n=4 Cth+/+ 30°C, n=4 Cth−/− 20°C, n=5 Cth−/− 30°C), n) representative images of H&E staining of SFAT sections (scale bar=200um) and o-p) qPCR analysis of thermogenic markers (n=5 Cth+/+ 20°C, n=10 Cth+/+ 30°C, n=6 Cth−/− 20°C, n=11 Cth−/− 30°C). Data are expressed as mean±SEM. Statistical differences were calculated by one-way ANOVA with Tukey’s correction for multiple comparisons or 2-way ANOVA with Sidak’s correction for multiple comparisons or unpaired t-test (*p<0.05, **p<0.01, ***p<0.001).
Figure 4:
Figure 4:. Global cysteine deficiency induced adipose browning is UCP1 independent.
a) Immunoblot analyses of CTH in the liver of male and female Cthf/f Alb:Cre or Alb: Cre+ mice. d) Western blot detection of CTH in the SFAT of male and female Cthf/f Adipoq:Cre or Adipoq:Cre+ mice. c-d) Serum cysteine and cystine determined by LC-MS/MS in c) Alb:Cre+Cthf/f mice and d) Adipoq:Cre;Cthf/f mice after 5 days of CTRL or CysF diet (n=4–5/group). AU: arbitrary units. e-f) Percentage body weight changes of e) Alb-Cre;Cthf/f mice and f) Adipoq-Cre;Cthf/f mice after 5 days of CTRL or CysF diet (n=4–5/group). g-h) Volcano plot of serum metabolites identified by LC-MS/MS in g) Alb-Cre;Cthf/f mice and i) Adipoq-Cre;Cthf/f mice after 5 days of CTRL or CysF diet (n=4–5/group). Transsulfuration pathway related metabolites are highlighted in red. Cys: cysteine. Met: methionine. SAH: S-adenosyl homocysteine. SAM: S-adenosyl methionine. i-k) Cth−/− and Cth−/− Ucp1−/− mice were fed a CysF diet for 6 days (n=8/group). i) Percent body weight change over 6 days of diet. j) Representative H&E histology images of SFAT after 6 days of diet. k) Energy expenditure measured in metabolic cages on days 4 and 5 of CysF diet. l) Core body temperatures (CBT) measured in the peritoneal cavity by implantation of Star-Oddi loggers over 6 days of diet in male Cth−/− and Cth−/− Ucp1−/− mice fed CysF diet. Recordings were taken every 30min and representative day 4 is plotted (n=7 Cth−/−, n=5 Cth−/− Ucp1−/−). m) Immunoblot staining of ATGL, TH, and UCP1 in BAT of Cth−/− and Cth−/− Ucp1−/− fed a CysF diet for 6 days and n) quantification using tubulin as loading control. o) Thermogenic markers gene expression analysis in BAT of Cth−/− and Cth−/− Ucp1−/− mice fed a CysF diet for 6 days, measured by qPCR (n=8 Cth−/−, n=10 Cth−/− Ucp1−/−). p-q) Heatmaps of gene expression of genes involved in creatine, calcium and lipid futile cycles in p) BAT and q) SFAT of Cth−/− and Cth−/− Ucp1−/− mice fed a CysF diet for 6 days (n=15–16/group), quantified by qPCR. Data are expressed as mean±SEM. Statistical differences were calculated by 2-way ANOVA with Sidak’s correction for multiple comparisons, or by unpaired t-test (*p<0.05, **p<0.01, ***p<0.001).
Figure 5:
Figure 5:. Cysteine-elimination induced browning and weight loss requires noradrenergic signaling.
a) Measurement of noradreanaline by orbitrap MS/MS in the SFAT of Cth+/+ and Cth−/− fed 6 days of CTRL or CysF diet (n=5 Cth+/+ CTRL, n=5 Cth+/+ CysF, n=6 Cth−/− CTRL, n=6 Cth−/− CysF). b-d) Cth−/− mice were fed with CysF diet for 5 days and treated daily with a β−3 adrenergic receptor antagonist (L748337) or vehicle (PBS) (n=7/group). b) Percentage body weight change. c) Representative images of hematoxylin and eosin (H&E) staining of SFAT sections (scale bar=50um). d) qPCR gene expression of Ucp1 in BAT depots. e-j) Cth−/− mice that had been fed a high fat diet (HFD) for 12 weeks were switched to a HFD containing (HFD-CTRL) or lacking cystine (HFD-CysF). e) Percentage body weight change after switching to HFD-CysF diet (n=6 Cth−/− HFD-CTRL, n=5 Cth−/− HFD-CysF and n=5 Cth+/+ HFD-CysF). f) Fasting blood glucose measured 1 week post diet switch (Cth−/− HFD-CTRL n=19, Cth−/− HFD-CysF, n=20). g) Linear regression analysis of energy expenditure (EE) against body mass during dark cycle and (h) EE of Cth−/− mice fed with HFD-CTRL or HFD-CysF, average values of nights 4 and 5 of diet switch (n=6 Cth−/− HFD-CTRL, n=5 Cth−/− HFD-CysF). i) Representative histological sections of SFAT and VFAT stained for UCP1, 6 days after diet switch. j) Respiratory exchange ratio (RER) measured in metabolic chambers on days 4 and 5 of diet switch (n=6 Cth−/− HFD-CTRL, n=5 Cth−/− HFD-CysF). k) Q-PCR analysis of inflammatory genes in VFAT macrophages of Cth−/− mice after diet switch to HFD-CTRL or HFD-CysF (n=4/group). Data are expressed as mean±SEM. Statistical differences were calculated by 2-way ANOVA with Sidak’s correction for multiple comparisons, or by unpaired t-test (*p<0.05, **p<0.01, ***p<0.001).

References

    1. Fabbiano S, Suárez-Zamorano N, Rigo D, Veyrat-Durebex C, Stevanovic Dokic A, Colin DJ, Trajkovski M. Caloric Restriction Leads to Browning of White Adipose Tissue through Type 2 Immune Signaling. Cell Metab. 2016. Sep 13;24(3):434–446. - PubMed
    1. Wanders D, Forney LA, Stone KP, Burk DH, Pierse A, Gettys TW. FGF21 Mediates the Thermogenic and Insulin-Sensitizing Effects of Dietary Methionine Restriction but Not Its Effects on Hepatic Lipid Metabolism. Diabetes. 2017. Apr;66(4):858–867. - PMC - PubMed
    1. Chouchani ET, Kazak L, Spiegelman BM. New Advances in adaptive Thermogenesis: UCP1 and Beyond. Cell Metab. 2019. Jan 8;29(1):27–37. - PubMed
    1. Cannon B, Nedergaard J. Brown adipose tissue: function and physiological significance. Physiol Rev. 2004. Jan;84(1):277–359. - PubMed
    1. Spadaro O, Youm Y, Shchukina I, Ryu S, Sidorov S, Ravussin A, Nguyen K, Aladyeva E, Predeus AN, Smith SR, Ravussin E, Galban C, Artyomov MN, Dixit VD. Caloric restriction in humans reveals immunometabolic regulators of health span. Science. 2022. Feb 11;375(6581):671–677. - PMC - PubMed

Publication types

LinkOut - more resources