[Preprint]. 2024 Aug 8:rs.3.rs-4849400.
doi: 10.21203/rs.3.rs-4849400/v1.

Neoadjuvant cabozantinib restores CD8+ T cells in patients with locally advanced non-metastatic clear cell renal cell carcinoma: a phase 2 trial

Affiliations

Neoadjuvant cabozantinib restores CD8+ T cells in patients with locally advanced non-metastatic clear cell renal cell carcinoma: a phase 2 trial

Mehmet A Bilen et al. Res Sq. .

Update in

  • Neoadjuvant cabozantinib for locally advanced nonmetastatic clear cell renal cell carcinoma: a phase 2 trial.
    Bilen MA, Vo BT, Liu Y, Greenwald R, Davarpanah AH, McGuire D, Shiradkar R, Li L, Midya A, Nazha B, Brown JT, Williams S, Session W, Russler G, Caulfield S, Joshi SS, Narayan VM, Filson CP, Ogan K, Kucuk O, Carthon BC, Del Balzo L, Cohen A, Boyanton A, Prokhnevska N, Cardenas MA, Sobierajska E, Jansen CS, Patil DH, Nicaise E, Osunkoya AO, Kissick HT, Master VA. Bilen MA, et al. Nat Cancer. 2025 Mar;6(3):432-444. doi: 10.1038/s43018-025-00922-5. Epub 2025 Feb 27. Nat Cancer. 2025. PMID: 40016487 Clinical Trial.

Abstract

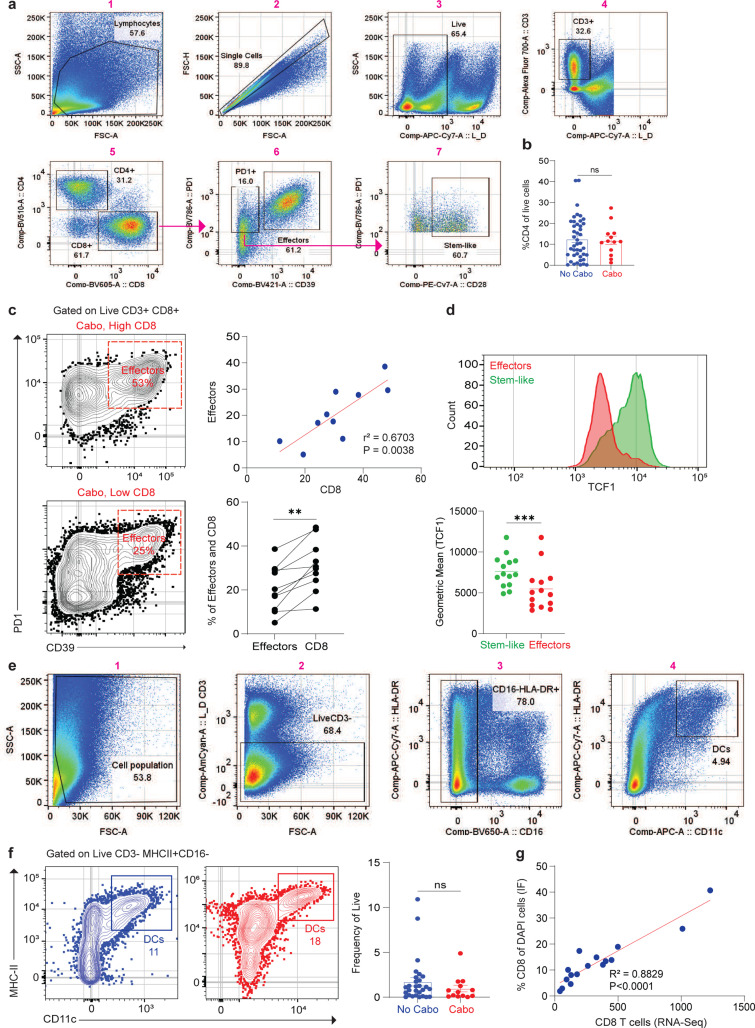
Cabozantinib is an oral multikinase inhibitor approved for treatment in metastatic renal cell carcinoma (RCC). We hypothesized that neoadjuvant cabozantinib could downstage localized tumors, facilitating partial nephrectomy, and facilitating surgery in patients with locally advanced tumors that would require significant adjacent organ resection. We, therefore, conducted a phase 2, single-arm trial of cabozantinib treatment for 12 weeks in 17 patients with locally advanced biopsy-proven non-metastatic clear cell RCC before surgical resection. Six patients (35%) experienced a partial response, and 11 patients (65%) had stable disease. We identified that plasma cell-free DNA (cfDNA), VEGF, c-MET, Gas6, and AXL were significantly increased while VEGFR2 decreased during cabozantinib treatments. There was a trend towards CD8+ T cells becoming activated in the blood, expressing the proliferation marker Ki67 and activation markers HLA-DR and CD38. Cabozantinib treatment depleted myeloid populations acutely. Importantly, immune niches made up of the stem-like CD8+ T cells and antigen presenting cells were increased in every patient. These data suggest that cabozantinib treatment was clinically active and safe in the neoadjuvant setting in patients with locally advanced non-metastatic clear cell RCC and activated the anti-tumor CD8+ T cell response. The trial is registered at ClinicalTrials.gov under registration no. NCT04022343.


Conflict of interest statement

Completing interests M.A.B. has acted as a paid consultant for and/or as a member of the advisory boards of Exelixis, Bayer, BMS, Eisai, Pfizer, AstraZeneca, Janssen, Calithera Biosciences, Genomic Health, Nektar, EMD Serono, SeaGen, and Sanofi and has received grants to his institution from Merck, Xencor, Bayer, Bristol-Myers Squibb, Genentech/Roche, SeaGen, Incyte, Nektar, AstraZeneca, Tricon Pharmaceuticals, Exelixis, Nikang, Loxo Oncology, Ambrx, Regeneron, Acrivon Therapeutics, Amgen, Genome & Company, AAA, Peloton Therapeutics, and Pfizer for work performed as outside of the current study. The other authors declare no competing interests.

Figures

Extended Data Fig. 1|
Extended Data Fig. 1|. The study CONSORT diagram.
a, Flow chart showing details of patients who participated in the study. CONSORT, Consolidated Standards of Reporting Trials.
Extended Data Fig. 2|
Extended Data Fig. 2|. ctDNA and cytokines expressed in plasma.
a, ctDNA detection for each timepoint: Baseline, 30.8% (4/13); W6D1, 42.9% (6/14); Post Tx, 31.3% (5/16); and Post Sx, 9.1% (1/11). b, Percent of ctDNA detected in 16 samples but not in 38 samples. c, Oncomap shows alterations identified in ctDNA at four timepoints. d, Correlation of cfDNA at W6D1 timepoint and the percent change in tumor size at week 6. e, Heatmap of 22 cytokines expression at each timepoints. X indicates samples were not available. cfDNA, cell-free DNA; ctDNA, circulating tumor DNA; W6D1, week 6 day 1.
Extended Data Fig. 3|
Extended Data Fig. 3|. Flow cytometry characterization of immune cells in patient’s peripheral blood after cabozantinib treatment.
a, Gating strategy to identify Ki67+, HLA-DR+ CD38+ and memory subsets (CD45RA and CCR7) on CD4+ and CD8+ T cells. b, Ki67+ expression of CD8+ or CD4+ T cells. Peripheral blood was analyzed by flow cytometry. Flow plots are gated on CD8+ or CD4+ T cells and the expression of Ki67+ cells are displayed in colors. c, Histogram plots show HLA-DR+ and CD38+ T cells expression of Ki67 at four timepoints. Total CD8+ T cells are shown as a control. d and e, Flow plots show HLA-DR+ and CD38+ T cells express Ki67+ in both CD4+ and CD8+ T cells. Overlayed of total CD4+ or CD8+ T cells (blue) that were positive for Ki67 (red) relative positive in the HLA-DR+ and CD38+ cells (purple). Correlation of HLA-DR+ and CD38+ T cells vs. Ki67+ in both CD4+ and CD8+ T cells. f, FACS plot shows cells gated on live and CD3+. The percentage of live PBMCs of CD4+ and CD8+ T cells. g, Correlation of CD8+, HLA-DR+ CD38+ and Ki67 of CD8+ T cells at W6D1 timepoint and the percent change in tumor size at week 6. h, Canonical CD4 memory subsets over treatment period. Cells were gated on CD4 and analyzed for expression of CD45RA and CCR7. i, Canonical CD8 memory subsets were gated on CD8, then CD45RA and CCR7 expression. j, Gating strategy to identify B-cells, monocytes, and dendritic cells. k - m, Expression of CD19 (k), CD71 (l), CD38 and CD20 (m), in the peripheral blood analyzed by flow cytometry. For each summary plot, baseline was set as the untreated level for each patient and fold change in these cells expressed versus this timepoint. Summary of P values are in the Supplementary Tables 6 and 7.
Extended Data Fig. 4|
a, Gating strategy from a representative patient to identify effectors (PD1+CD39+) and stem-like (PD1+ CD39- or PD1+CD28+) of CD8 T cells. b, Summary of CD4+ T cells in historical data (n=52) and Cabo tumors (n=10). Mann-Whitney test was used for the analysis. Data are presented as mean ± SEM. ns, not significant. c, Flow cytometry plots of high and low CD8-infiltrated kidney tumors in cabozantinib treatments. Summary data showing the correlation between CD8 T cells and effectors cells. Wilcoxon matched pair signed rank test was used for the analysis. Effectors vs. CD8 (**, P=0.0020). d, FACS and summary plots of stem-like and effector cells in TCF1 expression. Wilcoxon pair test was used for stem-like vs effectors (***, P=0.0002). e, Gating strategy to identify the expression of DCs (MHC- II+CD11c+). f, Flow cytometry analysis of DCs in historical and cabozantinib tumors. Summary of DCs expression in historical data (n=28) and Cabo tumors (n=13). Statistical analysis resultant as described in b. g, Summary data showing the Spearman correlation of CD8+ T cells from RNA-Seq and CD8+ percent of DAPI from immunofluorescence.
Extended Data Fig. 5|
Extended Data Fig. 5|. Quantitative imaging analysis of patient with and without cabozantinib treatment.
a, H&E tumor image of a cabozantinib treated patient. The tumor was highlighted in red dashed line. Whole slide and single channel immunofluorescences of CD8 (red), MHC-II (cyan), CD4 (white), FOXP3 (orange), aSMA (yellow), and DAPI (blue). b, Workflow for immunofluorescence imaging analysis and immunomap creation. Single channel immunofluorescence images are imported into QuPath software. CD8, CD4, MHC-II, and DAPI objects are identified in the respective channel images. The XY location of each object is exported. R analysis was used to identify CD4+ or CD8+ cells. The TCF-1+ intensity is measured inside the CD8+ objects. These parameters were used to calculate the MHC-II+ cell density. The distance of each CD8+ object was measured to its nearest MHC-II+ neighbor and to create immunomaps using custom R and Python scripts. c, Correlation matrix summary data for quantitative immunofluorescence of cabozantinib tumors. The percentage of CD8+ and TCF1+ of DAPI, CD8+ T cell infiltration, MHC-II+ cell infiltration, immune niche in the tumors, and Ki67+ of CD8 in PBMCs were compared to each subgroup. For example, the percent of CD8+ of DAPI was correlated with percent of immune niche. d-g, Summary data comparing SD and PR patients with percent of CD8+ of DAPI (d), percent of TCF1+ of DAPI (e), CD8+ T cell infiltration (f), MHC-II+ cell infiltration (g) in cabozantinib treated patients. Statistical analysis resultant as described in Fig. 5a. ns, not significant (d-g). PR, partial response; SD, stable disease; H&E, hematoxylin and eosin; DAPI, 4’,6-diamidino-2-phenylindole
Fig. 1|
Fig. 1|. Clinical outcomes of ccRCC patients receiving cabozantinib treatment.
a, Study design of patients with ccRCC were enrolled to receive neoadjuvant cabozantinib for 12 weeks before surgical resection. Peripheral blood was collected at baseline, W6D1, Post Tx, and Post Sx. b, Patients were assessed for clinical response using RECIST criteria. c, Waterfall diagram describing the percentage change in tumor size at week 12 of SD (n = 11) and PR (n = 6) patients. d, Spider plot showing the percentage change in tumor size at week 6 and 12 of SD and PR patients. e, Spider plot shows the average tumor size of a patient’s response to SD and PR. f, MRI imaging showing patient 1 was converted from radical to partial nephrectomy. Patient 2 was deemed to be unresectable became resectable at the end of treatment. g, Tumor sample showing area of necrosis, hemorrhage, and hyalinization. h, H&E staining of a) chronic inflammation and giant cells, b) hyalinization and inflammation, c) perivascular hyalinization and d) necrosis. i, DFS and OS for the 17 treated patients. One-year DFS was 82.4% (95% CI = 54.7% - 93.9%). One-year OS was 94.1% (95% CI = 65.0% - 99.1%). ccRCC, clear cell renal cell carcinoma; W6D1, week 6 day 1; RECIST, Response Evaluation Criteria in Solid Tumor; PR, partial response; SD, stable disease; MRI, magnetic resonance imaging; DFS, disease-free survival; OS, overall survival; H&E, hematoxylin and eosin.
Fig. 2|
Fig. 2|. Plasma biomarkers in patients with ccRCC after cabozantinib treatment.
a, cfDNA (ng/mL) was measured at baseline, W6D1, Post Tx, Post Sx. Statistical analysis resultant from Wilcoxon matched-pair signed rank test is shown. Baseline vs. W6D1 (**, P=0.0098) or Post Tx (**, P=0.0049). b, Correlation of cfDNA at Post Tx timepoint and the percent change in tumor size at week 12. c, Heatmap of 22 cytokines expression at four timepoints. d, Measurement of VEGF, VEGF-R2, HGF, c-MET, Gas6, and AXL at 4 timepoints. Wilcoxon matched-pair signed rank test was used for the analysis. VEGF, baseline vs. W6D1 or Post Tx (***, P=0.0005), Post Sx (ns, P=0.2500). VEGF-R2, baseline vs. W6D1 (***, P=0.0010), Post Tx (***, P=0.0005), or Post Sx (ns, P=0.0742). HGF, baseline vs. W6D1 (ns, P=0.9658), Post Tx (ns, P=0.7910), or Post Sx (ns, P=0.3594). c-MET, baseline vs. W6D1 (**, P=0.0049) or Post Tx (ns, P=0.1763), or Post Sx (*, P=0.0195). Gas6, baseline vs. W6D1 (**, P=0.0024), Post Tx (*, P=0.0342), or Post Sx (**, P=0.0039). AXL, baseline vs. W6D1 (**, P=0.0034), Post Tx (**, P=0.0093), or Post Sx (ns, P=0.0742). e, Correlation of VEGF, VEGF-R2, HGF, c-MET, Gas6, and AXL at W6D1 and percent change in tumor size at week 6. f) Representative arterial T1W MRI images of SD and PR patients at baseline and 12 weeks. Blue and cyan dashed lines represent tumor. g) MRI images of SD and PR patients showing radiomic feature map overlays at baseline using Haralick and Gradient measurements. h) Summary data of Haralick and Gradient features in SD and PR patients. The Mann-Whitney test was used for the analysis. Data are presented as mean ± SEM. SD vs. PR (*, P=0.0103) and (*, P=0.0145) for Haralick and Gradient measurements, respectively. W6D1, week 6 day 1; cfDNA, cell-free DNA; VEGF, vascular endothelial growth factor; c-MET, mesenchymal-epithelial transition factor; VEGF-R2, vascular endothelial growth factor-receptor 2; HGF, hepatocyte growth factor.
Fig. 3|
Fig. 3|. Comprehensive analysis of immune cells in patient’s peripheral blood.
a, Ki67+ of CD8+ T cells expression in the peripheral blood analyzed by flow cytometry. Flow plots are gated on CD8+ T cells and the expression of HLA-DR+CD38+ cells are displayed in colors. Summary plots show fold change in HLA-DR+CD38+ of CD8+ T cells after cabozantinib treatment. b, HLA-DR+CD38+ of CD4+ T cells expression gated on CD4+ T cells. c, Tregs expression in the peripheral blood. Flow plots are gated on CD4+ T cells. d, Flow plots showing expression of NK+ cells. e, Monocyte subsets based on surface markers CD14 and CD16 were identified by flow cytometry in a representative patient. Flow plots are gated on CD19-CD3-CD66b-CD56- cells. Classical monocytes are CD14++CD16-; intermediate monocytes are CD14++CD16+; and non-classical monocytes are CD14+CD16+. f, Expression of DCs (MHC-II+CD11c+) in the peripheral blood. Baseline was set as the untreated level for each patient and fold change in these cells expressed versus this timepoint. Statistical analysis resultant from Wilcoxon pair sign rank test was used for the analysis. Summary of P values are in the Supplementary Table 7.
Fig. 4|
Fig. 4|. T cells activation in patient’s tumors.
a, Immunofluorescence tumor images of CD4 (white), CD8 (red), and DAPI (blue) in control (historical data), Pre Tx (biopsy), and Post Tx (cabozantinib treatments) groups. b, Summary quantitative immunofluorescence data of CD4 and CD8 percent of DAPI in the control (CD4, n=10 and CD8, n=21), Pre Tx (n=12), and Post Tx (n=16) groups. Statistical analysis resultant from Mann-Whitney test is shown. Data are presented as mean ± SEM. Control vs. Post Tx (***, P=0.0002). Wilcoxon matched pair signed rank test was used for Pre Tx vs. Post Tx (***, P=0.0005). c, Representative plots showing activated CD8+ T cells in human ccRCC T3N0M0 tumors. Blue color represents historical published data (No Cabo) and red color represents tumors of patients treated with cabozantinib (Cabo). Summary of CD8+ T cells in historical data (No Cabo, n=52) and Cabo tumors (Cabo, n=10). Statistical analysis resultant from Mann-Whitney test is shown. No Cabo vs. Cabo (**, P=0.0036). d, Flow cytometry plots showing expression of stem-like and effectors in historical data and cabozantinib tumors. e and f, Summary of stem-like (e) and effector cells (f) in historical data (n=36) and Cabo tumors (n=12). Statistical analysis resultant from Mann-Whitney test is shown. No Cabo vs. Cabo (*, P=0.0161) in e. g, Results of GSEA showing pathways that are negatively and positively correlated with CD8+ T cell infiltration. h, Summary of heat maps showing enriched gene sets in inflammasome, antigen processing/cross presentation, CD28 family co-stimulation, and TCR signaling of patients ordered by level of CD8+ T cell infiltration. ns, not significant; SEM, standard error of the mean; ccRCC, clear cell renal cell carcinoma; DAPI, 4’,6-diamidino-2-phenylindole; GSEA, gene set enrichment analysis.
Fig. 5|
Fig. 5|. Cabozantinib treatments active CD8+ T cells in patient’s tumors.
a, Immunofluorescence tumor images of representative patients in control, Pre Tx, and Post Tx groups. CD8 (red), TCF1 (green), and DAPI (blue). b, Summary data comparing TCF1 percent of DAPI in Control (Blue, n=10), Pre Tx (Green, n=12), and Post Tx (Red, n=16) groups. The Mann-Whitney test was used. Data are presented as mean ± SEM. Control vs. Post Tx (*, P=0.0122). Wilcoxon matched pair signed rank test was used for Pre Tx vs. Post Tx (**, P=0.0093). c and d, Quantitative analysis of immunofluorescence of CD8+ T cells, TCF1+ of CD8+T cells and MHC-II+ cells. Spatial plots show each of these subsets are found in the tumor and summary plots show the proportion of these cells in tumors of representative patients who received cabozantinib compared to the Control and Pre Tx groups. Statistical analysis resultant as described in b. For c, Control vs. Pre Tx (**, P=0.0056) and Control vs. Post Tx (**, P=0.0018). Wilcoxon matched pair test was used for Pre Tx vs. Post Tx (***, P=0.0005). For d, Control vs. Pre Tx (***, P=0.0001) and Control vs. Post Tx (***, P=0.0001). Wilcoxon matched pair test was used for Pre Tx vs. Post Tx (***, P=0.0005). e, Niches were defined as regions containing ≥ 16 MHC-II+ cells and ≥ 4 TCF1+CD8 T cells in the same area of the whole tumor tissue. Spatial and summary plots of niches in representative patients with cabozantinib treatments versus the Control and Pre Tx groups. Control vs. Pre Tx (ns, not significant); Control vs. Post Tx (**, P=0.0041). The Wilcoxon pair test was used for Pre Tx vs. Post Tx (***, P=0.0010). f, SD and PR patients with high and low CD8+ T cell infiltration. H&E images of the whole slide. The tumor is outlined in red. Whole slide mIF images consist of CD8+ (red), MHC- II (cyan), CD4 (white), FOXP3 (orange), αSMA (yellow), and DAPI (blue). Immunomaps illustrating regions of CD8+ (red), TCF1+ of CD8+ (green), MHC-II+ (cyan), and immune niche cell density in tumors. g, Summary data comparing SD and PR patients with percent of niche. Statistical analysis resultant as described in a. SD vs. PR (**, P=0.0075). SEM, standard error of the mean; PR, partial response; SD, stable disease; TCF1, T cell factor 1; H&E, hematoxylin and eosin; DAPI, 4’,6-diamidino-2-phenylindole.

References

    1. Padala S.A., et al. Epidemiology of Renal Cell Carcinoma. World J. Oncol. 11, 79–87 (2020). - PMC - PubMed
    1. Bray F., et al. Global cancer statistics 2018: GLOBOCAN estimates of incidence and mortality worldwide for 36 cancers in 185 countries. CA Cancer J. Clin. 68, 394–424 (2018). - PubMed
    1. King S.C., Pollack L.A., Li J., King J.B. & Master V.A. Continued increase in incidence of renal cell carcinoma, especially in young patients and high grade disease: United States 2001 to 2010. J. Urol. 191, 1665–1670 (2014). - PMC - PubMed
    1. Siegel R.L., Giaquinto A.N. & Jemal A. Cancer statistics, 2024. CA Cancer J. Clin. 74, 12–49 (2024). - PubMed
    1. Motzer R.J., et al. Kidney Cancer, Version 3.2022, NCCN Clinical Practice Guidelines in Oncology. J. Natl. Compr. Canc. Netw. 20, 71–90 (2022). - PMC - PubMed

Publication types

Associated data