[Preprint]. 2024 Aug 5:rs.3.rs-4750449.
doi: 10.21203/rs.3.rs-4750449/v1.

Structure-Informed Design of an Ultra Bright RNA-activated Fluorophore

Affiliations

Structure-Informed Design of an Ultra Bright RNA-activated Fluorophore

John S Schneekloth Jr et al. Res Sq. .

Update in

Abstract

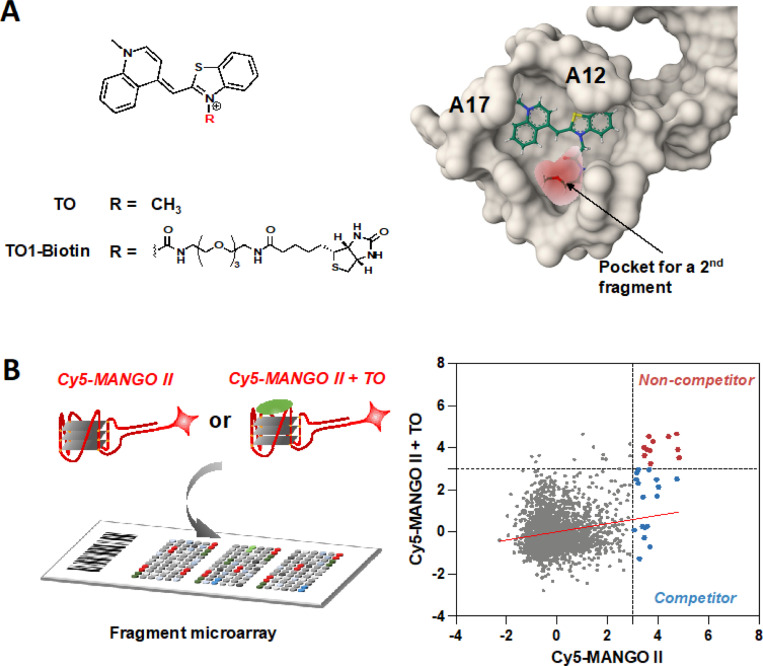
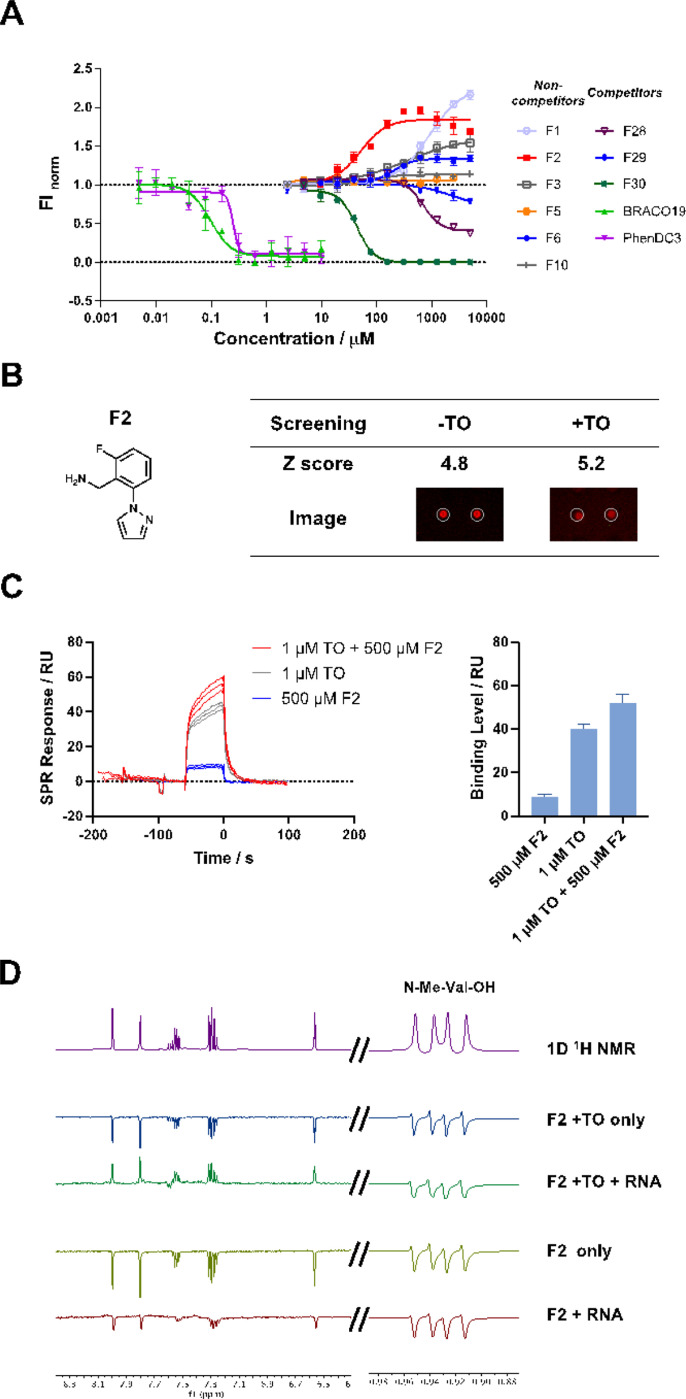
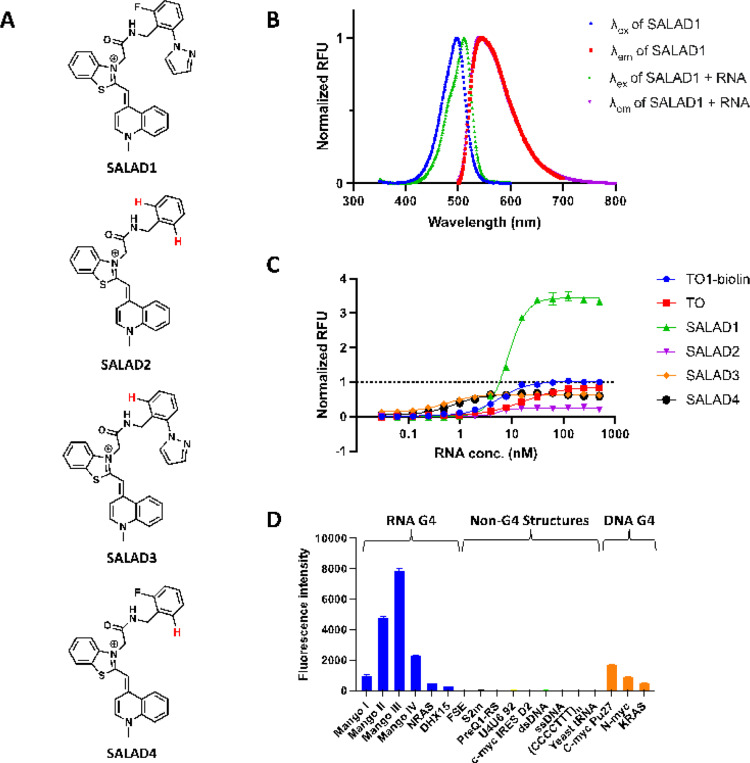
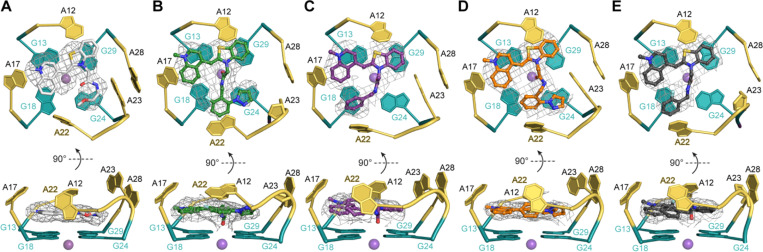
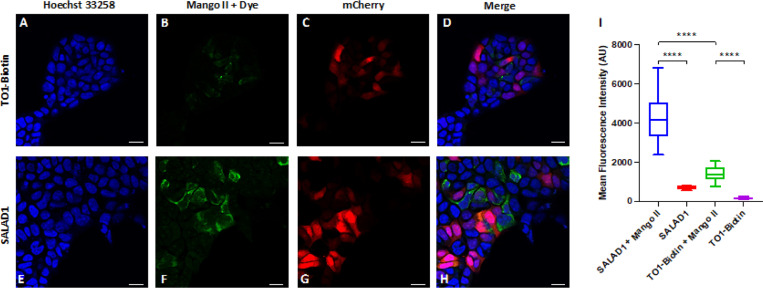
Fluorogenic RNAs such as the Mango aptamers are uniquely powerful tools for imaging RNA. A central challenge has been to develop brighter, more specific, and higher affinity aptamer-ligand systems for cellular imaging. Here, we report an ultra-bright fluorophore for the Mango II system discovered using a structure-informed, fragment-based small molecule microarray approach. The new dye, Structure informed, Array-enabled LigAnD 1 (SALAD1) exhibits 3.5-fold brighter fluorescence than TO1-Biotin and subnanomolar aptamer affinity. Improved performance comes solely from alteration of dye-RNA interactions, without alteration of the chromophore itself. Multiple high-resolution structures reveal a unique and specific binding mode for the new dye resulting from improved pocket occupancy, a more defined binding pose, and a novel bonding interaction with potassium. The dye notably improves in-cell confocal RNA imaging. This work provides both introduces a new RNA-activated fluorophore and also a powerful demonstration of how to leverage fragment-based ligand discovery against RNA targets.


Figures

Figure 1
Figure 1
Structure and fragment-binding to the Mango aptamer. (A) Pocket analysis of Mango II RNA aptamer modeled in presence of TO. (B) Fragment microarray-based screening using Cy5-labeled Mango II RNA (250 nM) with/without competing TO (2.5 μM). Replicate screenings were performed for each sample. Z-score comparison of each fragment as a function of incubation conditions (Mango II vs. Mango II + TO). Fragments bind to the Mango II aptamer in both competitive and non-competitive modes.
Figure 2
Figure 2
Identification of fragments that co-bind RNA with TO. (A) Fluorescence intensity assay using representative non-competitive fragments (F1-F3, F5, F6, and F10) and competitive fragments (F28-F30) discovered by microarray screening. BRACO19 and PhenDC3, as classical G4-binders, were used as controls in the displacement study. (B) Chemical structure of F2 and SMM screening results (Z-scores and spot images). (C) SPR binding assay for injecting TO, F2, and TO + F2 solutions. Three replicate sensorgrams are shown for each condition. (D) WaterLOGSY NMR assays demonstrating F2 binding with Mango II RNA in presence or absence of TO.
Figure 3
Figure 3
Linked fluorescent probes and their photophysical properties. (A) Structures of designed fluorescent probe and analogues. (B) Excitation (λex) and emission (λem) curves of SALAD1 with and without Mango II. (C) Fluorescence intensity assay comparing thiazole orange (TO), TO1-Biotin, and designed analogues. Data are normalized to TO1-Biotin. (D) Selectivity profile comparing fluorescence of SALAD1 (40 nM) in the presence of representative nucleic acid structures.
Figure 4
Figure 4
Top and side views of X-ray crystal structures of the Mango II aptamer binding site complexed with (A) TO1-Biotin (PDB: 6C63), (B) SALAD1, (C) SALAD2, (D) SALAD3, and (E) SALAD4. A22 is marked in yellow; purple spheres represent K+. Gray meshes depicts |Fo| − |Fc| electron density map before building the fluorophores, contoured at 1.0 σ.
Figure 5
Figure 5
Confocal imaging of HEK293T cells transiently transfected with a plasmid expressing an mCherry-Mango II x 24 construct and treated with TO1-Biotin (A-D) or SALAD1 (E-H). Hoechst 33258 signal is blue, SALAD1 or TO1-Biotin signal is green, and mCherry signal is red. Scale bar indicates 20 micrometers. (I) Quantification of the fluorescence in B and F by mean fluorescence intensity of SALAD1 or TO1-Biotin in transfected cells (with Mango II) or non-transfected cells. Number of cells used: SALAD1 + Mango II, n=14; SALAD1, n=5; TO1-Biotin + Mango II, n=10; TO1-Biotin, n=5. **** = P-value <0.0001.

Similar articles

References

    1. Yin P, Kuang S, Nie Z. Fluorescent RNA Tags for In Situ RNA Imaging in Living Cells. Analysis & Sensing 2023, 3(5): e202200090.
    1. Trachman RJ, Ferre-D’Amare AR. Tracking RNA with light: selection, structure, and design of fluorescence turn-on RNA aptamers. Q Rev Biophys 2019, 52: e8. - PMC - PubMed
    1. Renaud de la Faverie A, Guedin A, Bedrat A, Yatsunyk LA, Mergny JL. Thioflavin T as a fluorescence light-up probe for G4 formation. Nucleic Acids Res 2014, 42(8): e65. - PMC - PubMed
    1. Armitage BA. Imaging of RNA in live cells. Curr Opin Chem Biol 2011, 15(6): 806–812. - PubMed
    1. Neubacher S, Hennig S. RNA Structure and Cellular Applications of Fluorescent Light-Up Aptamers. Angew Chem Int Ed Engl 2019, 58(5): 1266–1279. - PMC - PubMed

Publication types

LinkOut - more resources