

In silico and in vitro analyses to investigate the effects of vitamin C on VEGF protein
- PMID: 39149519
- PMCID: PMC11325796
- DOI: 10.1016/j.jtumed.2024.06.008
In silico and in vitro analyses to investigate the effects of vitamin C on VEGF protein
Abstract
Objectives: This study was conducted to evaluate the effects of vitamin C on apoptotic and proliferative genes in injured HepG2 cells.
Methods: In silico analysis was performed using molecular docking of chemical compounds with vascular endothelial growth factor (VEGF). The different computational tools used were AutoDock Vina, BIOVIA DISCOVERY studio, and PyMOL. Drug likeness and toxicity were analyzed by SWISS ADMET. Cells that were 60-70% confluent were treated with different concentrations of hydrogen peroxide (H2O2) (100-2000 μM) and ascorbic acid (30, 60, 90 μg/mL). The MTT cell proliferation assay was performed to compare the proliferative potential of HepG2 cells treated with H2O2 or ascorbic acid with untreated HepG2 cells using 96-well plates.
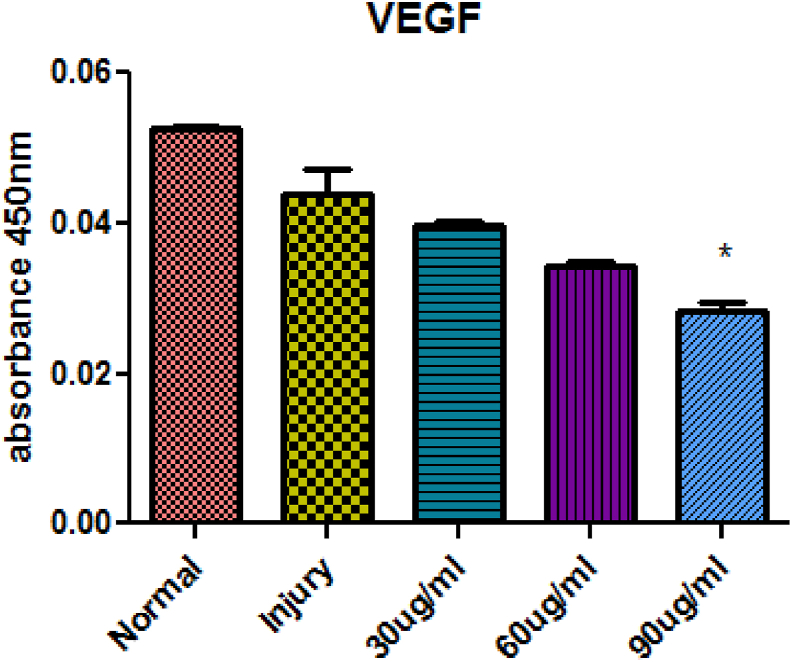
Results: The lowest binding energy of VEGF with vitamin C -5.2 kcal/mol and L-ascorbic acid-2 glycoside -4.7 kcal/mol was observed by in silico analysis. Vitamin C was selected because it exhibited a high interaction with VEGF and fulfilled Lipinski's rule, and had better oral viability and pharmacokinetics compared to L-ascorbic acid-2 glycoside. Cell viability assays showed that vitamin C had significant apoptotic effects (P < 0.0001). After treating HepG2 cells with ascorbic acid, reduced VEGF (angiogenesis) was observed as determined by apoptotic and proliferative gene expression. Ascorbic acid treatment of HepG2 cells led to downregulation of the proliferation markers, proliferating cell nuclear antigen, Ki67, and DNA topoisomerase II alpha. Increased apoptosis after treatment with vitamin C was observed due to upregulation of p53 and annexin V.
Conclusion: The results of this study showed that vitamin C inhibited the growth of cancer cells, thus protecting HepG2 cells from oxidative stress. Vitamin C exhibited antiproliferative activity as observed in silico and in vitro, as well as by the inhibited expression of genes involved in protein synthesis.
أهداف البحث: أجريت هذه الدراسة لتقييم تأثير فيتامين سي على جينات الاستماتة والتكاثر في خلايا "هيب جي 2" المصابة.
طريقة البحث: في تحليل السيليكو تم إجراء استخدام الالتحام الجزيئي للمركبات الكيميائية مع بروتين عامل النمو البطاني الوعائي. الأدوات الحسابية المختلفة المستخدمة هي "أوتودوك فينا" و"بايوفيا ديسكفري ستوديو" و "بايمول". تم تحليل تشابه الأدوية وسميتها بواسطة "سويس أدميت". تمت معالجة التقاء الخلايا – 60-70% بتركيزات مختلفة من "اتش 2 أوه 2" (100-2000 مايكرومولر) وحمض الأسكوربيك (30، 60، 90 ميكروغرام / مل). تم إجراء اختبار موت الخلايا "ام تي تي" لمقارنة الإمكانات التكاثرية لخلايا "هيب جي 2" المعالجة بـ "اتش 2 أوه 2" وحمض الأسكوربيك باستخدام 96 لوحة جيدة.
النتائج: تمت ملاحظة أدنى طاقة ربط لـ بروتين عامل النمو البطاني الوعائي مع فيتامين سي -5,2 كيلو كالوري/مول وحمض الأسكوربيك-2 جليكوسيد -4.7 كيلو كالوري/مول في تحليل السيليكو. تم اختيار فيتامين سي لأنه يظهر تفاعلا عاليا مع بروتين عامل النمو البطاني الوعائي ويحقق قاعدة ليبينسكي، والقدرة على البقاء عن طريق الفم، والحركية الدوائية مقارنة بجليكوسيد حمض الأسكوربيك. أظهرت فحوصات صلاحية الخلية أن فيتامين سي كان له تأثيرات موت الخلايا المبرمج. بعد معالجة خلايا "هيب جي 2" بحمض الأسكوربيك، لوحظ انخفاض بروتين عامل النمو البطاني الوعائي (تكوين الأوعية) من خلال التعبير الجيني للموت المبرمج والتكاثري. أدى علاج حامض الأسكوربيك لخط خلايا "هيب جي 2" إلى تنظيم علامات التكاثر "بي سي ان ايه" و "كي آي 67" و تي أوه بي 2 ايه". وقد لوحظت زيادة في موت الخلايا المبرمج بعد العلاج بفيتامين سي بسبب تنظيم "بي53" و "أنيكسين في".
الاستنتاجات: بناء على النتائج، من الواضح أن فيتامين سي يثبط نمو الخلايا السرطانية وبالتالي يحمي خلايا "هيب جي 2" من الإجهاد التأكسدي. أظهر فيتامين سي نشاطا مضادا للتكاثر كما لوحظ في السيليكو، وفي المختبر، وكذلك النتائج المحتملة من تثبيط التعبير عن الجينات المشاركة في تخليق البروتين.
Keywords: Apoptosis; Cell cycle; Gene upregulation; Proliferative genes; Vitamin C.
© 2024 The Authors.
Figures


Similar articles
-
Antibacterial and Antioxidant Efficacies of Secondary Metabolites from the Roots of Cyphostemma adenocaule: A Combined In Vitro and In Silico Study.J Trop Med. 2024 Mar 6;2024:1679695. doi: 10.1155/2024/1679695. eCollection 2024. J Trop Med. 2024. PMID: 38482509 Free PMC article.
-
Chemical Characterization, In-silico Evaluation, and Molecular Docking Analysis of Antiproliferative Compounds Isolated from the Bark of Anthocephalus cadamba Miq.Anticancer Agents Med Chem. 2022;22(20):3416-3437. doi: 10.2174/1871520622666220204123348. Anticancer Agents Med Chem. 2022. PMID: 35125087
-
Hepatoprotective potency of Litsea glutinosa (L.) C.B. Rob. leaf methanol extract on H2O2-induced toxicity in HepG2 cells.J Ethnopharmacol. 2023 Mar 25;304:116076. doi: 10.1016/j.jep.2022.116076. Epub 2022 Dec 22. J Ethnopharmacol. 2023. PMID: 36567040
-
Anticancer potential of Phoenix dactylifera L. seed extract in human cancer cells and pro-apoptotic effects mediated through caspase-3 dependent pathway in human breast cancer MDA-MB-231 cells: an in vitro and in silico investigation.BMC Complement Med Ther. 2022 Mar 15;22(1):68. doi: 10.1186/s12906-022-03533-0. BMC Complement Med Ther. 2022. PMID: 35291987 Free PMC article.
-
Identification of Kaempferol as Viral Entry Inhibitor and DL-Arginine as Viral Replication Inhibitor from Selected Plants of Indian Traditional Medicine against COVID-19: An in silico Guided in vitro Approach.Curr Comput Aided Drug Des. 2023;19(4):313-323. doi: 10.2174/1573409919666230112123213. Curr Comput Aided Drug Des. 2023. PMID: 36635906
Cited by
-
Vitamin C in Cardiovascular Disease: From Molecular Mechanisms to Clinical Evidence and Therapeutic Applications.Antioxidants (Basel). 2025 Apr 23;14(5):506. doi: 10.3390/antiox14050506. Antioxidants (Basel). 2025. PMID: 40427388 Free PMC article. Review.
-
Identifying novel inhibitors against drug-resistant mutant CYP-51 Candida albicans: A computational study to combat fungal infections.PLoS One. 2025 Mar 4;20(3):e0318539. doi: 10.1371/journal.pone.0318539. eCollection 2025. PLoS One. 2025. PMID: 40036223 Free PMC article.
-
Identification and evaluation of pyrimidine based CDK6 inhibitors against glioblastoma using integrated computational approaches.Sci Rep. 2025 Jul 14;15(1):25387. doi: 10.1038/s41598-025-10744-1. Sci Rep. 2025. PMID: 40659725 Free PMC article.
References
-
- Little M., Jordens C.F., Paul K., Montgomery K., Philipson B. Liminality: a major category of the experience of cancer illness. J Bioeth Inq. 2022;19(1):37–48. - PubMed
-
- Birkbak N.J., McGranahan N. Cancer genome evolutionary trajectories in metastasis. Cancer Cell. 2020;37(1):8–19. - PubMed
-
- Chen X., Liu R., Liu X., Xu C., Wang X. L-ascorbic Acid-2-Glucoside inhibits Helicobacter pylori-induced apoptosis through mitochondrial pathway in Gastric Epithelial cells. Biomed Pharmacother. 2018;97:75–81. - PubMed
LinkOut - more resources
Full Text Sources
Research Materials
Miscellaneous
