. 2024 Jul 23:41:221-238.
doi: 10.1016/j.bioactmat.2024.07.026. eCollection 2024 Nov.

Synergistic rheumatoid arthritis therapy by interrupting the detrimental feedback loop to orchestrate hypoxia M1 macrophage polarization using an enzyme-catalyzed nanoplatform

Affiliations

Synergistic rheumatoid arthritis therapy by interrupting the detrimental feedback loop to orchestrate hypoxia M1 macrophage polarization using an enzyme-catalyzed nanoplatform

Dong Guo et al. Bioact Mater. .

Abstract

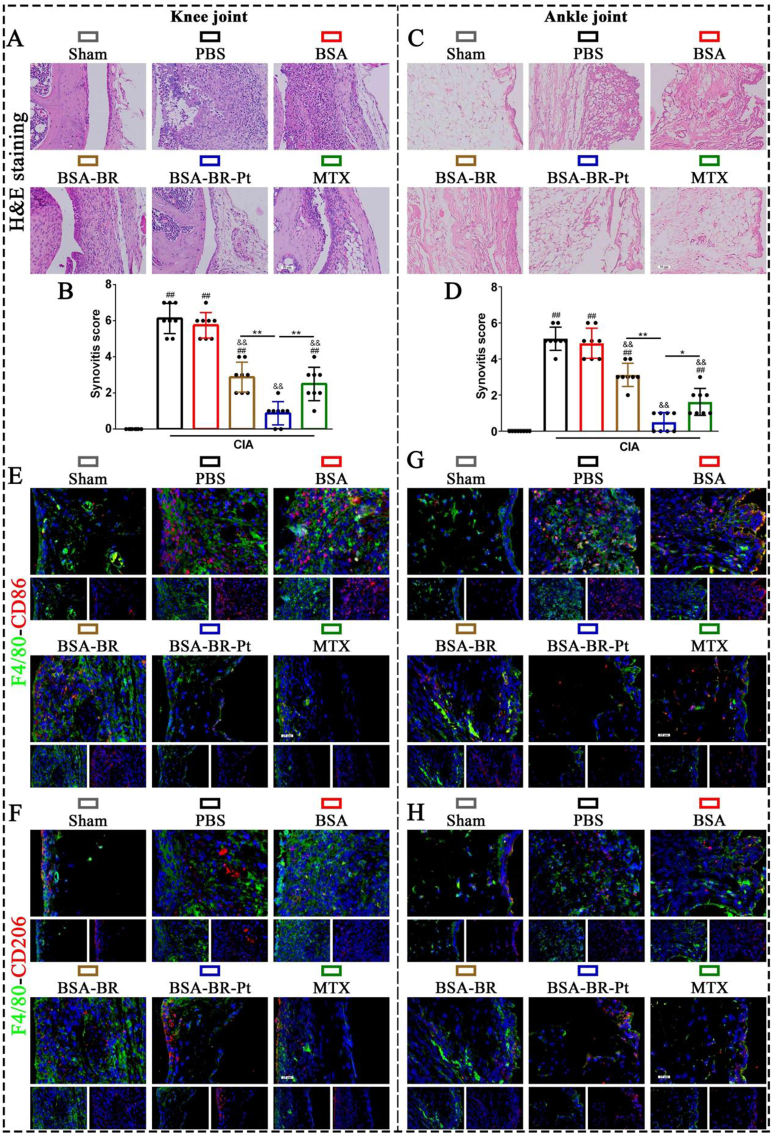
A detrimental feedback loop between hypoxia and oxidative stress consistently drives macrophage polarization toward a pro-inflammatory M1 phenotype, thus persistently aggravating rheumatoid arthritis (RA) progression. Herein, an enzyme-catalyzed nanoplatform with synergistic hypoxia-relieving and reactive oxygen species (ROS)-scavenging properties was developed using bovine serum albumin-bilirubin-platinum nanoparticles (BSA-BR-Pt NPs). Bilirubin was employed to eliminate ROS, while platinum exhibited a synergistic effect in scavenging ROS and simultaneously generated oxygen. In mice RA model, BSA-BR-Pt NPs treatment exhibited superior effects, resulting in significant improvements in joint inflammation, cartilage damage, and bone erosion, compared to methotrexate, the most widely used antirheumatic drug. Mechanistically, RNA-sequencing data and experimental results elucidated that BSA-BR-Pt NPs induced a re-polarization of hypoxic M1 macrophages to M2 macrophages via switching glycolysis to oxidative phosphorylation through the inhibition of HIF-1α pathway. Collectively, this research for the first time elaborated the underlying mechanism of enzyme-catalyzed nanoplatform in orchestrating macrophage polarization, and identified a novel therapeutic strategy for RA and other inflammatory disorders.

Keywords: Hypoxia; Macrophage; Metabolic regulation; Nanoplatform; Oxidative stress; Rheumatoid arthritis.


Conflict of interest statement

The authors assert that the research was carried out without any commercial or financial affiliations that could be perceived as a possible conflict of interest. Fig. 6A is created using Figdraw (www.figdraw.com).

Figures

Image 1
Graphical abstract
Scheme 1
Scheme 1
Schematic depiction of BSA-BR-Pt NPs preparation and therapeutic mechanism against rheumatoid arthritis. The enzyme-catalyzed nanoplatform with synergistic O2-generating and ROS-scavenging properties reprograms hypoxic M1 macrophages towards M2 via modulating metabolic pathway from glycolysis to oxidative phosphorylation through the HIF-1α pathway. Ultimately, this reprogramming attenuates synovitis, aberrant angiogenesis, cartilage degeneration, and bone erosion, providing a comprehensive treatment approach for RA.
Fig. 1
Fig. 1
Preparation and characterization of BSA-BR-Pt NPs. (A, B) TEM images of BSA-BR NPs (A) and BSA-BR-Pt NPs (B). (C, D) Hydrodynamic sizes of BSA-BR NPs (C) and BSA-BR-Pt NPs (D). n = 3 per group. (E, F) Hydrodynamic sizes (E) and zeta potential (F) of BSA, BSA-BR NPs, and BSA-BR-Pt NPs. (G, H) UV–Vis absorption spectra (G) and FTIR spectra (H) of BR, BSA-BR NPs, and BSA-BR-Pt NPs.
Fig. 2
Fig. 2
ROS scavenging and O2 generation by BSA-BR NPs and BSA-BR-Pt NPs. (AE) UV–Vis spectra of MB for •OH level detection with (A) 0 ppm, (B) 50 ppm, (C) 100 ppm, (D) 200 ppm, and (E) 400 ppm of BSA-BR NPs. (F) The relative intensity decrease of MB absorption peak in the presence of BSA-BR NPs with different concentrations after 4 h reaction. (G) H2O2 level detection in the presence of BSA-BR NPs and BSA-BR-Pt NPs with different concentrations. (H) O2 production detection in the presence of BSA-BR-Pt NPs with different concentrations.
Fig. 3
Fig. 3
The decrease of HIF-1α levels and O2 generation in hypoxic M1 macrophages treated with BSA-BR-Pt NPs. (A, B) Representative CLSM images and relative fluorescence intensity of BSA-BR-Pt NPs internalized by BMDMs following 5-FAM labeling. Scale bar: 50 μm. (C, D) Representative fluorescence images and quantification of various treatments on BMDMs stained with Calcein-AM/PI. Green and red represent live and dead cells respectively. Scale bar: 50 μm. (E, F) Representative CLSM images and relative fluorescence intensity of the oxygen indicator [Ru(dpp)3]Cl2 in BMDMs with various treatment. The red fluorescence emitted by the dye was attenuated in the presence of oxygen. LH indicates LPS and hypoxia. Scale bar: 25 μm. (G, H) Representative CLSM images and quantification of various treatments of BMDMs stained with HIF-1α and F-Actin. Scale bar: 20 μm. Normoxia as the control group. #, & and * indicate significant differences when compared with the control, LH + BSA and LH + BSA-BR-Pt NPs, respectively (##, &&, **P < 0.01).
Fig. 4
Fig. 4
ROS scavenging of BSA-BR-Pt NPs in hypoxic M1 macrophages. (A, B) Representative fluorescence images and relative fluorescence intensity of various treatments of BMDMs stained with ROS fluorescent probe DCFH-DA. LH indicates LPS and hypoxia. Scale bar: 100 μm. (C, D) Representative fluorescence images and relative fluorescence intensity of various treatments of BMDMs stained with •OH fluorescent probe. Scale bar: 25 μm. (E, F) Representative CLSM images and relative fluorescence intensity of intracellular H2O2 in BMDMs with various treatment. Scale bar: 50 μm #, & and * indicate significant differences when compared with the control, LH + BSA and LH + BSA-BR-Pt NPs, respectively (##, &&, **P < 0.01).
Fig. 5
Fig. 5
BSA-BR-Pt NPs reprogram M1 polarized macrophages to M2 polarized macrophages. (AD) Representative immunofluorescence staining and quantification of F4/80 (green) with CD86 (red) (A and B) or CD206 (red) (C and D), and nuclei (blue) on BMDMs treated with different treatment. Scale bar: 25 μm. (E) Immunoblot analysis of HIF-1α, NOS2, CD86, CD206, and Arg-1 in different treated-BMDMs. (F) qRT-PCR analysis of HIF-1α, CD86, and CD206 mRNA expression in BMDMs with various treatment. #, & and * indicate significant differences when compared with the control, LH + BSA and LH + BSA-BR-Pt NPs, respectively (##, &&, **P < 0.01).
Fig. 6
Fig. 6
Therapeutic effect of BSA-BR-Pt NPs in CIA mice. (A) The schematic illustration of BSA-BR-Pt NPs treatment. (B) Representative photographs of joints in CIA mice before and after different treatment. (C) Inflammatory joint paw thickness over time for various treatments. (D, E) The statistic result of paw thickness (D) and joint diameter (E) between different treatments at day 60 following immunization. #, & and * indicate significant differences when compared with the sham, PBS, and BSA-BR-Pt NPs groups, respectively (##, &&, **P < 0.01).
Fig. 7
Fig. 7
Treatment of BSA-BR-Pt NPs attenuates synovitis and reprograms macrophage polarization in CIA mice. (AD) Representative images and quantified analysis of H&E staining in the knee and ankle joints of CIA mice with different treatment. Scale bar: 50 μm. (EH) Representative images of coimmunostaining of F4/80 with CD86 or CD206 in the knee and ankle joints of CIA mice with different treatment. Scale bar: 25 μm #, & and * indicate significant differences when compared with the sham, PBS, and BSA-BR-Pt NPs groups, respectively (*P < 0.05 and ##, &&, **P < 0.01).
Fig. 8
Fig. 8
Treatment of BSA-BR-Pt NPs mitigates cartilage degeneration and bone erosion in CIA mice. (AL) Representative images and quantified analysis of safranin O and fast green staining (A and B), TRAP staining (C and D) and micro-CT (E and F) in the knee (G–K) and ankle (H–L) joints of CIA mice with different treatment. Scale bar: 50 μm and 100 μm #, & and * indicate significant differences when compared with the sham, PBS, and BSA-BR-Pt NPs groups, respectively (*P < 0.05 and ##, &&, **P < 0.01).
Fig. 9
Fig. 9
RNA-seq analysis of hypoxic M1 polarized macrophages treated with BSA-BR-Pt NPs. (A, B) Volcano plot and number of DEGs of all genes identified in this study. Red and blue dots indicate up- or down-regulated genes significantly, respectively (|log2FC| ≥ 1 and Q-value of <0.05). (C) Representative GO analysis (biological process) of DEGs from LH_BBP vs. LH_Ctrl (|log2FC| ≥ 1 and Q-value of <0.05). (D, E) Heat map of DEGs from LH_BBP vs. LH_Ctrl in cellular response to hypoxia (D) and response to hypoxia (E) in the biological process. (F) qRT-PCR analysis of Hif3a mRNA expression in BMDMs from LH_BBP vs. LH_Ctrl. (GI) Representative images and quantified analysis of Hif3a and Hk3 IHC staining in the synoivum of CIA mice with different treatment. Scale bar: 50 μm. (J) Heat map of DEGs from LH_BBP vs. LH_Ctrl in HIF-1α pathway. (K) qRT-PCR analysis of Hk3 mRNA expression in BMDMs from LH_BBP vs. LH_Ctrl. #, & and * indicate significant differences when compared with the sham, PBS, and BSA-BR-Pt NPs groups, respectively (*P < 0.05 and ##, &&, **P < 0.01).

References

    1. Geng W., Zhao J., Tao B., Yang Y., Duan Q., Gao P., He T., Liu S., Feng Q., Zhao P., Cai K. Regulation of rheumatoid arthritis microenvironment via a self-healing injectable hydrogel for improved inflammation elimination and bone repair. Bioact. Mater. 2024;36:287–300. doi: 10.1016/j.bioactmat.2024.03.002. - DOI - PMC - PubMed
    1. Geng W., Liu X., Tao B., He Y., Li K., Gao P., Feng Q., Zhao P., Luo Z., Cai K. Nitric Oxide scavenging and hydrogen Sulfide production synergistically Treat rheumatoid arthritis. Adv. Healthcare Mater. 2023;12(4) doi: 10.1002/adhm.202202380. - DOI - PubMed
    1. Xu Y., Li Y., Gao A., Chu P.K., Wang H. Gasotransmitter delivery for bone diseases and regeneration. The Innovation Life. 2023;1(1):100015. doi: 10.59717/j.xinn-life.2023.100015. - DOI
    1. Huang R., Zhang C., Bu Y., Li Z., Zheng X., Qiu S., Machuki J.O., Zhang L., Yang Y., Guo K., Gao F. A multifunctional nano-therapeutic platform based on octahedral yolk-shell Au NR@CuS: Photothermal/photodynamic and targeted drug delivery tri-combined therapy for rheumatoid arthritis. Biomaterials. 2021;277 doi: 10.1016/j.biomaterials.2021.121088. - DOI - PubMed
    1. Alivernini S., Firestein G.S., McInnes I.B. The pathogenesis of rheumatoid arthritis. Immunity. 2022;55(12):2255–2270. doi: 10.1016/j.immuni.2022.11.009. - DOI - PubMed

LinkOut - more resources