. 2024 Sep 23;52(17):e82.
doi: 10.1093/nar/gkae687.

Improved sub-genomic RNA prediction with the ARTIC protocol

Affiliations

Improved sub-genomic RNA prediction with the ARTIC protocol

Thomas Baudeau et al. Nucleic Acids Res. .

Abstract

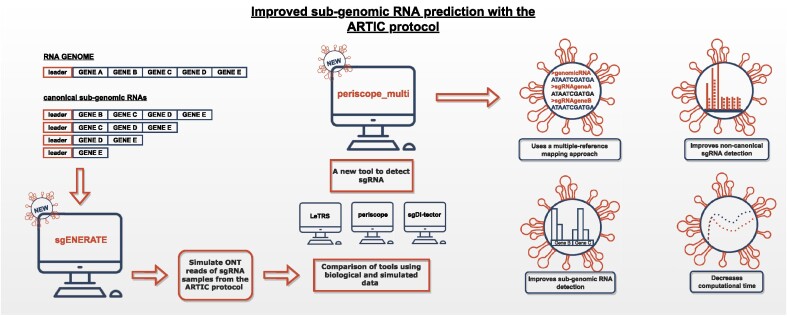
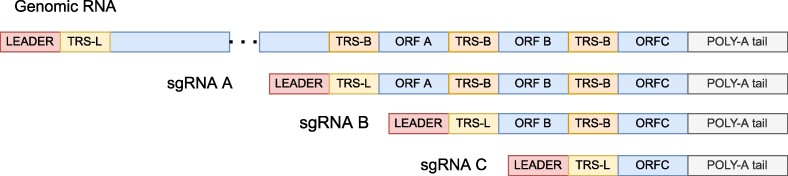
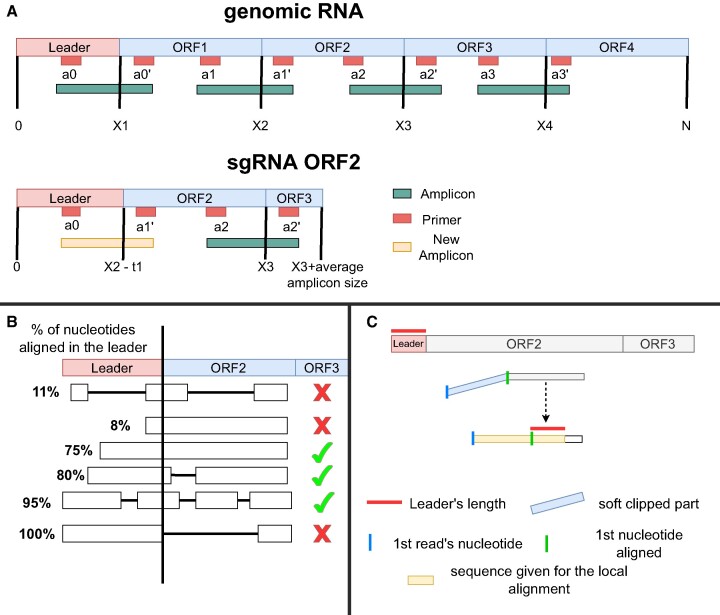
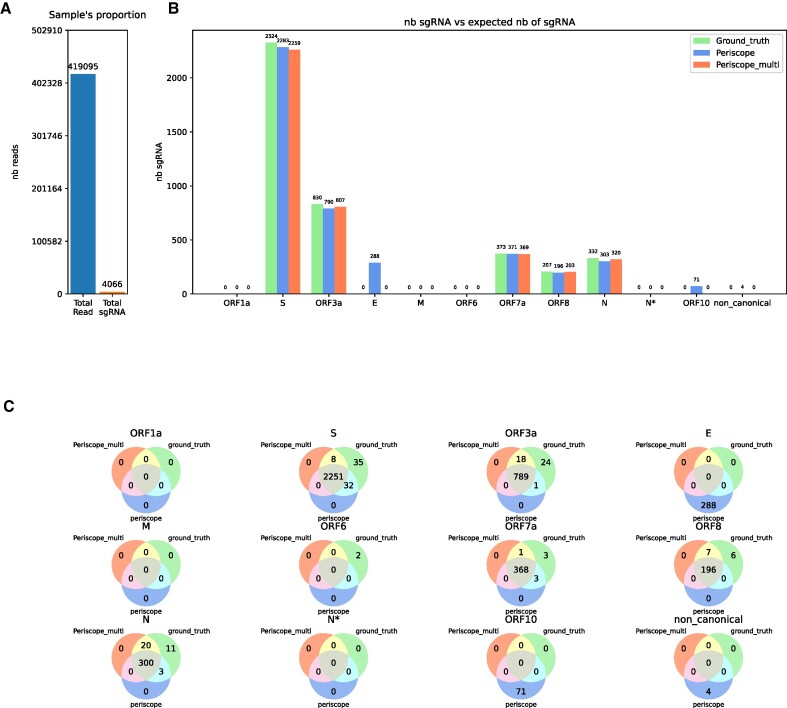
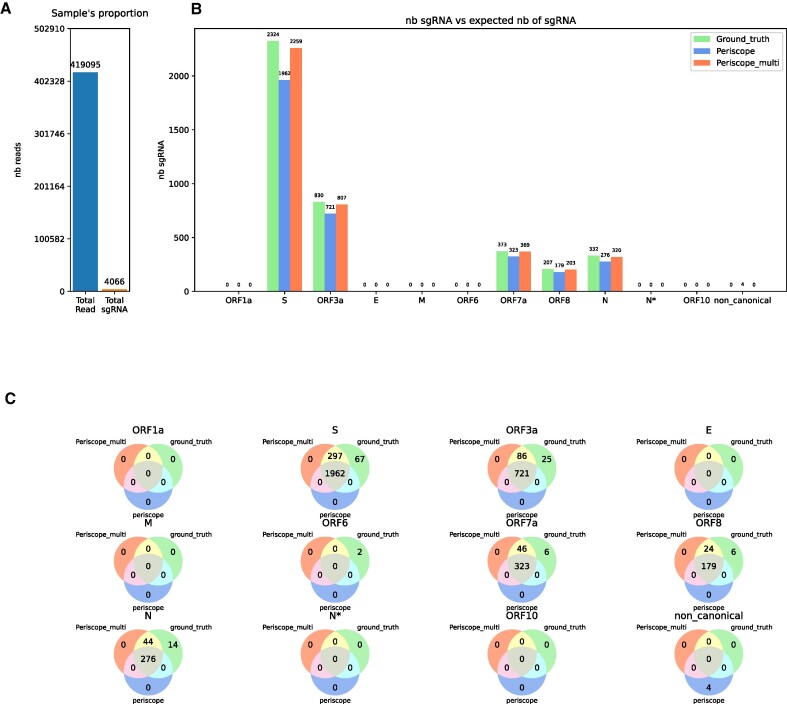
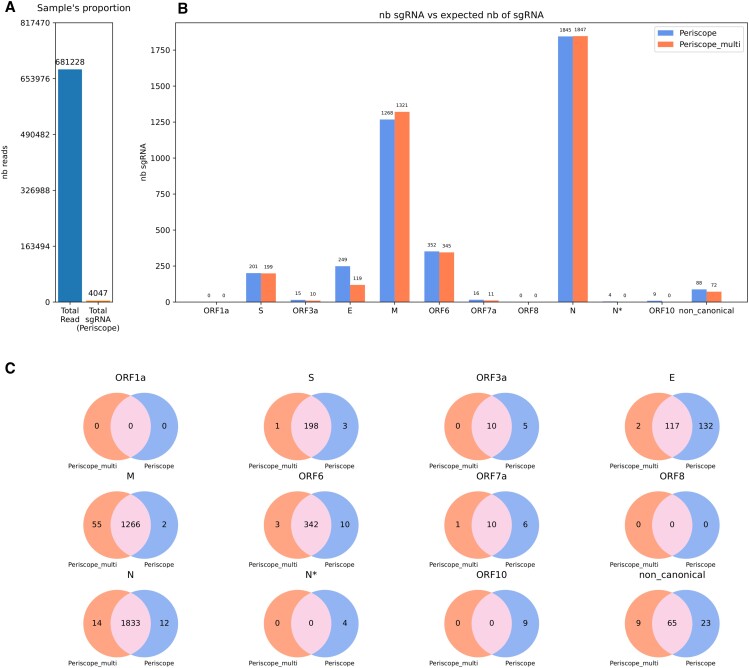
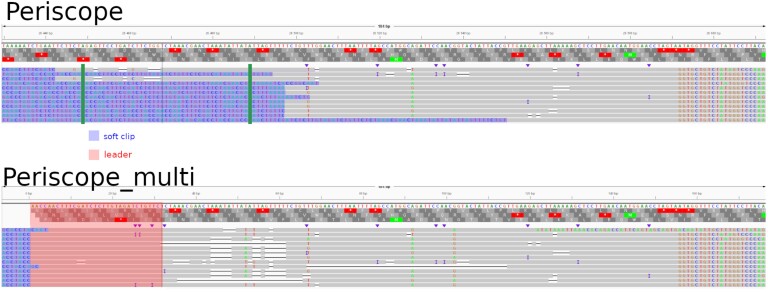
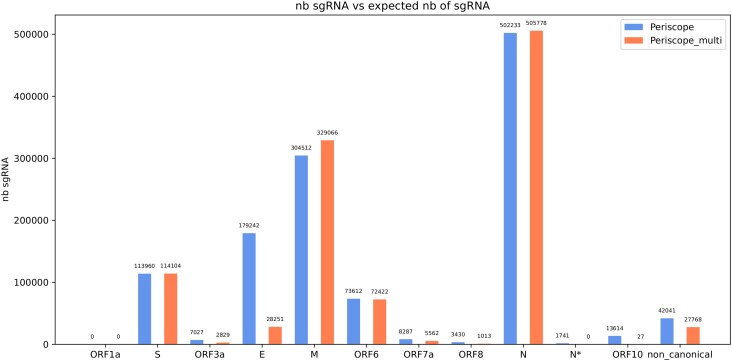
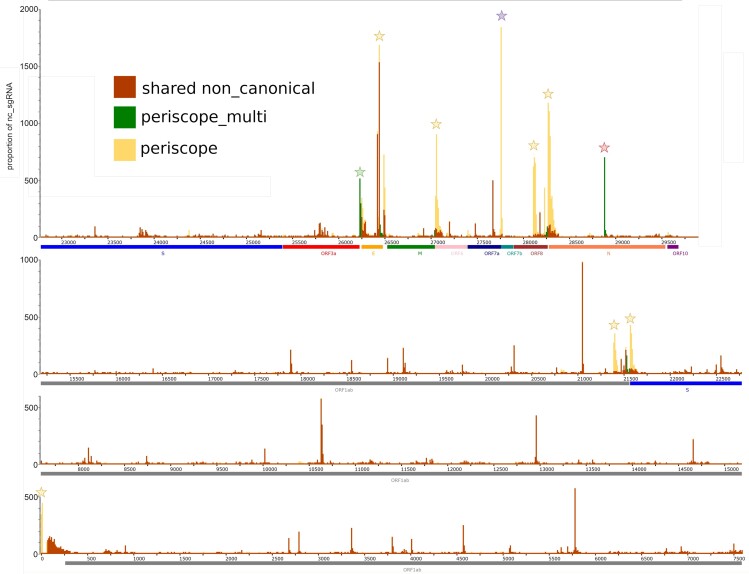
Viral subgenomic RNA (sgRNA) plays a major role in SARS-COV2's replication, pathogenicity, and evolution. Recent sequencing protocols, such as the ARTIC protocol, have been established. However, due to the viral-specific biological processes, analyzing sgRNA through viral-specific read sequencing data is a computational challenge. Current methods rely on computational tools designed for eukaryote genomes, resulting in a gap in the tools designed specifically for sgRNA detection. To address this, we make two contributions. Firstly, we present sgENERATE, an evaluation pipeline to study the accuracy and efficacy of sgRNA detection tools using the popular ARTIC sequencing protocol. Using sgENERATE, we evaluate periscope, a recently introduced tool that detects sgRNA from ARTIC sequencing data. We find that periscope has biased predictions and high computational costs. Secondly, using the information produced from sgENERATE, we redesign the algorithm in periscope to use multiple references from canonical sgRNAs to mitigate alignment issues and improve sgRNA and non-canonical sgRNA detection. We evaluate periscope and our algorithm, periscope_multi, on simulated and biological sequencing datasets and demonstrate periscope_multi's enhanced sgRNA detection accuracy. Our contribution advances tools for studying viral sgRNA, paving the way for more accurate and efficient analyses in the context of viral RNA discovery.


Figures

Graphical Abstract
Graphical Abstract
Figure 1.
Figure 1.
Schematic representation of SARS-COV2 genomic RNA and sgRNA. Top sequence shows the full genomic RNA. The bottom three sequences are three examples of the generated sgRNA for the A, B and C genes.
Figure 2.
Figure 2.
Panel A shows the construction of each sgRNA for the new reference in periscope_multi. The red segments represent the position of each pair of primers and the green bar are the resulting amplicons. The yellow segment shows the amplicon resulting from the new primer pair of a0 to formula image due to the new location of each primer in the sgRNA. Panel B shows examples of the alignment needed for periscope_multi to consider a read as sgRNA. Panel C shows the local alignment in periscope_multi for three example reads. Only the soft-clipped part of the read plus the leader length is used. The corresponding yellow segments to the left show the sequence given for each of this reads.
Figure 3.
Figure 3.
Result of periscope and periscope_multi on the SIM dataset from sgENERATE with an error rate of formula image. (A) Show the total number of read and the total number sgRNA introduce in the sample. (B) The number of sgRNAs found for each gene by the tools, the blue bar correspond to periscope, the orange to periscope_multi and the green one to the real number of sgRNA in the sample. (C) Venn diagrams showing the proportion of shared reads between periscope, periscope_multi and the ground truth.
Figure 4.
Figure 4.
Result of periscope and periscope_multi on a simulated dataset from sgENERATE with an error rate of formula image without the LLQ-labeled sgRNA for periscope. (A) Show the total number of read and the total number sgRNA introduce in the sample. (B) The number of sgRNAs found for each gene by the tools, the blue bar correspond to periscope, the orange to periscope_multi and the green one to the real number of sgRNA in the sample. (C) Venn diagrams showing the proportion of shared reads between periscope, periscope_multi and the ground truth.
Figure 5.
Figure 5.
Result of periscope and periscope_multi on the BIO-SMALL dataset. (A) The total number of read and the total number of sgRNA found by periscope. (B) The number of sgRNAs found for each gene by the tools, the blue bar correspond to periscope and the orange to periscope_multi. (C) Venn diagrams showing the proportion of shared reads between periscope and periscope_multi.
Figure 6.
Figure 6.
Picture of the different alignments obtained by periscope and periscope_multi Figure shows alignment of reads classified as non-canonical sgRNA by periscope and found as canonical by periscope_multi. The same 12 reads are present in the two pictures but there position differ.The region between the green bar represents ORF area which determines whether a read is subgenomic in periscope, and blue region shows soft-clipped part of the reads. A read alignment has to start in this region between green bars to be considered as a sgRNA, which is not the case for the reads aligned with periscope (upper panel). The red part shows the leader position in periscope_multi, which is softclipped in periscope’s alignments.
Figure 7.
Figure 7.
Result of periscope and periscope_multi with the BIO-LARGE dataset the bar represent of sgRNA found in all the sample, the blue bar correspond to periscope result and the orange to periscope_multi
Figure 8.
Figure 8.
Positions and proportion of the non-canonical sgRNA among the COVID-19 genome from the results of the BIO-LARGE dataset. In the figure, all the non-canonical RNA are bucketed according to their position (10 nucleotide windows). The height of the spike illustrates the number of non-canonical sgRNA in the windows. The height corresponds to the total number of sgRNAs in a window is divided by 10. The red bar shows that in this window, the two tools share the same number of sgRNA. The green bar shows non-canonical sgRNA found only by periscope_multi, and the yellow represents those found only by periscope. The star represents an area with a high divergence between the two tools. Yellow stars display a divergence from periscope. Green stars represent divergence with periscope_multi, and the red stars show divergence with periscope_multi corresponding to the sgRNA labeled as N* in periscope, and the blue star shows divergence with periscope corresponding to ORF7b that are considered as canonical sgRNA in periscope_multi and not in periscope. Below the figure are the genes annotated according to their position.

Similar articles

References

    1. Lamers M.M., Haagmans B.L.. SARS-CoV-2 pathogenesis. Nat. Rev. Microbiol. 2022; 20:270–284. - PubMed
    1. Kim D., Lee J.-Y., Yang J.-S., Kim J.W., Kim V.N., Chang H.. The architecture of SARS-CoV-2 transcriptome. Cell. 2020; 181:914–921. - PMC - PubMed
    1. Long S. SARS-CoV-2 subgenomic RNAs: characterization, utility, and perspectives. Viruses. 2021; 13:1923. - PMC - PubMed
    1. Nomburg J., Meyerson M., DeCaprio J.A.. Pervasive generation of non-canonical subgenomic RNAs by SARS-CoV-2. Genome Med. 2020; 12:108. - PMC - PubMed
    1. Mori A., Lavezzari D., Pomari E., Deiana M., Piubelli C., Capobianchi M.R., Castilletti C.. sgRNAs: a SARS-CoV-2 emerging issue. Aspects Mol. Med. 2023; 1:100008. - PMC - PubMed

LinkOut - more resources