. 2024 Sep 2;221(9):e20231820.
doi: 10.1084/jem.20231820. Epub 2024 Aug 16.

ACLY and ACSS2 link nutrient-dependent chromatin accessibility to CD8 T cell effector responses

Affiliations

ACLY and ACSS2 link nutrient-dependent chromatin accessibility to CD8 T cell effector responses

Irem Kaymak et al. J Exp Med. .

Abstract

Coordination of cellular metabolism is essential for optimal T cell responses. Here, we identify cytosolic acetyl-CoA production as an essential metabolic node for CD8 T cell function in vivo. We show that CD8 T cell responses to infection depend on acetyl-CoA derived from citrate via the enzyme ATP citrate lyase (ACLY). However, ablation of ACLY triggers an alternative, acetate-dependent pathway for acetyl-CoA production mediated by acyl-CoA synthetase short-chain family member 2 (ACSS2). Mechanistically, acetate fuels both the TCA cycle and cytosolic acetyl-CoA production, impacting T cell effector responses, acetate-dependent histone acetylation, and chromatin accessibility at effector gene loci. When ACLY is functional, ACSS2 is not required, suggesting acetate is not an obligate metabolic substrate for CD8 T cell function. However, loss of ACLY renders CD8 T cells dependent on acetate (via ACSS2) to maintain acetyl-CoA production and effector function. Together, ACLY and ACSS2 coordinate cytosolic acetyl-CoA production in CD8 T cells to maintain chromatin accessibility and T cell effector function.


Conflict of interest statement

Disclosures: Z.P. Fan reported grants from Agios Pharmaceuticals during the conduct of the study. At the time that this research was conducted, T.P. Roddy was employed by Agios Pharmaceuticals. S.M. Kaech reported personal fees from Evolveimmune Therapeutics, Arvinas, Simcha Therapeutics, Afffini-T Therapeutics, and Siren Biotechnology outside the submitted work. R.G. Jones reported grants from Agios Pharmaceuticals and Van Andel Institute during the conduct of the study; “other” from Wisent Biosciences and Immunomet Therapeutics; non-financial support from Servier Pharmaceuticals; and personal fees from Agios Pharmaceuticals outside the submitted work. No other disclosures were reported.

Figures

Figure 1.
Figure 1.
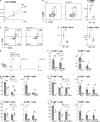
Mitochondrial citrate production defines effector CD8 T cells. (A) Schematic of in vivo LCMV screen. Naïve Thy1.1+ P14 CD8 T cells were transduced with a metabolic-targeting lentiviral shRNA library and transferred into naïve Thy1.2+ hosts followed by LCMV Arm infection. Thy1.1+ cells were sorted from the spleen 7 dpi (1° response) or 5 days after rechallenge with LCMV cl-13 on day 30 (2° response). shRNA barcode enrichment in naïve, 1°, or 2° P14 T cells was determined from genomic DNA by next-generation sequencing (NGS). (B) In vivo genomic screen of TCA cycle enzymes involved in Teff cell responses to LCMV infection. The plot shows the enrichment of shRNAs (log2 ratio of shRNA/control) in P14 cells isolated from primary (LCMV Arm) and secondary (LCMV cl-13) response screens. Positive (+) and negative (−) controls are indicated (n = 4–5 mice). (C) Schematic of TCA cycle metabolites and enzymes. Biochemical reactions in the cytosol (cyto) and mitochondrion (mito) are indicated. (D) scRNAseq of CD8 T cells isolated from LCMV Arm–infected mice at 8 dpi. Left: t-SNE plot identifying major CD8 T cell populations. Right: Density (top) and violin (bottom) plots for Cs and Acly expression in CD8 T cell subpopulations. A Kruskal–Wallis test followed by a pairwise Wilcox comparison was used to calculate Bonferroni adjusted P values. (E) Density plot for combined expression of non-canonical TCA cycle genes (Mpc1/2, Cs, Slc25a1, Acly) in CD8 T cells isolated from LCMV Arm–infected mice at 8 dpi.
Figure S1.
Figure S1.
scRNAseq analysis of CD8 T cells from LCMV Arm infection. Related to Fig. 1. scRNAseq analysis of CD8 T cells isolated from LCMV Arm–infected mice at 8 dpi. (A) t-SNE plot identifying major CD8 T cell populations in the spleen of infected mice. (B) Density (top) and violin (bottom) plots for Mpc1, Cd44, and Cx3cr1 in the indicated CD8 T cell subpopulations. Indicated numbers are Bonferroni-adjusted P values. (C and D) Gzmb, IFN-γ, Il2ra (C) and Id2 and Il7r (D) expression in the indicated CD8 T cell subpopulations. (E) Heat map of the relative expression of mitochondrial citrate production and export genes across naïve, effector, and memory CD8 T cell subsets isolated from LCMV Arm–infected mice, mined from previously published RNAseq datasets (Pauken et al., 2016; Man et al., 2017; Philip et al., 2017). A Kruskal–Wallis test followed by a pairwise Wilcox comparison was used to calculate Bonferroni adjusted P values (B–D).
Figure 2.
Figure 2.
ACLY is essential for effector CD8 T cell responses. (A) Percentage of OVA-specific (Tet+) CD8 T cells in the blood of LmOVA-infected control (WT) or T cell Acly-deficient (KO) mice over time (up to 28 dpi). Data shown are mean ± SEM (five mice/group). Inset: Immunoblot of ACLY and actin protein levels in whole cell lysates from in vitro–activated control (WT) or Acly-deficient (KO) CD8 T cells. (B–F) Expansion and effector function of antigen-specific CD8 T cells isolated from the spleen of LmOVA-infected control (WT) and Acly-deficient (KO) mice at 7 dpi (n = 5–7/group). (B) Representative flow cytometry plots of CD44 versus OVA-Tet expression. (C) Percentage and total number of OVA-Tet+ T cells in the spleen at 7 dpi. (D) Representative flow cytometry plots of CD44 versus IFN-γ expression in CD8 T cells at 7 dpi. (E and F) Percentage and total number of IFN-γ+ (E) and GZMB+ (F) CD8 T cells in the spleen of infected mice at 7 dpi. All results are representative of two or more independent experiments. Data are shown as mean ± SEM. *P < 0.05; **P < 0.01; ***P < 0.001 by unpaired two-tailed t test (A, C, E, and F). Source data are available for this figure: SourceData F2.
Figure S2.
Figure S2.
Expansion and cytokine production of WT and Acly-deficient CD8 T cells. Related to Fig. 2. (A) Cell numbers of activated WT (solid line) and Acly KO (dashed line) CD8 T cells cultured in IMDM (n = 3/group). (B–D) Effector function of antigen-specific CD8 T cells isolated from the spleen of LmOVA-infected control (WT) and Acly-deficient (KO) mice 7 dpi (n = 5–7/group). (B) Shown are representative flow cytometry plots of CD44 versus granzyme B (GZMB) expression in CD8 T cells, and tabulation of percent CD44+GZMB+ CD8 T cells in the spleen at 7 dpi. (C) Representative flow cytometry plots for IFN-γ versus TNF-α expression in CD8 T cells from the spleen of LmOVA-infected control (WT) and Acly-deficient (KO) mice at 7 dpi (mean ± SD, n = 5–7). (D) Percentage and total number of polyfunctional (IFN-γ+TNF-α+) CD8 T cells in the spleen of LmOVA-infected mice at 7 dpi. (E) Schematic of adoptive transfer model for CRISPR/Cas9-modifed P14 T cells followed by LCMV Arm infection. (F) Percentage (left) and total number (right) of control (sgCtrl) or Acly-deleted (sgAcly) CD8 P14 T cells isolated from the spleen of LCMV Arm–infected mice 7 dpi (n = 4/group). (G and H) Cellular phenotype and effector function of control (sgCtrl) or Acly-deleted (sgAcly) CD8 P14 T cells isolated from the spleen of LCMV Arm–infected mice 7 dpi (n = 4/group). (G) Percentage (left) and number (right) of KLRG1+ SLECs and CD127+ MPECs in spleens from LCMV-infected mice. (H) Percentage (left) and number (right) of IFNγ+, TNFα+, and IFNγ+TNFα+ P14 T cells in the spleen at 7 dpi. (I and J) Cellular phenotype and effector function of control (sgCtrl) or Acly-deleted (sgAcly) CD8 P14 T cells isolated from the spleen of LCMV Arm–infected mice 20 dpi (n = 4/group). (I) Percentage (left) and number (right) of SLECs (KLRG+) and MPECs (CD127+) in spleens from LCMV-infected mice. (J) Percentage (left) and number (right) of IFNγ+, TNFα+, and IFNγ+TNFα+ P14 T cells in the spleen at 20 dpi. All results are representative of two or more independent experiments. Data are shown as mean ± SEM. *P < 0.05; **P < 0.01; ***P < 0.001; ****P < 0.0001 by unpaired two-tailed t test (A, B, D, and F–J).
Figure S3.
Figure S3.
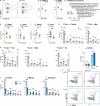
Metabolic characterization of Acly-deficient CD8 T cells. Related to Figs. 3 and 4. (A) Flow cytometry plots of CD45.2 versus forward scatter (FSC-A) to monitor the expansion of transferred OT-I CD8 T cells (Acly KO, knockout) in CD45.1 hosts following LmOVA-infection (6 dpi). (B) Percentage of CD45.2+ T cells in spleens of LmOVA-infected mice (6 dpi) that received WT or Acly KO CD45.2+ OT-I CD8 T cells (n = 4/group). (C) Percentage of IFN-γ+ OT-I CD8 T cells from the experiment described in panel B. (D) Pathway analysis of the top 10 KEGG pathways upregulated in Acly-deficient (KO) OT-I CD8 T cells (relative to controls) from LmOVA-infected mice (6 dpi). Combined score accounts for LogFC and P value) for top differentially regulated genes. (E and F) Basal and maximal ATP production rates from (E) OXPHOS or (F) glycolysis for OT-I CD8 T cells treated with vehicle control (Ctrl) or ACLY inhibitor (ACLYi). (G) Fractional enrichment (%) of [U-13C]glucose-derived mass isotopologues of intracellular citrate (Cit, M+0–6), fumarate (Fum, M+0–4), and malate (Mal, M+0–4) for in vitro-activated control (WT) or Acly-deficient (KO) CD8 T cells (n = 3/group). (H) Fractional enrichment (%) of [U-13C]glutamine-derived mass isotopologues of intracellular glutamate (Glu, M+0–5), citrate (Cit, M+0–6), and malate (Mal, M+0–4) for in vitro–activated control (WT) or Acly-deficient (KO) CD8 T cells (n = 3/group). (I) Fractional enrichment of U-[13C6]glucose versus U-[13C2]acetate labeling into citrate for OT-I cells isolated from LmOVA-infected mice at 6 dpi. LmOVA-specific OT-I T cells were cultured ex vivo with U-[13C6]glucose at two different concentrations (5 and 25 mM, light and dark gray) versus U-[13C2]acetate (0.4 and 1 mM, light and dark blue) for 4 h prior to analysis (n = 3/group). Shown is the overall enrichment of 13C carbon from glucose or acetate into the citrate pool. (J) MID of U-[13C6]glucose versus U-[13C2]acetate labeling into citrate, malate, and aspartate in OT-I cells isolated from LmOVA-infected mice at 6 dpi. Cells were isolated from LmOVA-infected mice and cultured ex vivo in medium containing 5 mM U-[13C6]glucose and 1 mM [12C]acetate (light gray) or 5 mM [12C]glucose and 1 mM U-[13C2]-acetate (dark blue) for 4 h prior to analysis (n = 3/group). (K) Representative flow cytometry plots of CD44 expression versus OVA-Tet binding by CD8 T cells isolated from the spleens of LmOVA-infected WT or KO mice at 7 dpi. Mice administered acetate (+) or vehicle control (−) by oral gavage are indicated. All results are representative of two or more independent experiments. Data are shown as mean ± SEM. *P < 0.05; **P < 0.01; ***P < 0.001; ****P < 0.0001 by unpaired two-tailed t test (B, E, F, and I) or two-way ANOVA with Sidak’s multiple comparison test (G, H, and J).
Figure 3.
Figure 3.
ACLY regulates CD8 T cell metabolic capacity and acetyl-CoA production. (A) List of the top 10 KEGG pathways downregulated in Acly-deficient (KO) OT-I CD8 T cells (relative to controls) from LmOVA-infected mice (6 dpi, n = 3–4/group). The combined score accounts for LogFC and P-value for top differentially regulated genes. (B and C) Bioenergetic analysis of OT-I CD8 T cells isolated from LmOVA-infected mice at 6 dpi. T cells were treated either with ACLY inhibitor (ACLYi, BMS-303141 10 μM) or solvent control (Ctrl) for 2 h prior to analysis via Seahorse assay (n = 15–20). (B) Total ATP production rates from glycolysis (gly) and OXPHOS for control or ACLYi-treated T cells. (C) SRC was calculated as the percent increase of uncoupled (FCCP) respiration above baseline. (D) Heatmap depicting expression of OXPHOS genes in control (WT) and Acly-deficient (KO) OT-I CD8 T cells isolated from LmOVA-infected mice at 6 dpi (n = 3/group). Red = comparatively high expression, Blue = comparatively low expression. (E–I) CD8 T cells were activated in vitro for 72 h and then cultured with [U-13C6]glucose for 2 h (n = 3/group). (E) Abundance of [U-13C6]glucose-derived mass isotopologues of intracellular citrate (Cit), fumarate (Fum), and malate (Mal) for activated control (WT) or Acly-deficient (KO) CD8 T cells. Shown are relative peak intensities for each isotopologue for the indicated TCA cycle metabolites. (F) Ratio of M+2 malate to M+2 citrate relative peak intensities for control (WT) or Acly-deficient (KO) CD8 T cells. (G) Fractional enrichment (%) of [U-13C6]glucose labeling into acetyl-CoA (Ac-CoA M+2) in in vitro–activated control (WT) or Acly-deficient (KO) CD8 T cells (n = 3/group). (H) Total relative abundance of acetyl-CoA in CD8 T cells as in G (n = 3/group). Cells were cultured under physiologic conditions (VIM-PCS). (I) Fractional enrichment (%) of [U-13C6]glucose labeling into acetyl groups (M+2) of acetyl-carnitine, acetyl-spermidine, and acetyl-glutamate in control (WT) or Acly-deficient (KO) CD8 T cells (n = 3/group). (J) Histogram of H3K27Ac levels 48 h after activation in vitro in WT (closed) and ACLY KO (open) CD8 T cells as determined by intracellular staining and flow cytometry. All results are representative of two or more independent experiments. Data are shown as mean ± SEM. *P < 0.05; **P < 0.01; ***P < 0.001; ****P < 0.0001 by unpaired two-tailed t test (B, C, and E–I).
Figure 4.
Figure 4.
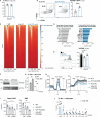
Acetate is an alternate fuel for acetyl-CoA production in CD8 T cells. (A) Schematic depicting contributions of glucose (via ACLY) and acetate (via ACSS2) to acetyl-CoA production. (B and C) Contribution of glucose and acetate to acetyl-CoA metabolism in CD8 Teff cells activated for 72 h in vitro then cultured for 2 h with indicated heavy carbon metabolite (n = 3/group). (B) Fractional enrichment (%) of U-[13C6]glucose (5 mM, gray) versus U-[13C2]acetate (1 mM, blue) labeling into acetyl-CoA (M+2) in activated CD8 T cells. (C) Fractional enrichment (%) of U-[13C6]glucose versus U[13C2]-acetate labeling into acetyl groups (M+2) of acetyl-carnitine and acetyl-methionine. (D) Fractional enrichment of U-[13C6]glucose versus U-[13C2]acetate labeling into acetylated sites of histone H3.1 (K14/23) and histone H4 (K5/12) of OT-I cells isolated from LmOVA-infected mice at 6 dpi. Cells were cultured ex vivo for 4 h with U-[13C6]glucose (5 mM, gray) or U-[13C2]acetate (2 mM, blue) prior to analysis (n = 3/group). Enrichment of 13C carbon at one (Ac1) or both (Ac2) lysine residues is indicated. (E–G) Contribution of glucose and acetate to acetyl-CoA metabolism in Acly-deficient CD8 Teff cells. Activated CD8 T cells from control (WT) and Acly-deficient (KO) mice were cultured with medium containing U-[13C6]glucose (5 mM, gray) or U-[13C2]acetate (1 mM, blue) (6–24 h) prior to metabolite extraction and analysis (n = 3/group). Fractional enrichment (%) of U-[13C6]glucose (gray) or U-[13C2]acetate (blue) into E, M+2 acetyl-CoA (6 h culture), F, M+2 acetyl-carnitine and -spermidine (6 h culture), and G, palmitate (M+0 to M+16, 24 h culture). (H) Immunoblot of histone H3 acetylation in activated control (WT) and Acly-deficient (KO) CD8 T cells cultured for 24 h in medium lacking (−) or containing (+) 5 mM acetate. Shown are levels of total (H3Ac) or site-specific (H3K9ac, H3K14ac, H3K18ac, H3K23ac, H3K27ac) acetylated histone H3 as well as total histone H3 in T cell histone extracts. (I) Histograms of H3K27ac in WT (closed) and ACLY KO (open) CD8 T cells treated with 5 mM acetate (blue) or control solvent (gray). (J–L) Effect of dietary acetate administration on CD8 Teff cell responses in vivo. (J) Schematic of LmOVA infection protocol. Control (WT) or Acly-deficient (KO) mice were administered PBS or acetate daily (1,000 mg/kg via oral gavage) starting 2 days prior to LmOVA infection (n = 3–7/group). (K) Representative flow cytometry plots of CD44 versus IFN-γ expression by CD8 T cells from the spleens of LmOVA-infected WT or KO mice (at 7 dpi) treated with (+) or without (−) acetate. (L) Percentage of IFN-γ–producing CD8 T cells from LmOVA-infected WT or KO mice (7 dpi) without (−) or with (+) oral acetate treatment. (M) Percentage (%) of OVA-specific CD8 T cells from mice as in L. All results are representative of two or more independent experiments. Data are shown as mean ± SEM. *P < 0.05; **P < 0.01; ***P < 0.001; ****P < 0.0001 by unpaired two-tailed t test (B–F, L, and M) or two-way ANOVA with Sidak’s multiple comparison test (G). Source data are available for this figure: SourceData F4.
Figure 5.
Figure 5.
Chromatin accessibility and expression of effector genes in CD8 T cells requires ACLY and is rescued by acetate. (A) Representative histogram and tabulation of CD44 surface expression by WT or Acly KO CD8 T cells activated for 48 h in media ± 1 mM acetate (n = 7/group). (B) Representative flow cytometry plots and tabulation of TBET+GZMB+ WT or Acly KO CD8 T cells treated as in A. (C) Histogram of chromatin accessibility (mean counts per million, CPMs) ± 2 kilobases (Kb) around transcriptional start site (TSS) in WT or Acly KO CD8 T cells treated as in A (n = 4/group). TES = transcriptional end site. (D) Pathway overrepresentation analysis using the Hallmark gene sets (MSigDB) of the top 500 DARs decreased by ACLY deletion. (E) Pathway overrepresentation analysis (as in D) of the top 500 DARs in Acly KO CD8 T cells increased by the addition of acetate (Acly KO+Acet vs. Acly KO). (F) Representative ATAC-seq tracks of the Il2ra (CD25) and Nfkb1 loci from WT or Acly KO CD8 T cells treated as in A. (G) Representative ATAC-seq tracks of the Ifng, Gzmb, and Tbx21 (TBET) loci in WT or Acly KO CD8 T cells treated as in A. All results are representative of two or more independent experiments. Data are shown as mean ± SEM. **P < 0.01; ***P < 0.001 by one-way ANOVA with Sidak’s multiple comparison test (A and B).
Figure S4.
Figure S4.
Acetate enhances Acly-deficient CD8 T cell function and chromatin accessibility. Related to Figs. 5 and 6. (A) Percent of live Acly KO CD8 T cells after 48 h of in vitro activation ±1 mM acetate (n = 7/condition). (B) Representative flow cytometry plots and tabulation of CD44+IFN-γ+ Acly KO CD8 T cells treated as in A (n = 7/group). (C) Heatmap of chromatin accessibility (red = less accessible, blue = more accessible) ±2 kilobases (Kb) around transcriptional start sites for in vitro–activated WT, Acly KO, and Acly KO CD8 T cells treated with 1 mM acetate. TES = transcriptional end site. N = 3 biological replicates/sample. (D) Overrepresentation analysis using the GTRD transcription factor targets gene set (MSigDB) for the top 500 Acly-dependent (decreased in Acly KO versus WT) and acetate-rescued (Acly KO+acet versus Acly KO) DARs. Shown are transcription factors predicted to bind promoter binding sites of ACLY- and acetate-dependent DARs. (E) Representative histogram and tabulation of percent CD25+ WT and Acly KO CD8 T cells treated as in A (n = 7/group). (F) Immunoblot of ACSS2 and actin protein levels in whole cell lysates from activated CD8 T cells expressing control (shCtrl) or Acss2-targeting (shAcss2) shRNAs. (G) Fractional enrichment (%) of U-[13C6]glucose (5 mM) labeling into acetyl-CoA (M+2) in activated control (WT, closed bars) and Acly-deficient (KO, open bars) CD8 T cells. T cells were cultured for 6 h with 13C-tracers in the presence of solvent control (Ctrl) or ACSS2 inhibitor (ACSS2i) (n = 3/group). (H) OCR and ECAR of WT or Acly KO CD8 T cells ±ACSS2 inhibitor (ACSS2i) following in vitro activation for 48 h in VIM media +1 mM acetate (n = 4/group). Oligo, oligomycin; Rot/AA, rotenone and antimycin A; Mon, monensin. (I) Basal OCR (average of the first 4 measurements) and SRC (maximal minus basal OCR) of CD8 T cells cultured as in H. (J) Fractional enrichment (%) of U-[13C6]glucose (5 mM) labeling into palmitate in Acly-deficient (KO, open bars) CD8 T cells. T cells were cultured for 6 h with 13C-tracers in the presence of solvent control or ACSS2i. All results are representative of two or more independent experiments. Data are shown as mean ± SEM. *P < 0.05; **P < 0.01; ***P < 0.001; by unpaired two-tailed t test (A, B, and G) or one- or two-way ANOVA with Sidak’s multiple comparison test (E, I, and J). Source data are available for this figure: SourceData FS4.
Figure 6.
Figure 6.
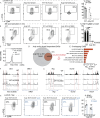
ACSS2 drives acetate-dependent metabolic compensation in ACLY-deficient CD8 T cells. (A) Density (top) and violin (bottom) plots for Acss1 and Acss2 mRNA expression in CD8 T cells isolated from LCMV Arm–infected mice at 8 dpi. (B) Immunoblot of ACSS2 and actin protein levels in whole cell lysates from in vitro-activated control (WT) and Acly-deficient (KO) CD8 T cells. Actin blot was also used in Fig. 2 A. (C) Percent glucose (left) or acetate (right) consumed from media during the first 24 h of activation by WT or KO CD8 T cells ± an ACSS2 inhibitor (ACSS2i) (n = 4/group). Media contained 5 mM glucose and 1 mM acetate. (D) Fractional enrichment (%) of U-[13C6]glucose (left) versus U-[13C2]acetate (right) labeling (4 h culture) into acetyl-CoA (M+2) in in vitro-activated CD8 T cells expressing control (shCtrl), Acly- (shAcly), or Acss2- (shAcss2) targeting shRNAs (n = 3/group). (E) Fractional enrichment (%) of U-[13C6]glucose (5 mM, gray) versus U-[13C2]acetate (1 mM, blue) labeling into acetyl-CoA (M+2) in activated control (WT, closed bars) and Acly-deficient (KO, open bars) CD8 T cells. T cells were cultured for 6 h with 13C-tracers in the presence of solvent control (Ctrl) or ACSS2i (n = 3). (F) Fractional enrichment (%) of U-[13C2]acetate (1 mM, blue) labeling in the acetyl group (M+2) of acetyl-carnitine in Acly-deficient (KO) CD8 T cells cultured for 6 h with solvent control (Ctrl) or Acss2 inhibitor (ACSS2i) (n = 3). (G) Mass isotopologue distribution (MID) for U-[13C2]acetate-derived palmitate in Acly-deficient (KO) CD8 T cells cultured for 6 h with solvent control (Ctrl) or ACSS2i (n = 3). (H) Total cholesterol (left) or free fatty acids (right) in activated WT or KO CD8 T cells ± ACSS2i in vitro cultured for 72 h (n = 4). (I) Immunoblot of histone H3 acetylation in activated control (WT) and Acly-deficient (KO) CD8 T cells cultured for 6 h in medium containing glucose and acetate (5 mM each) plus solvent control (−) or Acss2 inhibitor (+). Shown are levels of total acetylated (acH3), K27 acetylated (H3K27ac), K14 acetylated (H3K14ac), and total histone H3 in histone extracts. All results are representative of two or more independent experiments. Data are shown as mean ± SEM. A Kruskal–Wallis test followed by a pairwise Wilcox comparison was used to calculate Bonferroni adjusted P values (A). *P < 0.05; **P < 0.01; ***P < 0.001; ****P < 0.0001 by one-way ANOVA with Sidak’s multiple comparison test (C, D, G, and H) or unpaired two-tailed t test (E and F). Source data are available for this figure: SourceData F6.
Figure S5.
Figure S5.
ACSS2 is required for CD8 Teff function in the absence of ACLY. Related to Fig. 7. (A–D) Schematic of adoptive transfer of WT and Acly KO OT-I cells transduced with either shCtrl or shAcss2 shRNAs and LmOVA infection protocol for B–D. (B) Percentage and total number of Thy1.1+ T cells (genotypes indicated) in the spleen of LmOVA-infected mice at 7 dpi. (C) Percent OVA-tetramer+CD44+ CD8 T cells in the blood over time in mice treated as in A. (D) Total number of IFN-γ+ Thy1.1+ cells (genotypes indicated) in the spleen of LmOVA-infected mice at 7 dpi. (E) Representative flow cytometry plots and tabulation of percent IFN-γ+CD44+ WT or Acly KO CD8 T cells activated in vitro for 48 h ±ACSS2 inhibitor (n = 7/group). (F) Tabulation of percent live CD8 T cells treated as in E. (G) Heat map of chromatin accessibility ±2 kilobases (Kb) around transcriptional start sites of genes in WT or Acly KO CD8 T cells activated in vitro for 48 h in the presence or absence of ACSS2i (6.25 μM) (n = 4/group). TES = Transcription end site, Blue = more accessible, Red = less accessible. (H) Representative ATAC-seq tracks for the Atf3 and Tnfsr4 (OX40) loci in WT or Acly KO CD8 T cells treated as in E. (I) Tabulation of percent CD25+ (Il2ra) WT or Acly KO CD8 T cells treated as in E (n = 7/group). (J) Tabulation of GZMB and TBET double positive CD8 T cells 48 h after in vitro activation treated as indicated. WT, Acly KO, and Acly KO + acetate data taken from Fig. 5 B. (K) Left: Schematic of adoptive transfer of Acly KO OT-I cells transduced with either shCtrl or shAcss2 shRNAs and LmOVA infection protocol. Mice were administered PBS or acetate daily (1,000 mg/kg, via oral gavage) starting 2 days prior to LmOVA infection (n = 3–7/group). Right: Total number of IFN-γ+ Thy1.1 T cells (genotypes indicated) in the spleen of LmOVA-infected mice at 7 dpi. All results are representative of two or more independent experiments. Data are shown as mean ± SEM. *P < 0.05; **P < 0.01; ***P < 0.001; ****P < 0.0001; by unpaired two-tailed t test (B, D, and K) or one-way ANOVA with Sidak’s multiple comparison test (E, F, I, and J).
Figure 7.
Figure 7.
ACSS2 is essential for CD8 Teff responses in the absence of ACLY. (A) Representative flow cytometry plots and tabulation of IFN-γ–producing WT or Acly KO OT-I CD8 T cells (expressing control [shCtrl] or Acss2-targeting [shAcss2] shRNAs) 7 dpi with LmOVA (3–5/group). (B) Representative flow cytometry plots and tabulation of TBET+GZMB+ WT and Acly KO CD8 T cells following in vitro activation in the presence or absence of ACSS2i for 48 h (n = 7/group). (C) Histogram of chromatin accessibility (mean counts per million, CPM) ±2 kilobases (Kb) around transcriptional start sites (TSS), in CD8 T cells treated as in B (n = 4/group). TES = transcription end site. (D) Venn diagram of significantly decreased DARs from Acly KO versus WT compared to the significantly decreased DARs from Acly KO+ACSS2i vs WT CD8 T cells treated as in B. (E) Pathway overrepresentation analysis using the Hallmark Gene Sets (MSigDB) of overlapping DARs from D. (F and G) Representative ATAC tracks from CD8 T cells treated as in B. Shown are gene tracks for Il2ra and Nfkb1 loci (F) and representative effector gene loci (G, Ifng, Gzmb, Tbx21). Red gates highlight DARs of interest. (H) Effect of dietary acetate on ACSS2-deficient CD8 T cell responses in vivo. Acly-deficient (KO) Thy1.1+ OT-I CD8 T cells were transduced with control (shCtrl) or Acss2-targeting (shAcss2) shRNAs, followed by adoptive transfer and infection with LmOVA. Mice were administered PBS or acetate daily (1,000 mg/kg, via oral gavage) starting 2 days prior to LmOVA infection (n = 3–7/group). Representative flow cytometry plots and tabulation of percent CD44 versus IFN-γ expression by CD8 T cells from the spleens of LmOVA-infected mice 7 dpi (n = 3–6). All results are representative of two or more independent experiments. Data are shown as mean ± SEM. *P < 0.05; ****P < 0.0001 by unpaired two-tailed t test (A and H) or one-way ANOVA with Sidak’s multiple comparison test (B).

References

    1. Ahn, E., Araki K., Hashimoto M., Li W., Riley J.L., Cheung J., Sharpe A.H., Freeman G.J., Irving B.A., and Ahmed R.. 2018. Role of PD-1 during effector CD8 T cell differentiation. Proc. Natl. Acad. Sci. USA. 115:4749–4754. 10.1073/pnas.1718217115 - DOI - PMC - PubMed
    1. Amemiya, H.M., Kundaje A., and Boyle A.P.. 2019. The ENCODE blacklist: Identification of problematic regions of the genome. Sci. Rep. 9:9354. 10.1038/s41598-019-45839-z - DOI - PMC - PubMed
    1. Arnold, P.K., Jackson B.T., Paras K.I., Brunner J.S., Hart M.L., Newsom O.J., Alibeckoff S.P., Endress J., Drill E., Sullivan L.B., and Finley L.W.S.. 2022. A non-canonical tricarboxylic acid cycle underlies cellular identity. Nature. 603:477–481. 10.1038/s41586-022-04475-w - DOI - PMC - PubMed
    1. Badovinac, V.P., Porter B.B., and Harty J.T.. 2002. Programmed contraction of CD8(+) T cells after infection. Nat. Immunol. 3:619–626. 10.1038/ni804 - DOI - PubMed
    1. Bailis, W., Shyer J.A., Zhao J., Canaveras J.C.G., Al Khazal F.J., Qu R., Steach H.R., Bielecki P., Khan O., Jackson R., et al. . 2019. Distinct modes of mitochondrial metabolism uncouple T cell differentiation and function. Nature. 571:403–407. 10.1038/s41586-019-1311-3 - DOI - PMC - PubMed

LinkOut - more resources